
|
|||||
|
 | |
| |
| |
| |
| |
| |
|
Gene: FBXO7 |
Gene summary for FBXO7 |
| Gene information | Species | Human | Gene symbol | FBXO7 | Gene ID | 25793 |
| Gene name | F-box protein 7 | |
| Gene Alias | FBX | |
| Cytomap | 22q12.3 | |
| Gene Type | protein-coding | GO ID | GO:0000079 | UniProtAcc | Q9Y3I1 |
Top |
Malignant transformation analysis |
| Identification of the aberrant gene expression in precancerous and cancerous lesions by comparing the gene expression of stem-like cells in diseased tissues with normal stem cells |
| Entrez ID | Symbol | Replicates | Species | Organ | Tissue | Adj P-value | Log2FC | Malignancy |
| 25793 | FBXO7 | HTA11_1938_2000001011 | Human | Colorectum | AD | 1.59e-05 | 4.91e-01 | -0.0811 |
| 25793 | FBXO7 | HTA11_347_2000001011 | Human | Colorectum | AD | 3.22e-06 | 3.35e-01 | -0.1954 |
| 25793 | FBXO7 | HTA11_1391_2000001011 | Human | Colorectum | AD | 1.43e-08 | 4.83e-01 | -0.059 |
| 25793 | FBXO7 | HTA11_7696_3000711011 | Human | Colorectum | AD | 8.08e-03 | 2.33e-01 | 0.0674 |
| 25793 | FBXO7 | HTA11_99999970781_79442 | Human | Colorectum | MSS | 2.33e-12 | 4.99e-01 | 0.294 |
| 25793 | FBXO7 | HTA11_99999965062_69753 | Human | Colorectum | MSI-H | 2.24e-02 | 8.03e-01 | 0.3487 |
| 25793 | FBXO7 | HTA11_99999971662_82457 | Human | Colorectum | MSS | 1.95e-11 | 5.32e-01 | 0.3859 |
| 25793 | FBXO7 | A015-C-203 | Human | Colorectum | FAP | 1.40e-05 | -1.19e-01 | -0.1294 |
| 25793 | FBXO7 | A001-C-108 | Human | Colorectum | FAP | 2.98e-02 | -1.07e-01 | -0.0272 |
| 25793 | FBXO7 | A002-C-205 | Human | Colorectum | FAP | 6.28e-03 | -1.40e-01 | -0.1236 |
| 25793 | FBXO7 | A002-C-114 | Human | Colorectum | FAP | 8.55e-03 | -1.84e-01 | -0.1561 |
| 25793 | FBXO7 | A015-C-104 | Human | Colorectum | FAP | 2.30e-04 | -8.95e-02 | -0.1899 |
| 25793 | FBXO7 | A002-C-116 | Human | Colorectum | FAP | 6.96e-05 | -8.61e-02 | -0.0452 |
| 25793 | FBXO7 | F034 | Human | Colorectum | FAP | 1.35e-02 | -7.51e-02 | -0.0665 |
| 25793 | FBXO7 | LZE4T | Human | Esophagus | ESCC | 1.29e-18 | 3.11e-01 | 0.0811 |
| 25793 | FBXO7 | LZE5T | Human | Esophagus | ESCC | 2.51e-05 | 2.05e-01 | 0.0514 |
| 25793 | FBXO7 | LZE7T | Human | Esophagus | ESCC | 4.73e-10 | 7.54e-01 | 0.0667 |
| 25793 | FBXO7 | LZE8T | Human | Esophagus | ESCC | 5.66e-12 | 2.17e-01 | 0.067 |
| 25793 | FBXO7 | LZE22T | Human | Esophagus | ESCC | 3.46e-02 | 3.49e-01 | 0.068 |
| 25793 | FBXO7 | LZE24T | Human | Esophagus | ESCC | 1.29e-26 | 9.28e-01 | 0.0596 |
| Page: 1 2 3 4 5 6 7 8 |
| Tissue | Expression Dynamics | Abbreviation |
| Colorectum (GSE201348) |  | FAP: Familial adenomatous polyposis |
| CRC: Colorectal cancer | ||
| Colorectum (HTA11) |  | AD: Adenomas |
| SER: Sessile serrated lesions | ||
| MSI-H: Microsatellite-high colorectal cancer | ||
| MSS: Microsatellite stable colorectal cancer | ||
| Esophagus | 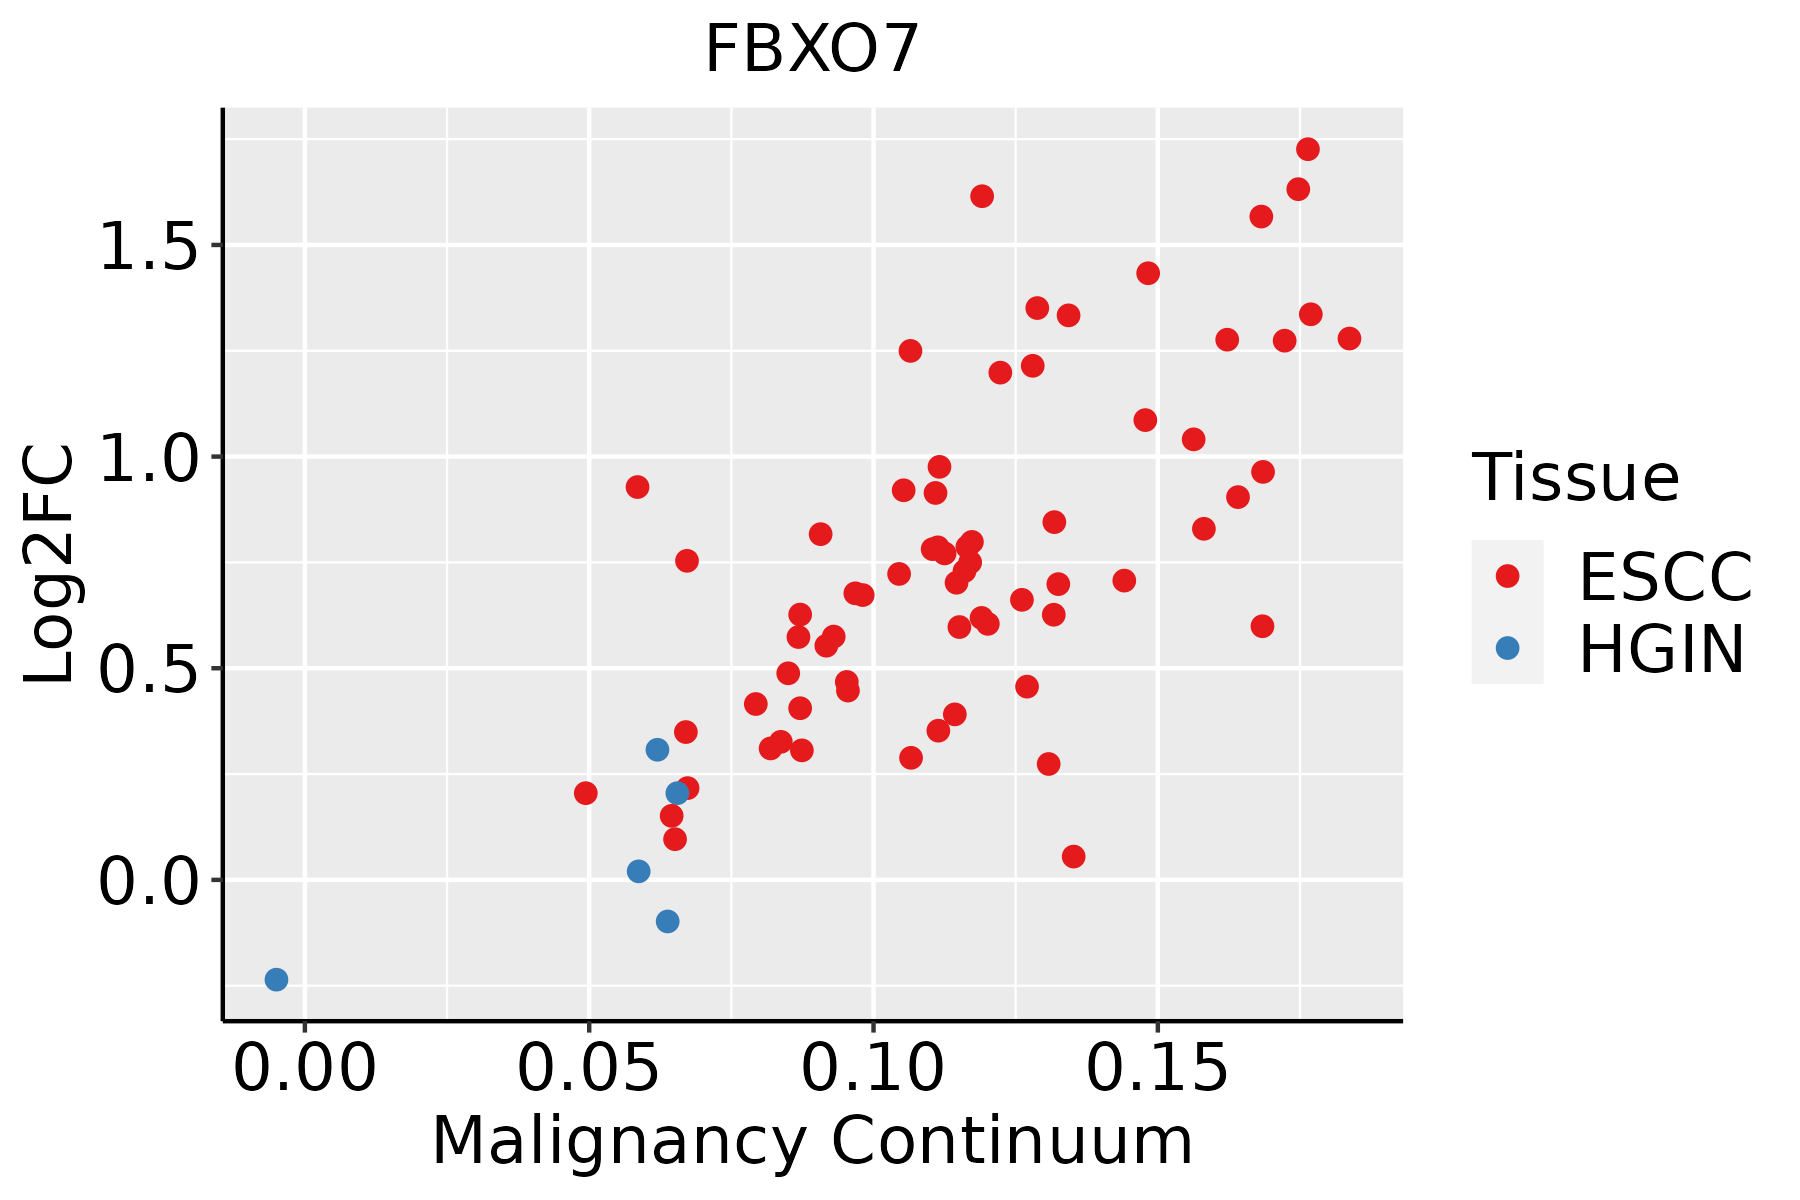 | ESCC: Esophageal squamous cell carcinoma |
| HGIN: High-grade intraepithelial neoplasias | ||
| LGIN: Low-grade intraepithelial neoplasias | ||
| Liver | 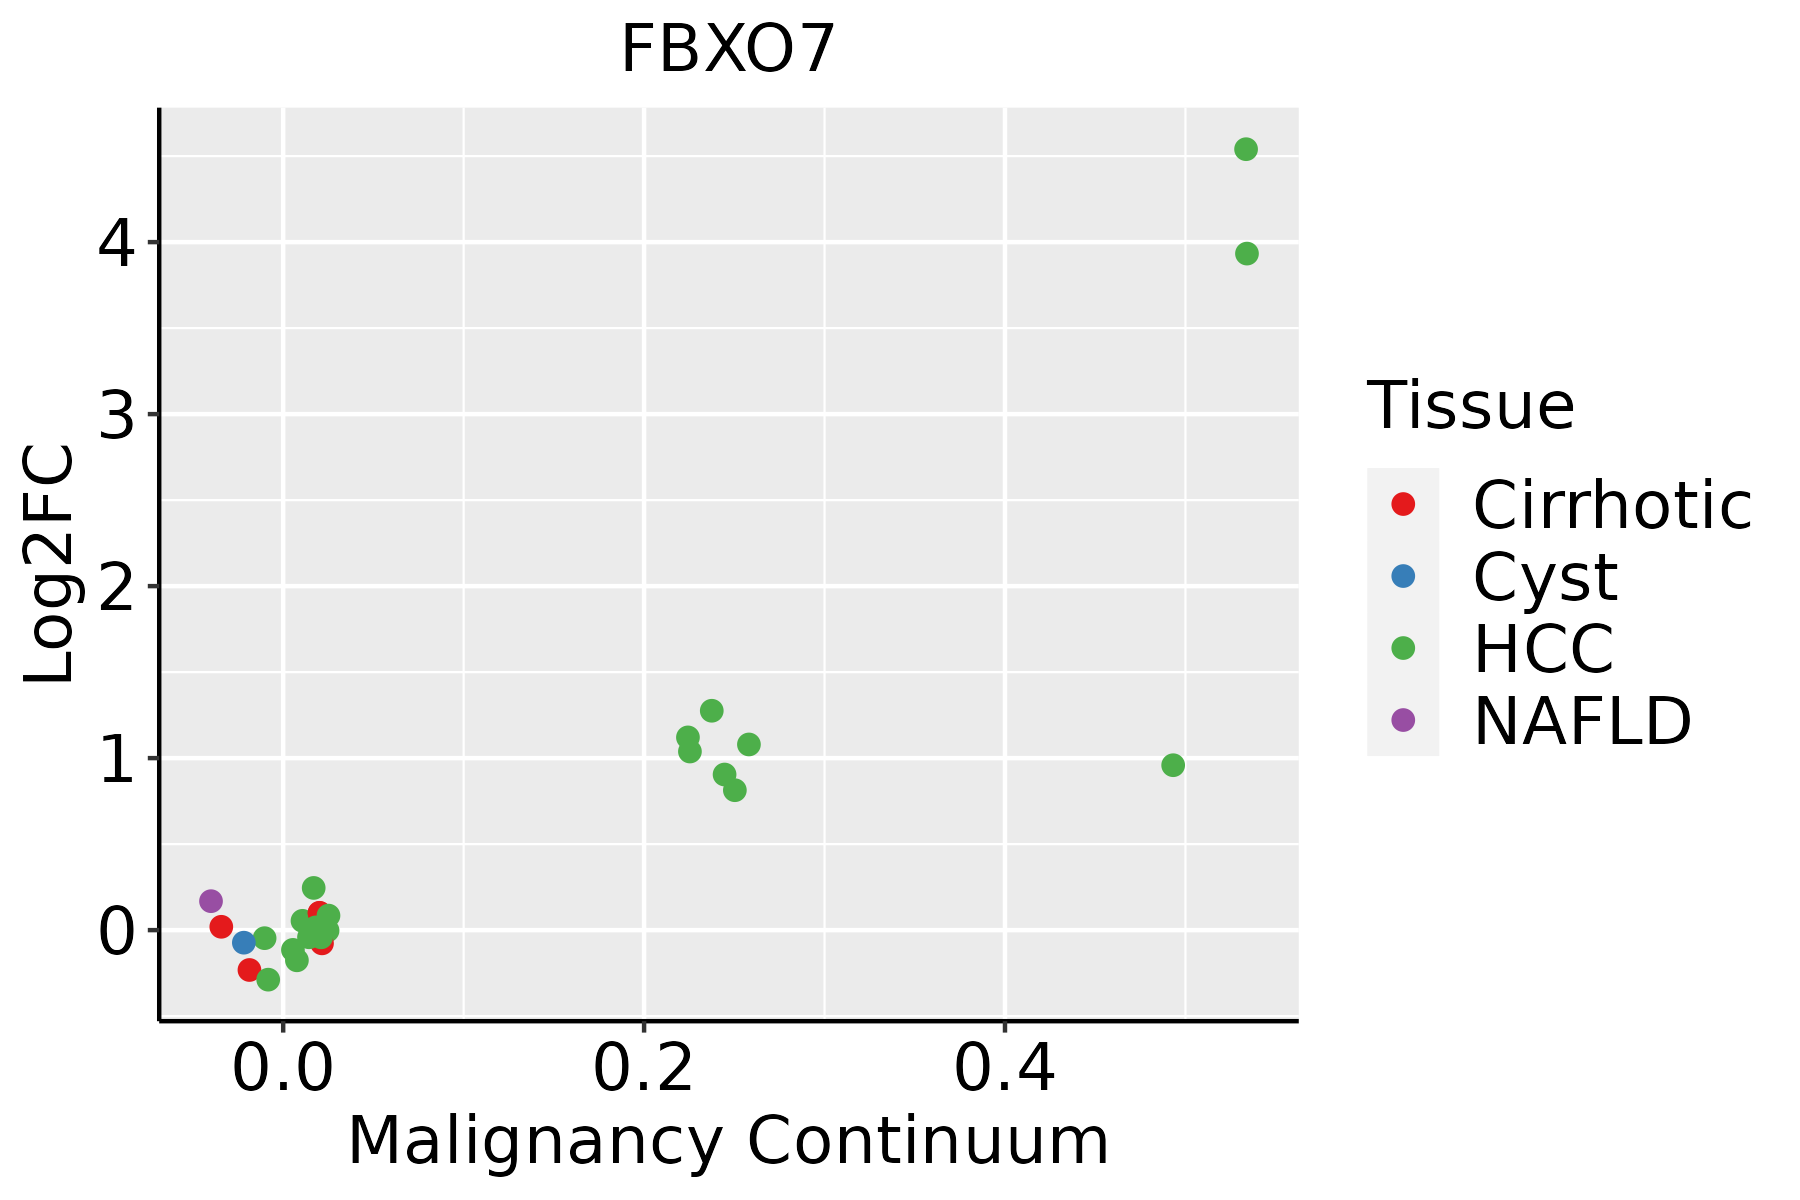 | HCC: Hepatocellular carcinoma |
| NAFLD: Non-alcoholic fatty liver disease | ||
| Oral Cavity | 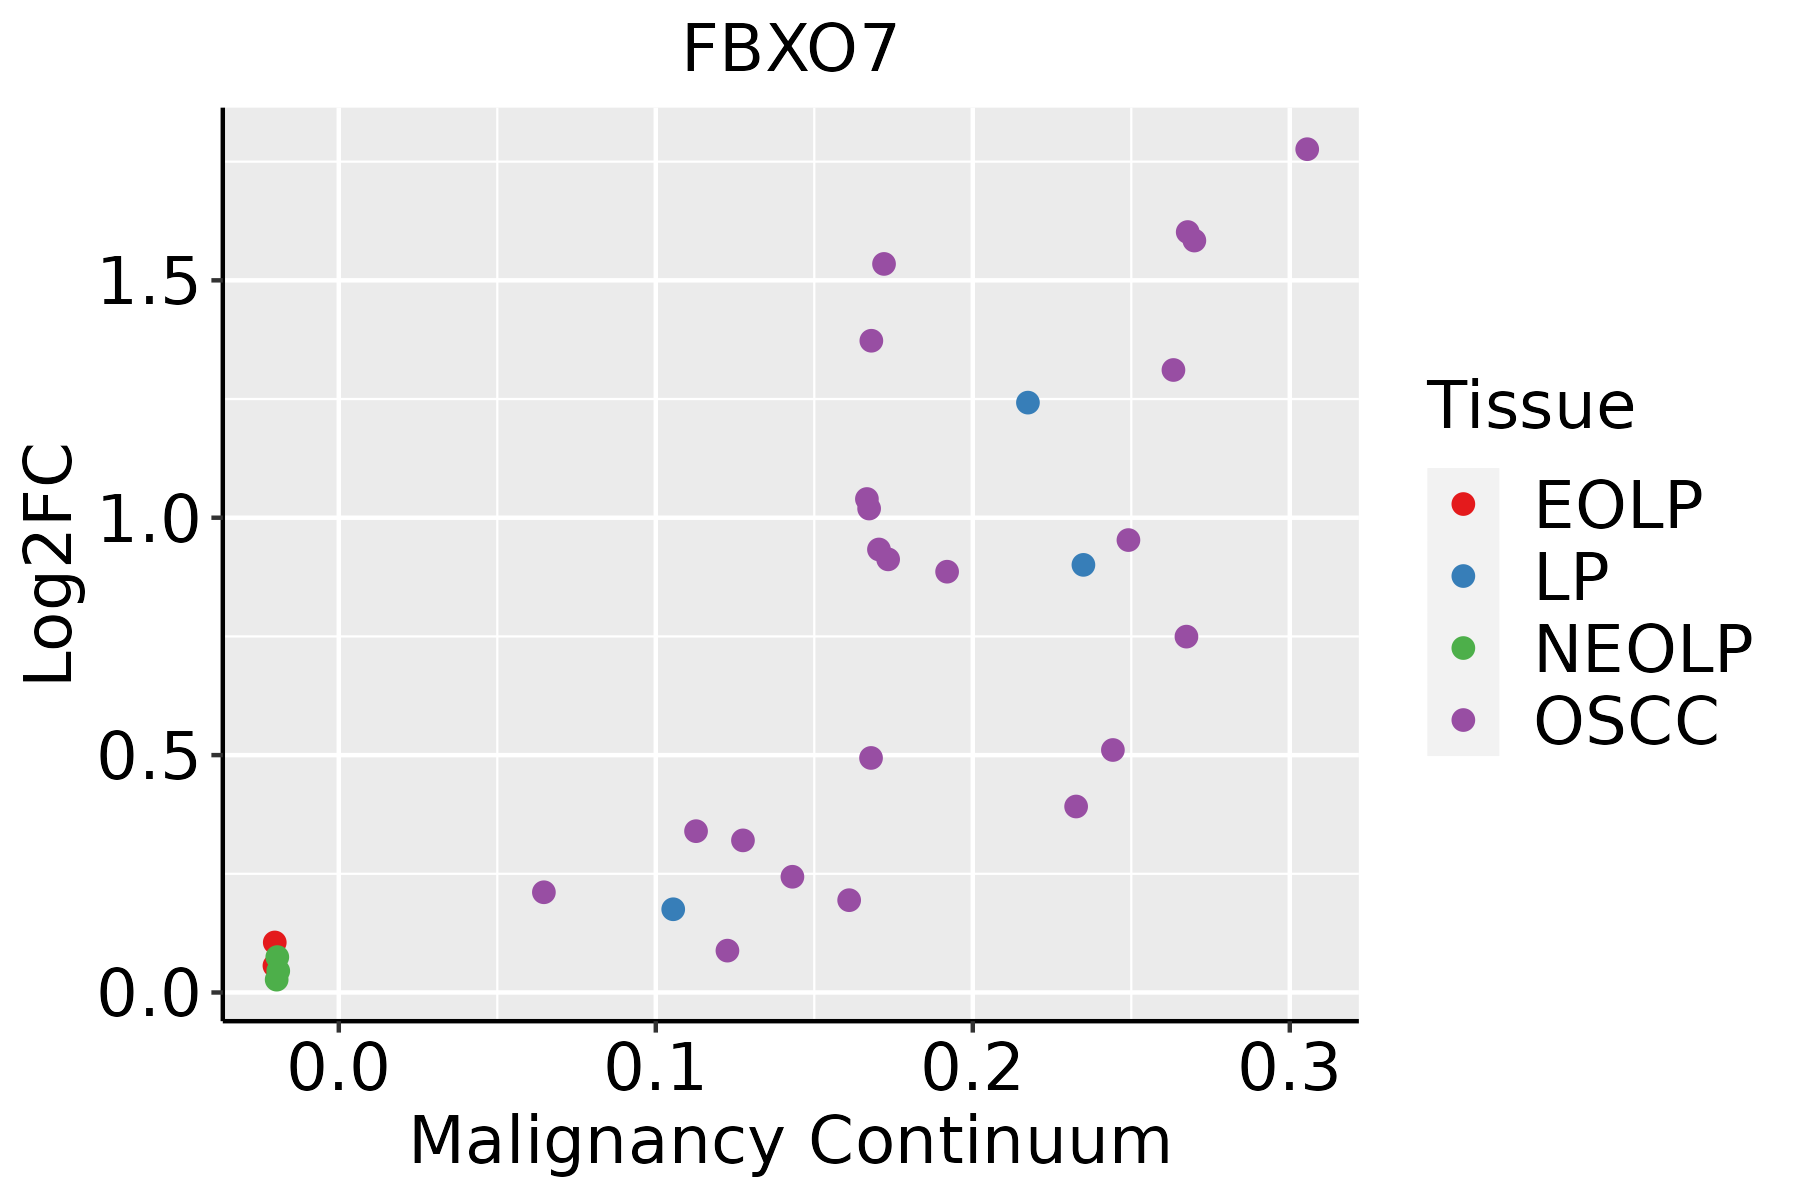 | EOLP: Erosive Oral lichen planus |
| LP: leukoplakia | ||
| NEOLP: Non-erosive oral lichen planus | ||
| OSCC: Oral squamous cell carcinoma | ||
| Skin | 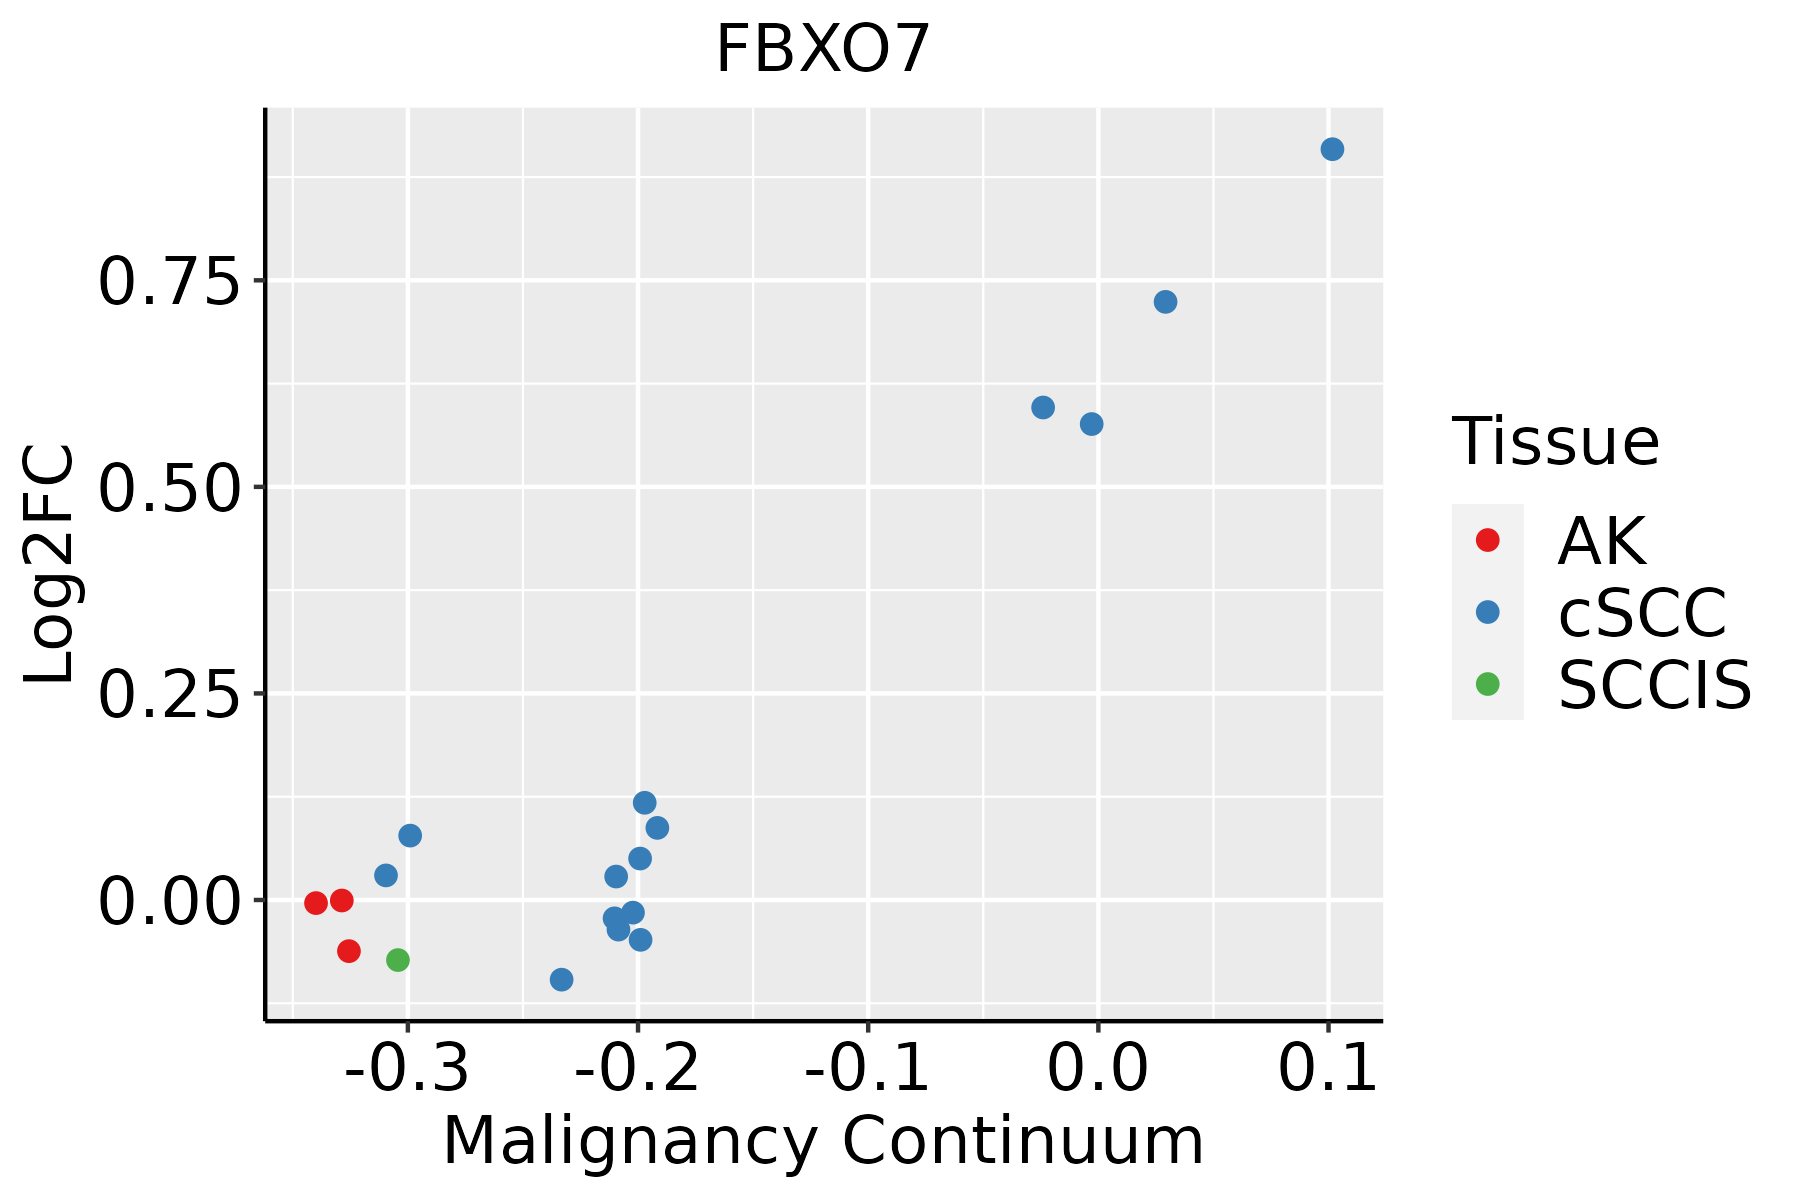 | AK: Actinic keratosis |
| cSCC: Cutaneous squamous cell carcinoma | ||
| SCCIS:squamous cell carcinoma in situ | ||
| Thyroid |  | ATC: Anaplastic thyroid cancer |
| HT: Hashimoto's thyroiditis | ||
| PTC: Papillary thyroid cancer |
| ∗log2FC in expression of this searched gene in stem-like cells from each diseased tissue sample relative to stem-like cells in normal samples in each tissue plotted against the malignancy continuum. Samples are colored based on if they are from different disease stage. |
Top |
Malignant transformation related pathway analysis |
| Find out the enriched GO biological processes and KEGG pathways involved in transition from healthy to precancer to cancer |
| Tissue | Disease Stage | Enriched GO biological Processes |
| Colorectum | AD |  |
| Colorectum | SER |  |
| Colorectum | MSS |  |
| Colorectum | MSI-H |  |
| Colorectum | FAP |  |
| ∗Top 15 enriched GO BP terms are showed in the bar plot of each disease state in each tissue. Each row represents a significant GO biological process which is colored according to the -log10(p.adjust). |
| Page: 1 2 3 4 5 6 7 8 9 |
| GO ID | Tissue | Disease Stage | Description | Gene Ratio | Bg Ratio | pvalue | p.adjust | Count |
| GO:0009896 | Colorectum | AD | positive regulation of catabolic process | 180/3918 | 492/18723 | 4.33e-16 | 1.94e-13 | 180 |
| GO:0031331 | Colorectum | AD | positive regulation of cellular catabolic process | 156/3918 | 427/18723 | 4.68e-14 | 1.05e-11 | 156 |
| GO:0006839 | Colorectum | AD | mitochondrial transport | 102/3918 | 254/18723 | 1.87e-12 | 3.08e-10 | 102 |
| GO:0072594 | Colorectum | AD | establishment of protein localization to organelle | 148/3918 | 422/18723 | 7.95e-12 | 1.04e-09 | 148 |
| GO:0031647 | Colorectum | AD | regulation of protein stability | 108/3918 | 298/18723 | 6.33e-10 | 5.08e-08 | 108 |
| GO:0022411 | Colorectum | AD | cellular component disassembly | 147/3918 | 443/18723 | 8.53e-10 | 6.76e-08 | 147 |
| GO:0010506 | Colorectum | AD | regulation of autophagy | 111/3918 | 317/18723 | 3.57e-09 | 2.35e-07 | 111 |
| GO:0006979 | Colorectum | AD | response to oxidative stress | 145/3918 | 446/18723 | 5.16e-09 | 3.23e-07 | 145 |
| GO:0006605 | Colorectum | AD | protein targeting | 105/3918 | 314/18723 | 1.39e-07 | 6.44e-06 | 105 |
| GO:0010821 | Colorectum | AD | regulation of mitochondrion organization | 57/3918 | 144/18723 | 2.43e-07 | 9.92e-06 | 57 |
| GO:0070585 | Colorectum | AD | protein localization to mitochondrion | 51/3918 | 125/18723 | 3.40e-07 | 1.33e-05 | 51 |
| GO:0062197 | Colorectum | AD | cellular response to chemical stress | 109/3918 | 337/18723 | 5.33e-07 | 1.95e-05 | 109 |
| GO:0070997 | Colorectum | AD | neuron death | 114/3918 | 361/18723 | 1.13e-06 | 3.72e-05 | 114 |
| GO:1903008 | Colorectum | AD | organelle disassembly | 46/3918 | 114/18723 | 1.81e-06 | 5.48e-05 | 46 |
| GO:0034599 | Colorectum | AD | cellular response to oxidative stress | 94/3918 | 288/18723 | 2.03e-06 | 6.02e-05 | 94 |
| GO:0072655 | Colorectum | AD | establishment of protein localization to mitochondrion | 47/3918 | 120/18723 | 3.76e-06 | 1.04e-04 | 47 |
| GO:1903146 | Colorectum | AD | regulation of autophagy of mitochondrion | 19/3918 | 33/18723 | 4.52e-06 | 1.21e-04 | 19 |
| GO:0000422 | Colorectum | AD | autophagy of mitochondrion | 35/3918 | 81/18723 | 4.94e-06 | 1.29e-04 | 35 |
| GO:0061726 | Colorectum | AD | mitochondrion disassembly | 35/3918 | 81/18723 | 4.94e-06 | 1.29e-04 | 35 |
| GO:0010822 | Colorectum | AD | positive regulation of mitochondrion organization | 32/3918 | 74/18723 | 1.22e-05 | 2.68e-04 | 32 |
| Page: 1 2 3 4 5 6 7 8 9 10 11 12 13 14 15 16 17 18 19 20 21 22 23 24 25 26 27 28 29 30 31 32 33 |
| Pathway ID | Tissue | Disease Stage | Description | Gene Ratio | Bg Ratio | pvalue | p.adjust | qvalue | Count |
| Page: 1 |
Top |
Cell-cell communication analysis |
| Identification of potential cell-cell interactions between two cell types and their ligand-receptor pairs for different disease states |
| Ligand | Receptor | LRpair | Pathway | Tissue | Disease Stage |
| Page: 1 |
Top |
Single-cell gene regulatory network inference analysis |
| Find out the significant the regulons (TFs) and the target genes of each regulon across cell types for different disease states |
| TF | Cell Type | Tissue | Disease Stage | Target Gene | RSS | Regulon Activity |
| ∗The dot plots of a searched regulon are shown for all cell subpopulations in each disease state of each tissue based on the regulon specific score inferred using pySCENIC and by calculating the average expression. |
| Page: 1 |
Top |
Somatic mutation of malignant transformation related genes |
| Annotation of somatic variants for genes involved in malignant transformation |
| Hugo Symbol | Variant Class | Variant Classification | dbSNP RS | HGVSc | HGVSp | HGVSp Short | SWISSPROT | BIOTYPE | SIFT | PolyPhen | Tumor Sample Barcode | Tissue | Histology | Sex | Age | Stage | Therapy Types | Drugs | Outcome |
| FBXO7 | SNV | Missense_Mutation | c.1042N>T | p.Asp348Tyr | p.D348Y | Q9Y3I1 | protein_coding | deleterious(0) | probably_damaging(1) | TCGA-AR-A24T-01 | Breast | breast invasive carcinoma | Female | <65 | III/IV | Chemotherapy | cytoxan | SD | |
| FBXO7 | SNV | Missense_Mutation | novel | c.1171N>C | p.Asp391His | p.D391H | Q9Y3I1 | protein_coding | deleterious(0) | probably_damaging(0.987) | TCGA-C8-A3M7-01 | Breast | breast invasive carcinoma | Female | <65 | III/IV | Unknown | Unknown | PD |
| FBXO7 | SNV | Missense_Mutation | c.997N>C | p.Val333Leu | p.V333L | Q9Y3I1 | protein_coding | tolerated(0.37) | benign(0.007) | TCGA-D8-A1XR-01 | Breast | breast invasive carcinoma | Female | <65 | I/II | Chemotherapy | adriamycin+cyclophosphamide | SD | |
| FBXO7 | insertion | Frame_Shift_Ins | novel | c.616_617insAAAATTT | p.Leu206GlnfsTer32 | p.L206Qfs*32 | Q9Y3I1 | protein_coding | TCGA-AC-A3QQ-01 | Breast | breast invasive carcinoma | Female | <65 | I/II | Unknown | Unknown | SD | ||
| FBXO7 | SNV | Missense_Mutation | c.823N>C | p.Lys275Gln | p.K275Q | Q9Y3I1 | protein_coding | tolerated(0.12) | possibly_damaging(0.795) | TCGA-AA-3510-01 | Colorectum | colon adenocarcinoma | Male | >=65 | I/II | Unknown | Unknown | SD | |
| FBXO7 | SNV | Missense_Mutation | rs376214763 | c.652G>A | p.Glu218Lys | p.E218K | Q9Y3I1 | protein_coding | deleterious(0.01) | probably_damaging(0.985) | TCGA-AA-3984-01 | Colorectum | colon adenocarcinoma | Female | <65 | I/II | Unknown | Unknown | SD |
| FBXO7 | SNV | Missense_Mutation | c.713N>T | p.Tyr238Phe | p.Y238F | Q9Y3I1 | protein_coding | deleterious(0) | probably_damaging(1) | TCGA-AA-A010-01 | Colorectum | colon adenocarcinoma | Female | <65 | I/II | Chemotherapy | folinic | CR | |
| FBXO7 | SNV | Missense_Mutation | c.848N>A | p.Ser283Tyr | p.S283Y | Q9Y3I1 | protein_coding | deleterious(0) | probably_damaging(0.914) | TCGA-AA-A010-01 | Colorectum | colon adenocarcinoma | Female | <65 | I/II | Chemotherapy | folinic | CR | |
| FBXO7 | SNV | Missense_Mutation | rs376455464 | c.521N>T | p.Ser174Leu | p.S174L | Q9Y3I1 | protein_coding | deleterious(0) | benign(0.058) | TCGA-CA-6717-01 | Colorectum | colon adenocarcinoma | Male | <65 | I/II | Chemotherapy | oxaliplatin | CR |
| FBXO7 | SNV | Missense_Mutation | c.1118N>A | p.Arg373Lys | p.R373K | Q9Y3I1 | protein_coding | tolerated(0.07) | probably_damaging(0.999) | TCGA-DM-A1HB-01 | Colorectum | colon adenocarcinoma | Male | >=65 | III/IV | Unknown | Unknown | SD |
| Page: 1 2 3 4 5 6 7 |
Top |
Related drugs of malignant transformation related genes |
| Identification of chemicals and drugs interact with genes involved in malignant transfromation |
| (DGIdb 4.0) |
| Entrez ID | Symbol | Category | Interaction Types | Drug Claim Name | Drug Name | PMIDs |
| Page: 1 |

Copyright 2023-Present -The University of Texas Health Science Center at Houston |