
|
|||||
|
 | |
| |
| |
| |
| |
| |
|
Gene: FBXO6 |
Gene summary for FBXO6 |
| Gene information | Species | Human | Gene symbol | FBXO6 | Gene ID | 26270 |
| Gene name | F-box protein 6 | |
| Gene Alias | FBG2 | |
| Cytomap | 1p36.22 | |
| Gene Type | protein-coding | GO ID | GO:0000075 | UniProtAcc | Q9NRD1 |
Top |
Malignant transformation analysis |
| Identification of the aberrant gene expression in precancerous and cancerous lesions by comparing the gene expression of stem-like cells in diseased tissues with normal stem cells |
| Entrez ID | Symbol | Replicates | Species | Organ | Tissue | Adj P-value | Log2FC | Malignancy |
| 26270 | FBXO6 | LZE24T | Human | Esophagus | ESCC | 2.29e-12 | 4.33e-01 | 0.0596 |
| 26270 | FBXO6 | P1T-E | Human | Esophagus | ESCC | 7.04e-04 | 2.49e-01 | 0.0875 |
| 26270 | FBXO6 | P2T-E | Human | Esophagus | ESCC | 3.78e-13 | 3.15e-01 | 0.1177 |
| 26270 | FBXO6 | P4T-E | Human | Esophagus | ESCC | 3.42e-08 | 1.62e-01 | 0.1323 |
| 26270 | FBXO6 | P5T-E | Human | Esophagus | ESCC | 2.15e-12 | 1.75e-01 | 0.1327 |
| 26270 | FBXO6 | P8T-E | Human | Esophagus | ESCC | 3.15e-12 | 2.97e-01 | 0.0889 |
| 26270 | FBXO6 | P9T-E | Human | Esophagus | ESCC | 4.64e-17 | 4.24e-01 | 0.1131 |
| 26270 | FBXO6 | P10T-E | Human | Esophagus | ESCC | 1.13e-02 | 1.01e-01 | 0.116 |
| 26270 | FBXO6 | P11T-E | Human | Esophagus | ESCC | 6.92e-13 | 6.45e-01 | 0.1426 |
| 26270 | FBXO6 | P12T-E | Human | Esophagus | ESCC | 1.14e-05 | 1.72e-01 | 0.1122 |
| 26270 | FBXO6 | P15T-E | Human | Esophagus | ESCC | 4.42e-08 | 1.91e-01 | 0.1149 |
| 26270 | FBXO6 | P16T-E | Human | Esophagus | ESCC | 9.06e-04 | 1.45e-01 | 0.1153 |
| 26270 | FBXO6 | P17T-E | Human | Esophagus | ESCC | 4.58e-14 | 5.06e-01 | 0.1278 |
| 26270 | FBXO6 | P19T-E | Human | Esophagus | ESCC | 1.95e-04 | 4.06e-01 | 0.1662 |
| 26270 | FBXO6 | P20T-E | Human | Esophagus | ESCC | 7.72e-21 | 4.20e-01 | 0.1124 |
| 26270 | FBXO6 | P21T-E | Human | Esophagus | ESCC | 1.13e-18 | 4.25e-01 | 0.1617 |
| 26270 | FBXO6 | P22T-E | Human | Esophagus | ESCC | 5.83e-14 | 2.40e-01 | 0.1236 |
| 26270 | FBXO6 | P23T-E | Human | Esophagus | ESCC | 3.36e-20 | 4.51e-01 | 0.108 |
| 26270 | FBXO6 | P24T-E | Human | Esophagus | ESCC | 5.30e-19 | 3.78e-01 | 0.1287 |
| 26270 | FBXO6 | P26T-E | Human | Esophagus | ESCC | 1.26e-07 | 1.76e-01 | 0.1276 |
| Page: 1 2 3 4 |
| Tissue | Expression Dynamics | Abbreviation |
| Esophagus | 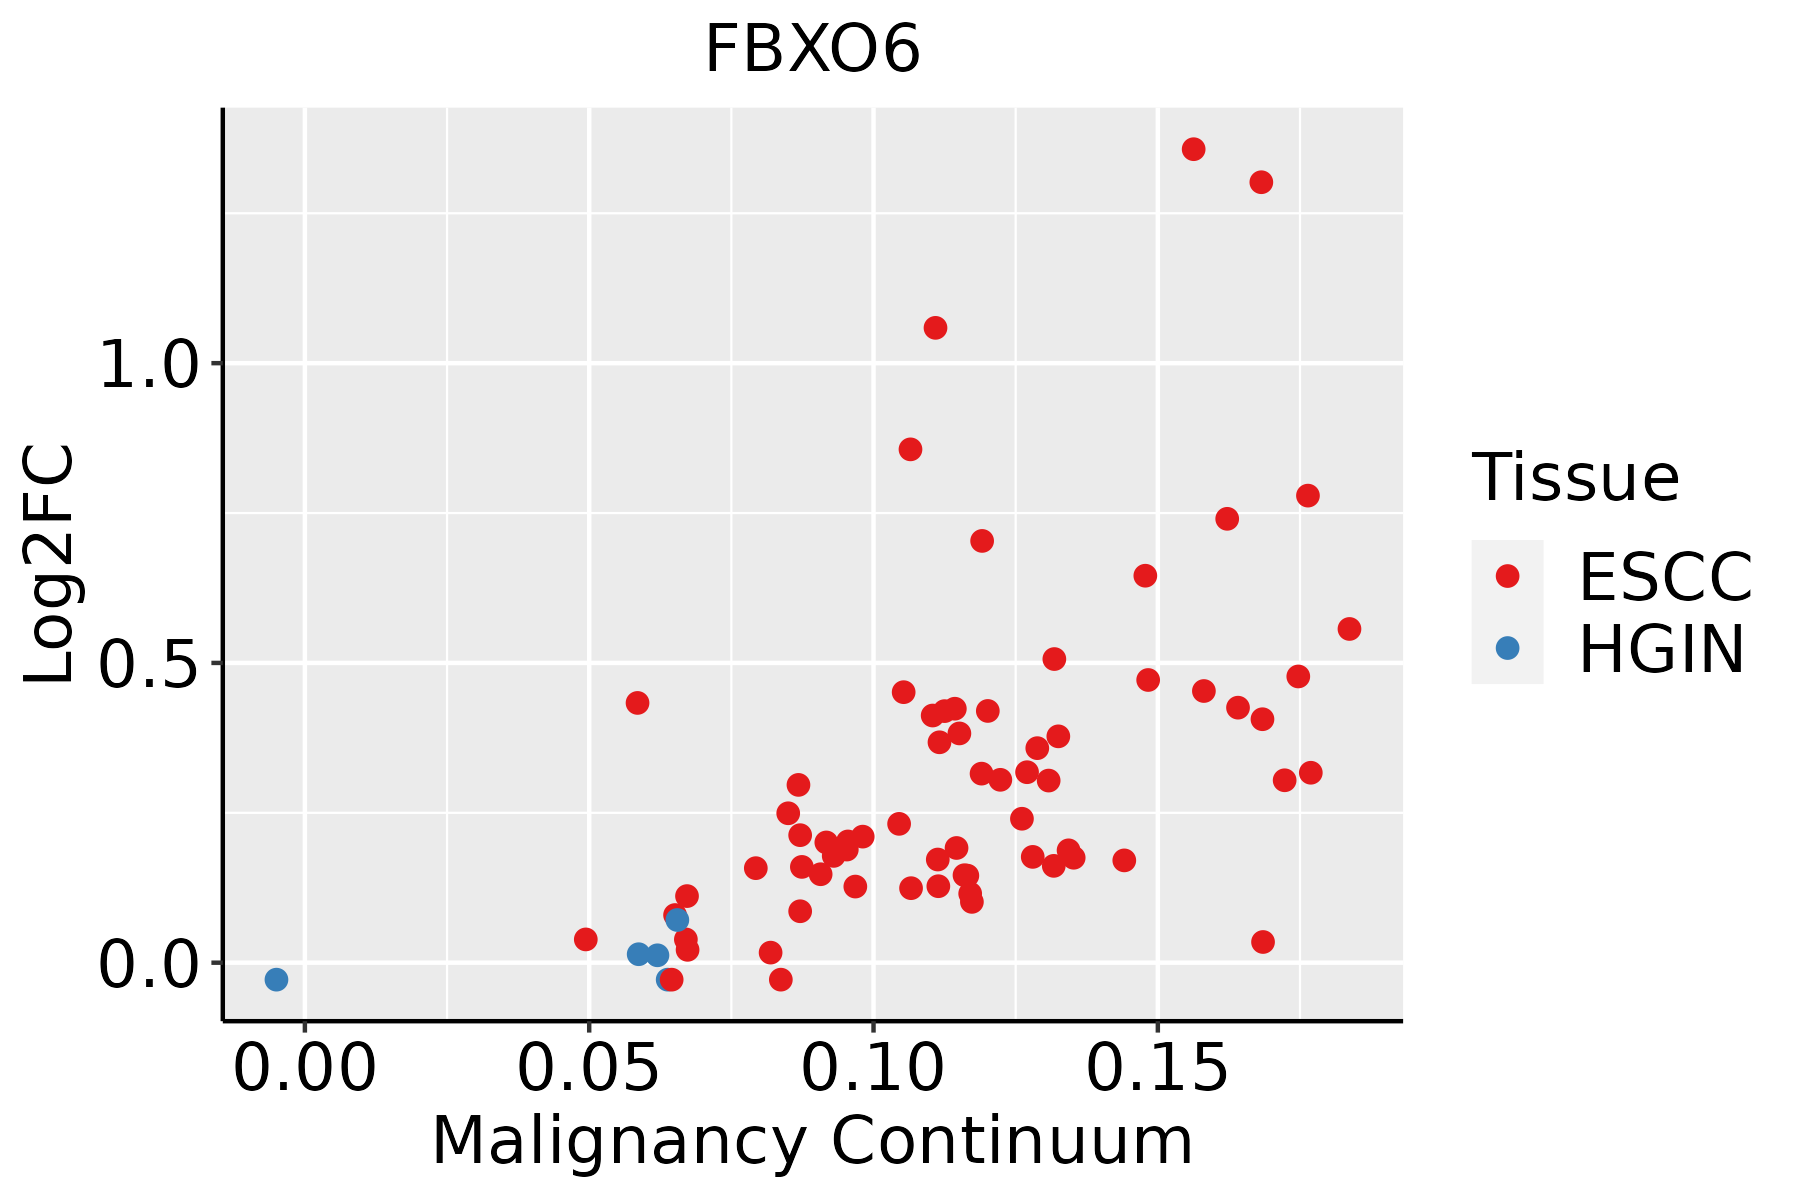 | ESCC: Esophageal squamous cell carcinoma |
| HGIN: High-grade intraepithelial neoplasias | ||
| LGIN: Low-grade intraepithelial neoplasias | ||
| Liver | 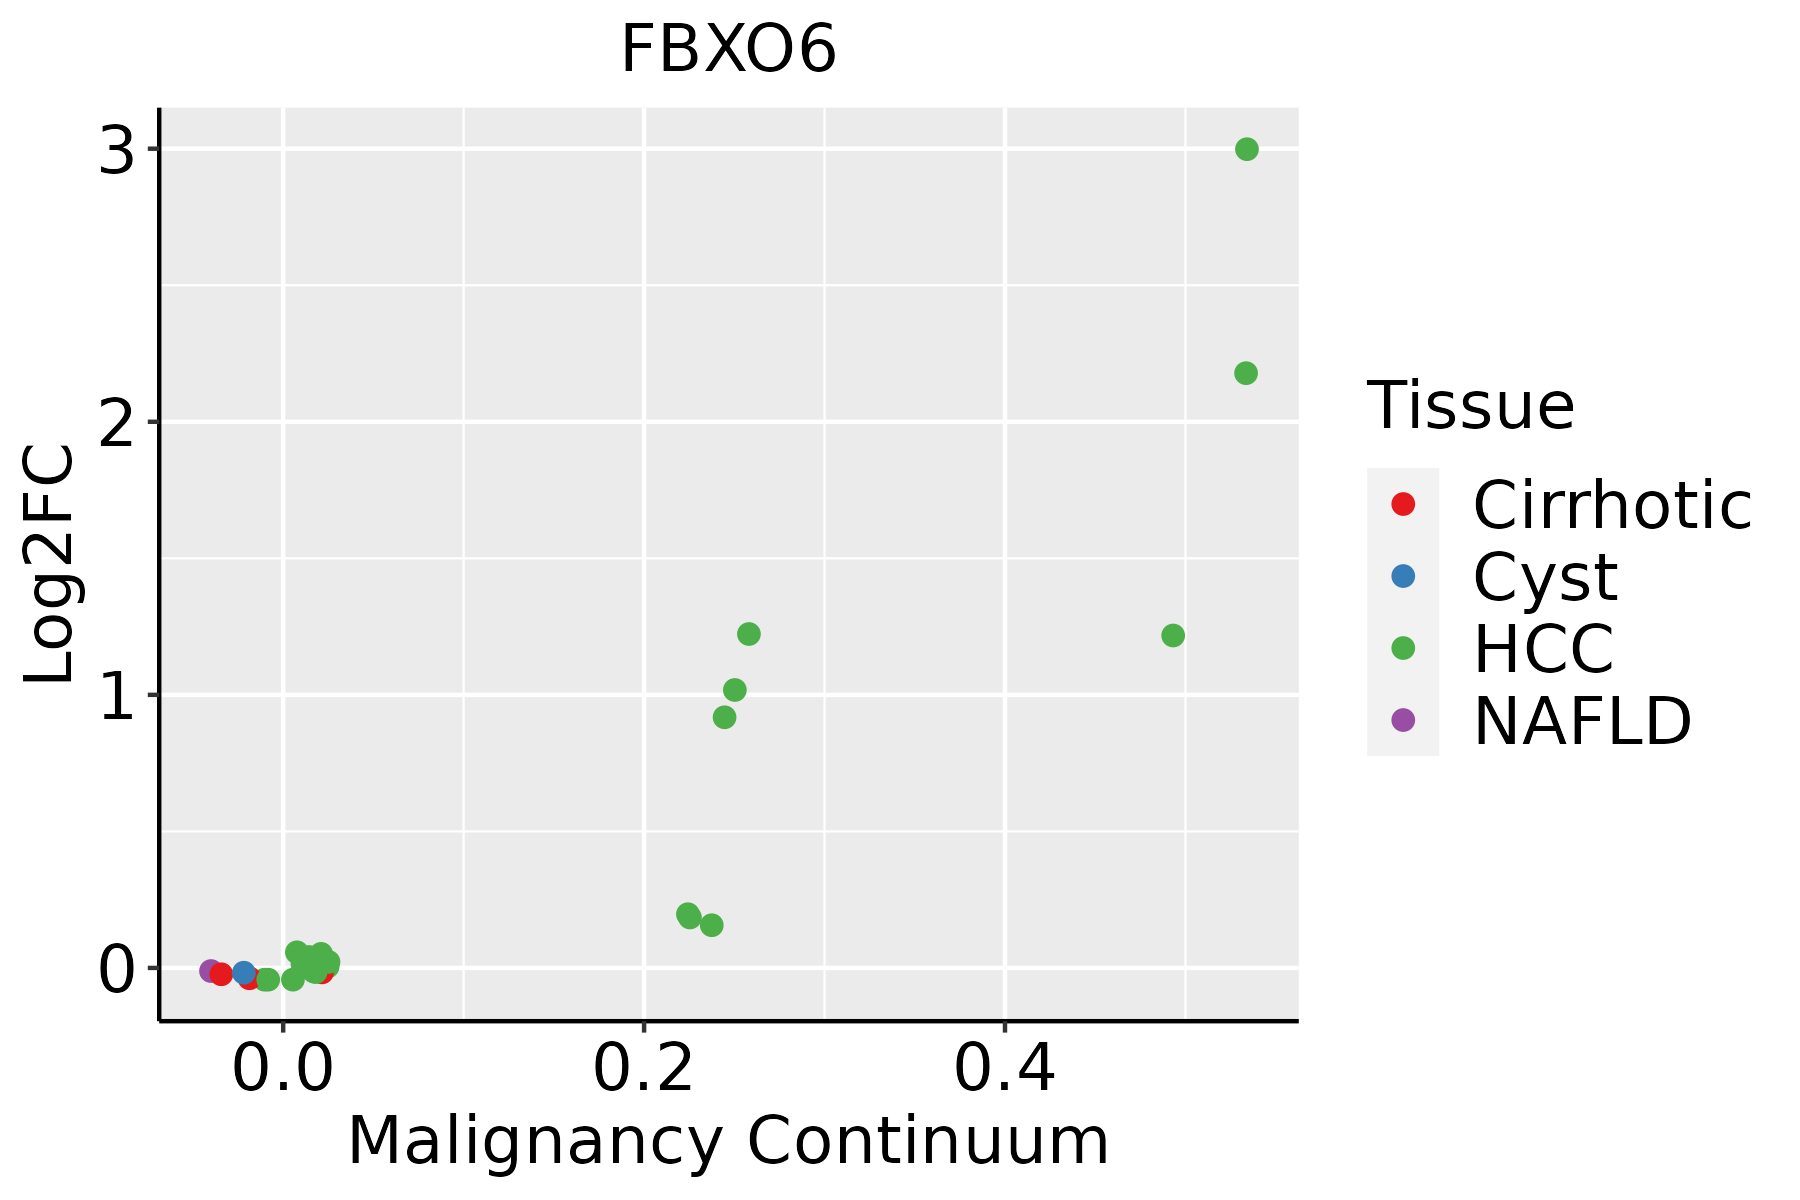 | HCC: Hepatocellular carcinoma |
| NAFLD: Non-alcoholic fatty liver disease | ||
| Oral Cavity | 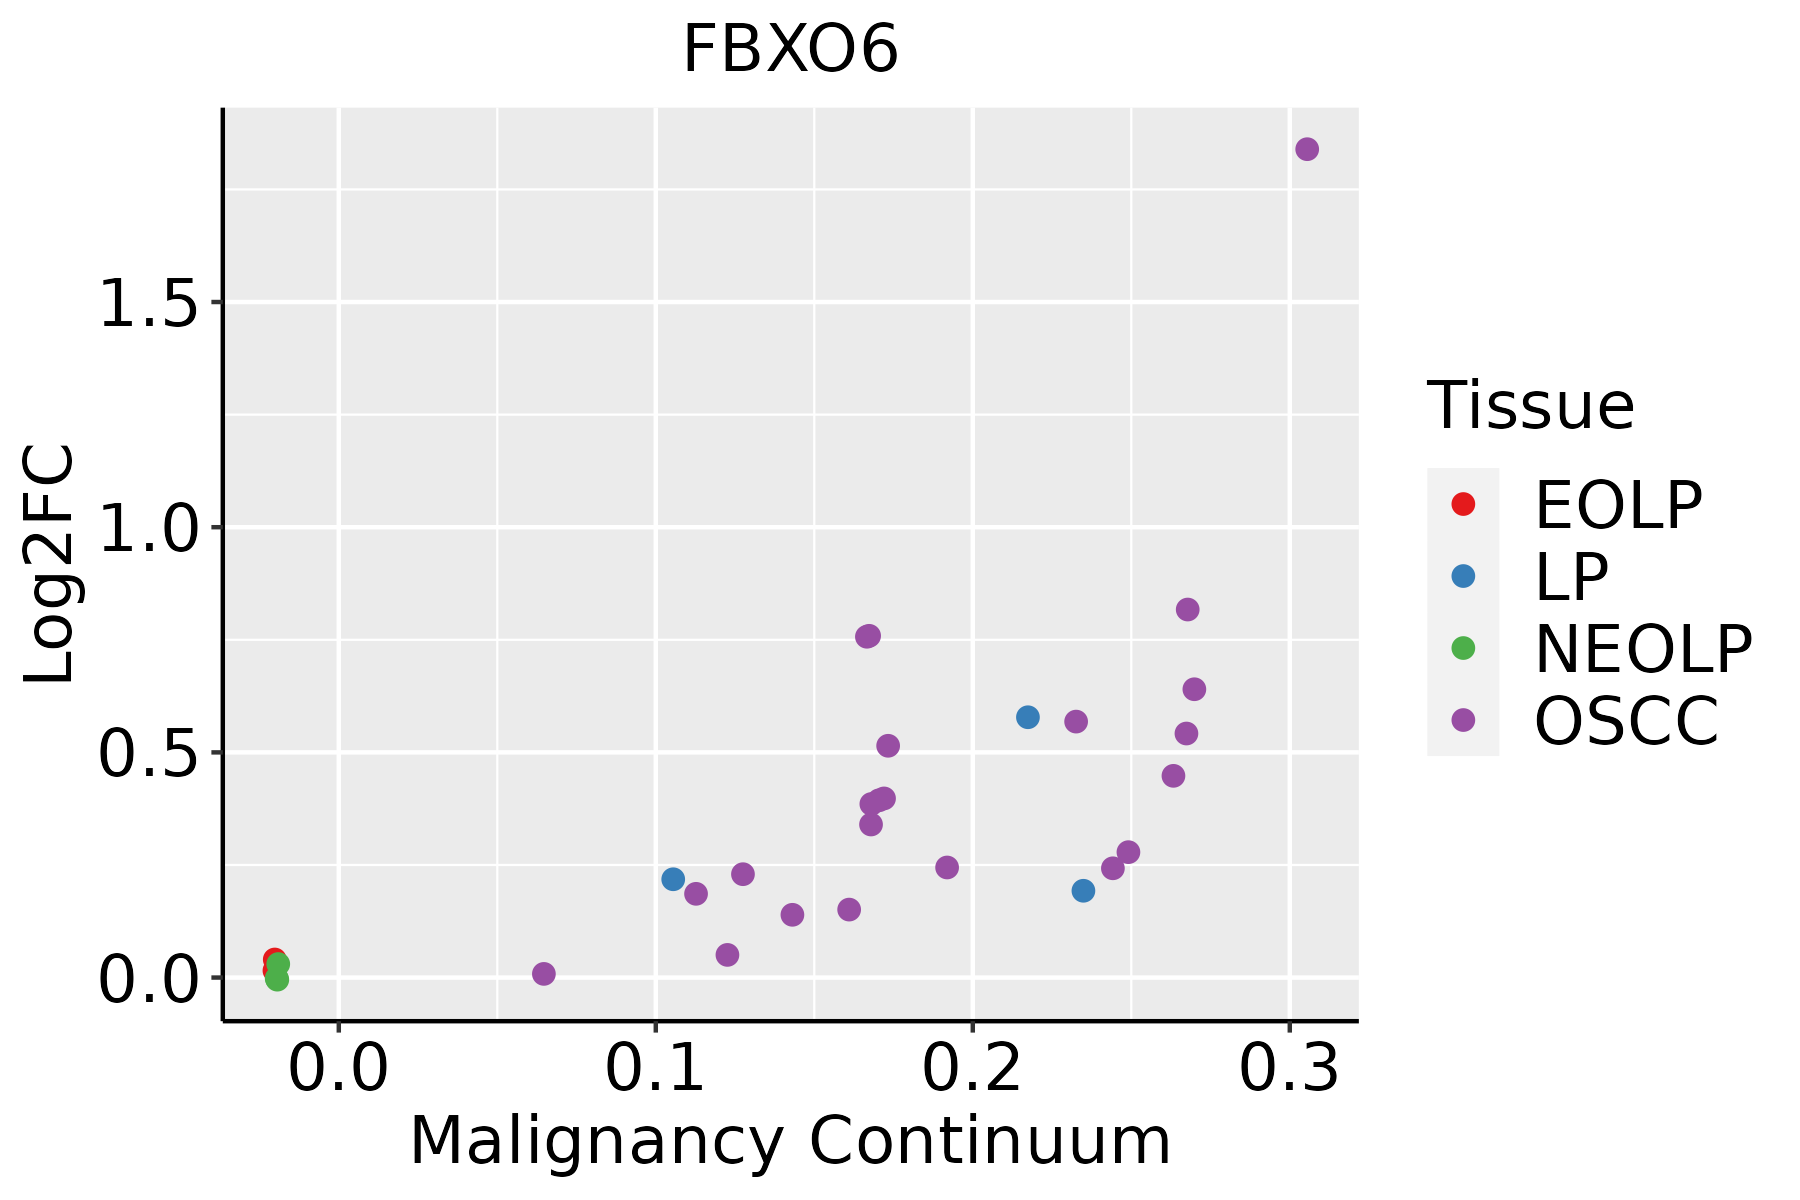 | EOLP: Erosive Oral lichen planus |
| LP: leukoplakia | ||
| NEOLP: Non-erosive oral lichen planus | ||
| OSCC: Oral squamous cell carcinoma |
| ∗log2FC in expression of this searched gene in stem-like cells from each diseased tissue sample relative to stem-like cells in normal samples in each tissue plotted against the malignancy continuum. Samples are colored based on if they are from different disease stage. |
Top |
Malignant transformation related pathway analysis |
| Find out the enriched GO biological processes and KEGG pathways involved in transition from healthy to precancer to cancer |
| Tissue | Disease Stage | Enriched GO biological Processes |
| Colorectum | AD |  |
| Colorectum | SER |  |
| Colorectum | MSS |  |
| Colorectum | MSI-H |  |
| Colorectum | FAP |  |
| ∗Top 15 enriched GO BP terms are showed in the bar plot of each disease state in each tissue. Each row represents a significant GO biological process which is colored according to the -log10(p.adjust). |
| Page: 1 2 3 4 5 6 7 8 9 |
| GO ID | Tissue | Disease Stage | Description | Gene Ratio | Bg Ratio | pvalue | p.adjust | Count |
| GO:0010498111 | Esophagus | ESCC | proteasomal protein catabolic process | 369/8552 | 490/18723 | 1.13e-41 | 1.80e-38 | 369 |
| GO:0043161111 | Esophagus | ESCC | proteasome-mediated ubiquitin-dependent protein catabolic process | 312/8552 | 412/18723 | 3.53e-36 | 4.48e-33 | 312 |
| GO:0034976111 | Esophagus | ESCC | response to endoplasmic reticulum stress | 192/8552 | 256/18723 | 7.15e-22 | 1.30e-19 | 192 |
| GO:0035966111 | Esophagus | ESCC | response to topologically incorrect protein | 125/8552 | 159/18723 | 1.44e-17 | 1.27e-15 | 125 |
| GO:0006986111 | Esophagus | ESCC | response to unfolded protein | 107/8552 | 137/18723 | 7.01e-15 | 3.87e-13 | 107 |
| GO:190198713 | Esophagus | ESCC | regulation of cell cycle phase transition | 242/8552 | 390/18723 | 3.86e-11 | 1.26e-09 | 242 |
| GO:003650315 | Esophagus | ESCC | ERAD pathway | 82/8552 | 107/18723 | 5.80e-11 | 1.84e-09 | 82 |
| GO:00457865 | Esophagus | ESCC | negative regulation of cell cycle | 236/8552 | 385/18723 | 3.62e-10 | 9.93e-09 | 236 |
| GO:00000754 | Esophagus | ESCC | cell cycle checkpoint | 117/8552 | 169/18723 | 4.47e-10 | 1.17e-08 | 117 |
| GO:003043314 | Esophagus | ESCC | ubiquitin-dependent ERAD pathway | 66/8552 | 85/18723 | 1.64e-09 | 3.78e-08 | 66 |
| GO:004277014 | Esophagus | ESCC | signal transduction in response to DNA damage | 117/8552 | 172/18723 | 2.38e-09 | 5.32e-08 | 117 |
| GO:00091002 | Esophagus | ESCC | glycoprotein metabolic process | 226/8552 | 387/18723 | 2.64e-07 | 3.94e-06 | 226 |
| GO:00109484 | Esophagus | ESCC | negative regulation of cell cycle process | 177/8552 | 294/18723 | 3.26e-07 | 4.59e-06 | 177 |
| GO:00315705 | Esophagus | ESCC | DNA integrity checkpoint | 83/8552 | 123/18723 | 8.17e-07 | 1.06e-05 | 83 |
| GO:00000775 | Esophagus | ESCC | DNA damage checkpoint | 78/8552 | 115/18723 | 1.27e-06 | 1.56e-05 | 78 |
| GO:19019883 | Esophagus | ESCC | negative regulation of cell cycle phase transition | 151/8552 | 249/18723 | 1.28e-06 | 1.57e-05 | 151 |
| GO:19011362 | Esophagus | ESCC | carbohydrate derivative catabolic process | 99/8552 | 172/18723 | 1.11e-03 | 5.54e-03 | 99 |
| GO:00311461 | Esophagus | ESCC | SCF-dependent proteasomal ubiquitin-dependent protein catabolic process | 33/8552 | 49/18723 | 1.80e-03 | 8.26e-03 | 33 |
| GO:0006516 | Esophagus | ESCC | glycoprotein catabolic process | 19/8552 | 28/18723 | 1.49e-02 | 4.84e-02 | 19 |
| GO:001049822 | Liver | HCC | proteasomal protein catabolic process | 351/7958 | 490/18723 | 6.92e-40 | 1.46e-36 | 351 |
| Page: 1 2 3 |
| Pathway ID | Tissue | Disease Stage | Description | Gene Ratio | Bg Ratio | pvalue | p.adjust | qvalue | Count |
| hsa04141211 | Esophagus | ESCC | Protein processing in endoplasmic reticulum | 147/4205 | 174/8465 | 3.29e-22 | 1.10e-19 | 5.64e-20 | 147 |
| hsa04141310 | Esophagus | ESCC | Protein processing in endoplasmic reticulum | 147/4205 | 174/8465 | 3.29e-22 | 1.10e-19 | 5.64e-20 | 147 |
| hsa0414122 | Liver | HCC | Protein processing in endoplasmic reticulum | 146/4020 | 174/8465 | 7.34e-24 | 2.46e-21 | 1.37e-21 | 146 |
| hsa0414132 | Liver | HCC | Protein processing in endoplasmic reticulum | 146/4020 | 174/8465 | 7.34e-24 | 2.46e-21 | 1.37e-21 | 146 |
| hsa0414130 | Oral cavity | OSCC | Protein processing in endoplasmic reticulum | 143/3704 | 174/8465 | 6.82e-26 | 2.28e-23 | 1.16e-23 | 143 |
| hsa04141113 | Oral cavity | OSCC | Protein processing in endoplasmic reticulum | 143/3704 | 174/8465 | 6.82e-26 | 2.28e-23 | 1.16e-23 | 143 |
| Page: 1 |
Top |
Cell-cell communication analysis |
| Identification of potential cell-cell interactions between two cell types and their ligand-receptor pairs for different disease states |
| Ligand | Receptor | LRpair | Pathway | Tissue | Disease Stage |
| Page: 1 |
Top |
Single-cell gene regulatory network inference analysis |
| Find out the significant the regulons (TFs) and the target genes of each regulon across cell types for different disease states |
| TF | Cell Type | Tissue | Disease Stage | Target Gene | RSS | Regulon Activity |
| ∗The dot plots of a searched regulon are shown for all cell subpopulations in each disease state of each tissue based on the regulon specific score inferred using pySCENIC and by calculating the average expression. |
| Page: 1 |
Top |
Somatic mutation of malignant transformation related genes |
| Annotation of somatic variants for genes involved in malignant transformation |
| Hugo Symbol | Variant Class | Variant Classification | dbSNP RS | HGVSc | HGVSp | HGVSp Short | SWISSPROT | BIOTYPE | SIFT | PolyPhen | Tumor Sample Barcode | Tissue | Histology | Sex | Age | Stage | Therapy Types | Drugs | Outcome |
| FBXO6 | SNV | Missense_Mutation | novel | c.797C>T | p.Ala266Val | p.A266V | Q9NRD1 | protein_coding | deleterious_low_confidence(0.05) | benign(0.003) | TCGA-AN-A0FN-01 | Breast | breast invasive carcinoma | Female | <65 | I/II | Unknown | Unknown | SD |
| FBXO6 | SNV | Missense_Mutation | rs746354058 | c.88N>A | p.Ala30Thr | p.A30T | Q9NRD1 | protein_coding | deleterious(0.01) | probably_damaging(0.994) | TCGA-AA-3663-01 | Colorectum | colon adenocarcinoma | Male | <65 | I/II | Unknown | Unknown | SD |
| FBXO6 | SNV | Missense_Mutation | rs566510540 | c.412G>A | p.Glu138Lys | p.E138K | Q9NRD1 | protein_coding | tolerated(0.29) | benign(0.086) | TCGA-AZ-6601-01 | Colorectum | colon adenocarcinoma | Male | >=65 | I/II | Unknown | Unknown | PD |
| FBXO6 | SNV | Missense_Mutation | c.512T>C | p.Phe171Ser | p.F171S | Q9NRD1 | protein_coding | deleterious(0) | possibly_damaging(0.787) | TCGA-CM-5861-01 | Colorectum | colon adenocarcinoma | Female | <65 | I/II | Unknown | Unknown | PD | |
| FBXO6 | SNV | Missense_Mutation | c.167G>A | p.Arg56His | p.R56H | Q9NRD1 | protein_coding | tolerated(0.11) | benign(0.189) | TCGA-AG-3892-01 | Colorectum | rectum adenocarcinoma | Female | <65 | I/II | Unknown | Unknown | SD | |
| FBXO6 | SNV | Missense_Mutation | novel | c.265N>A | p.Leu89Met | p.L89M | Q9NRD1 | protein_coding | deleterious(0.01) | probably_damaging(0.996) | TCGA-A5-A0G1-01 | Endometrium | uterine corpus endometrioid carcinoma | Female | >=65 | I/II | Unknown | Unknown | SD |
| FBXO6 | SNV | Missense_Mutation | novel | c.683N>A | p.Arg228His | p.R228H | Q9NRD1 | protein_coding | deleterious(0) | probably_damaging(1) | TCGA-A5-A0G2-01 | Endometrium | uterine corpus endometrioid carcinoma | Female | <65 | III/IV | Unknown | Unknown | SD |
| FBXO6 | SNV | Missense_Mutation | rs200760899 | c.682C>T | p.Arg228Cys | p.R228C | Q9NRD1 | protein_coding | deleterious(0) | probably_damaging(1) | TCGA-A5-A1OF-01 | Endometrium | uterine corpus endometrioid carcinoma | Female | <65 | I/II | Unknown | Unknown | SD |
| FBXO6 | SNV | Missense_Mutation | novel | c.133N>T | p.Arg45Trp | p.R45W | Q9NRD1 | protein_coding | deleterious(0) | probably_damaging(1) | TCGA-A5-A7WJ-01 | Endometrium | uterine corpus endometrioid carcinoma | Female | <65 | I/II | Unknown | Unknown | SD |
| FBXO6 | SNV | Missense_Mutation | c.715N>G | p.Thr239Ala | p.T239A | Q9NRD1 | protein_coding | deleterious(0.03) | probably_damaging(0.958) | TCGA-AX-A063-01 | Endometrium | uterine corpus endometrioid carcinoma | Female | <65 | I/II | Unknown | Unknown | SD |
| Page: 1 2 3 |
Top |
Related drugs of malignant transformation related genes |
| Identification of chemicals and drugs interact with genes involved in malignant transfromation |
| (DGIdb 4.0) |
| Entrez ID | Symbol | Category | Interaction Types | Drug Claim Name | Drug Name | PMIDs |
| Page: 1 |

Copyright 2023-Present -The University of Texas Health Science Center at Houston |