
|
|||||
|
 | |
| |
| |
| |
| |
| |
|
Gene: FBXO45 |
Gene summary for FBXO45 |
| Gene information | Species | Human | Gene symbol | FBXO45 | Gene ID | 200933 |
| Gene name | F-box protein 45 | |
| Gene Alias | Fbx45 | |
| Cytomap | 3q29 | |
| Gene Type | protein-coding | GO ID | GO:0000902 | UniProtAcc | P0C2W1 |
Top |
Malignant transformation analysis |
| Identification of the aberrant gene expression in precancerous and cancerous lesions by comparing the gene expression of stem-like cells in diseased tissues with normal stem cells |
| Entrez ID | Symbol | Replicates | Species | Organ | Tissue | Adj P-value | Log2FC | Malignancy |
| 200933 | FBXO45 | LZE4T | Human | Esophagus | ESCC | 2.79e-04 | 2.26e-01 | 0.0811 |
| 200933 | FBXO45 | LZE8T | Human | Esophagus | ESCC | 2.84e-02 | 8.10e-02 | 0.067 |
| 200933 | FBXO45 | LZE24T | Human | Esophagus | ESCC | 7.38e-05 | 6.47e-02 | 0.0596 |
| 200933 | FBXO45 | P1T-E | Human | Esophagus | ESCC | 8.61e-03 | 1.02e-01 | 0.0875 |
| 200933 | FBXO45 | P2T-E | Human | Esophagus | ESCC | 6.75e-19 | 2.40e-01 | 0.1177 |
| 200933 | FBXO45 | P4T-E | Human | Esophagus | ESCC | 2.19e-13 | 3.29e-01 | 0.1323 |
| 200933 | FBXO45 | P5T-E | Human | Esophagus | ESCC | 2.36e-08 | 3.61e-01 | 0.1327 |
| 200933 | FBXO45 | P8T-E | Human | Esophagus | ESCC | 9.45e-17 | 9.83e-02 | 0.0889 |
| 200933 | FBXO45 | P9T-E | Human | Esophagus | ESCC | 4.36e-07 | 1.06e-01 | 0.1131 |
| 200933 | FBXO45 | P10T-E | Human | Esophagus | ESCC | 5.60e-11 | 1.67e-01 | 0.116 |
| 200933 | FBXO45 | P11T-E | Human | Esophagus | ESCC | 4.68e-02 | 9.88e-02 | 0.1426 |
| 200933 | FBXO45 | P12T-E | Human | Esophagus | ESCC | 2.84e-03 | 3.13e-02 | 0.1122 |
| 200933 | FBXO45 | P15T-E | Human | Esophagus | ESCC | 1.11e-06 | 1.67e-01 | 0.1149 |
| 200933 | FBXO45 | P16T-E | Human | Esophagus | ESCC | 1.08e-10 | 9.39e-02 | 0.1153 |
| 200933 | FBXO45 | P20T-E | Human | Esophagus | ESCC | 9.58e-03 | 3.14e-02 | 0.1124 |
| 200933 | FBXO45 | P21T-E | Human | Esophagus | ESCC | 4.74e-04 | 1.00e-01 | 0.1617 |
| 200933 | FBXO45 | P22T-E | Human | Esophagus | ESCC | 1.99e-05 | 1.22e-01 | 0.1236 |
| 200933 | FBXO45 | P23T-E | Human | Esophagus | ESCC | 6.39e-08 | 1.44e-01 | 0.108 |
| 200933 | FBXO45 | P24T-E | Human | Esophagus | ESCC | 9.60e-08 | 5.94e-02 | 0.1287 |
| 200933 | FBXO45 | P26T-E | Human | Esophagus | ESCC | 3.04e-18 | 2.25e-01 | 0.1276 |
| Page: 1 2 3 4 |
| Tissue | Expression Dynamics | Abbreviation |
| Esophagus | 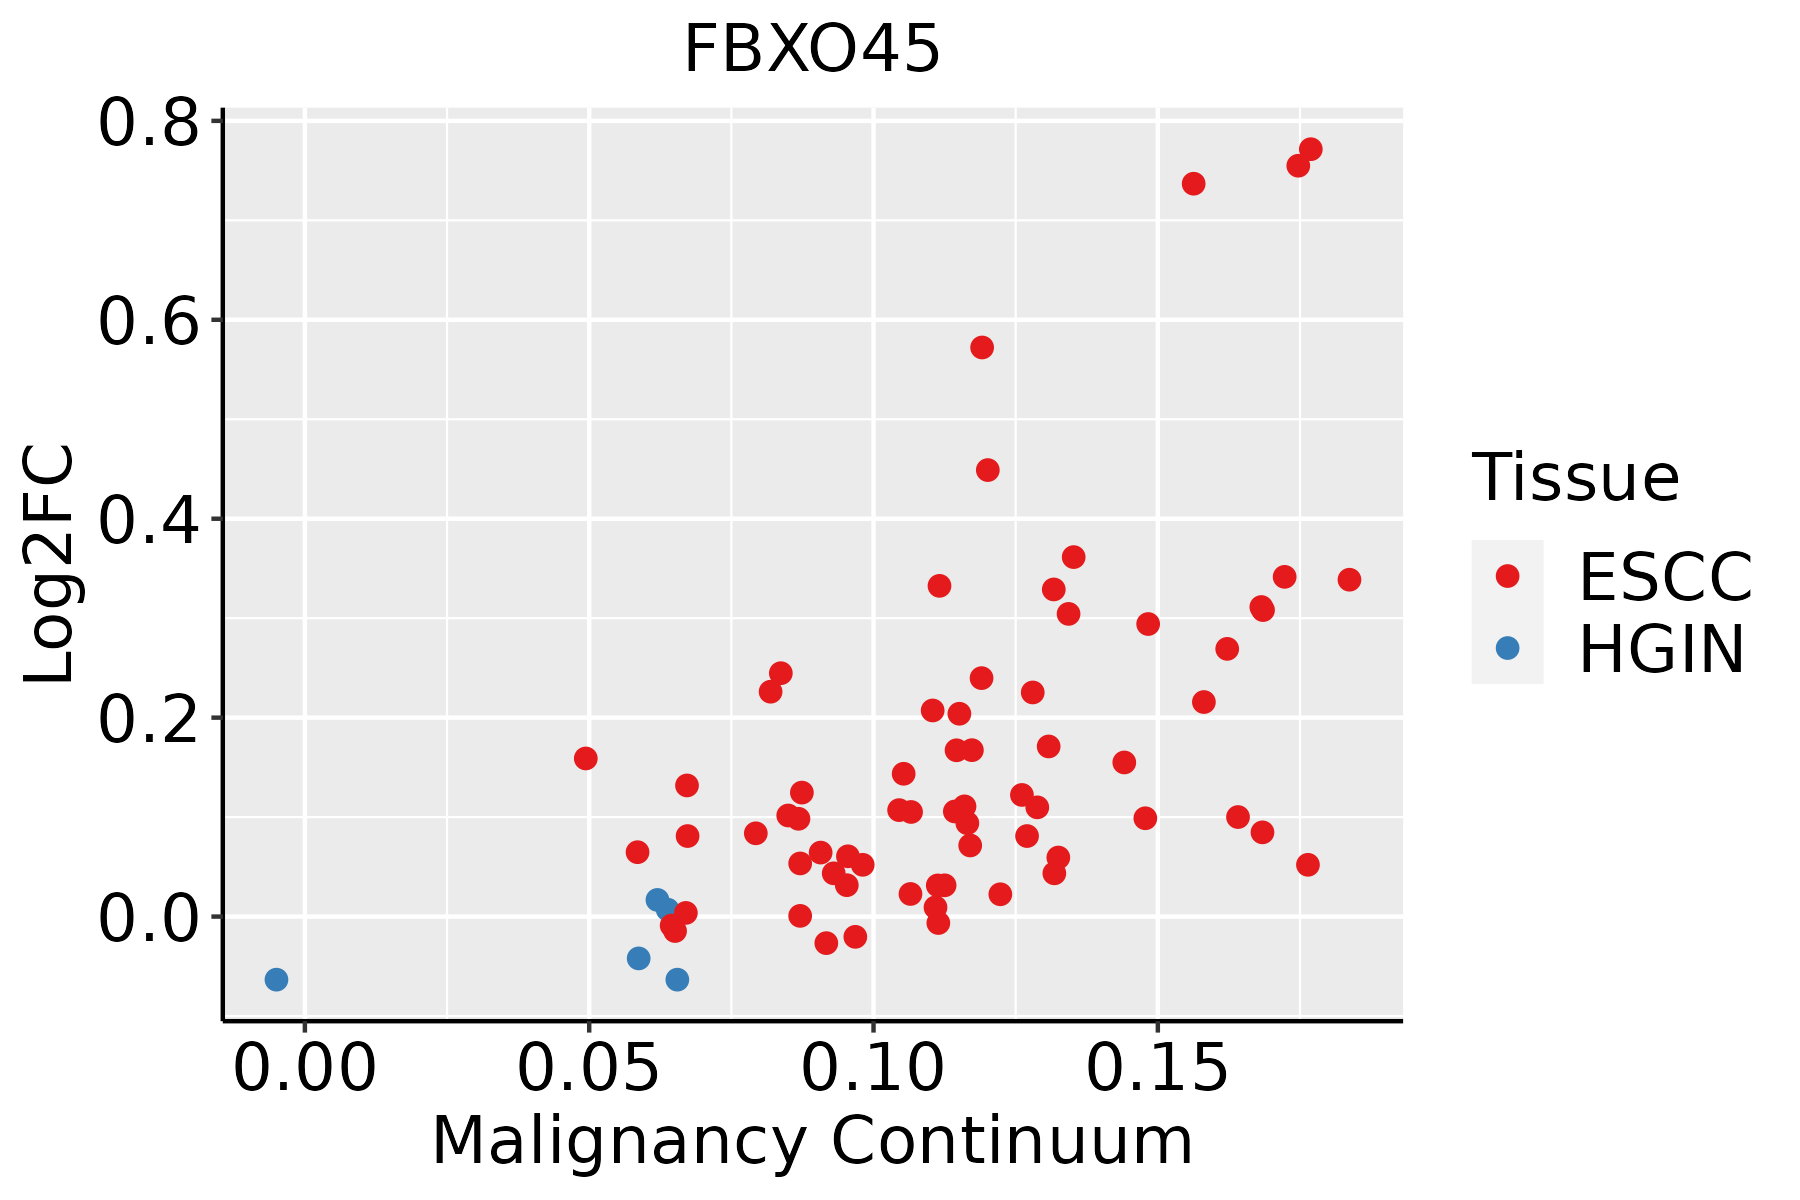 | ESCC: Esophageal squamous cell carcinoma |
| HGIN: High-grade intraepithelial neoplasias | ||
| LGIN: Low-grade intraepithelial neoplasias | ||
| Liver | 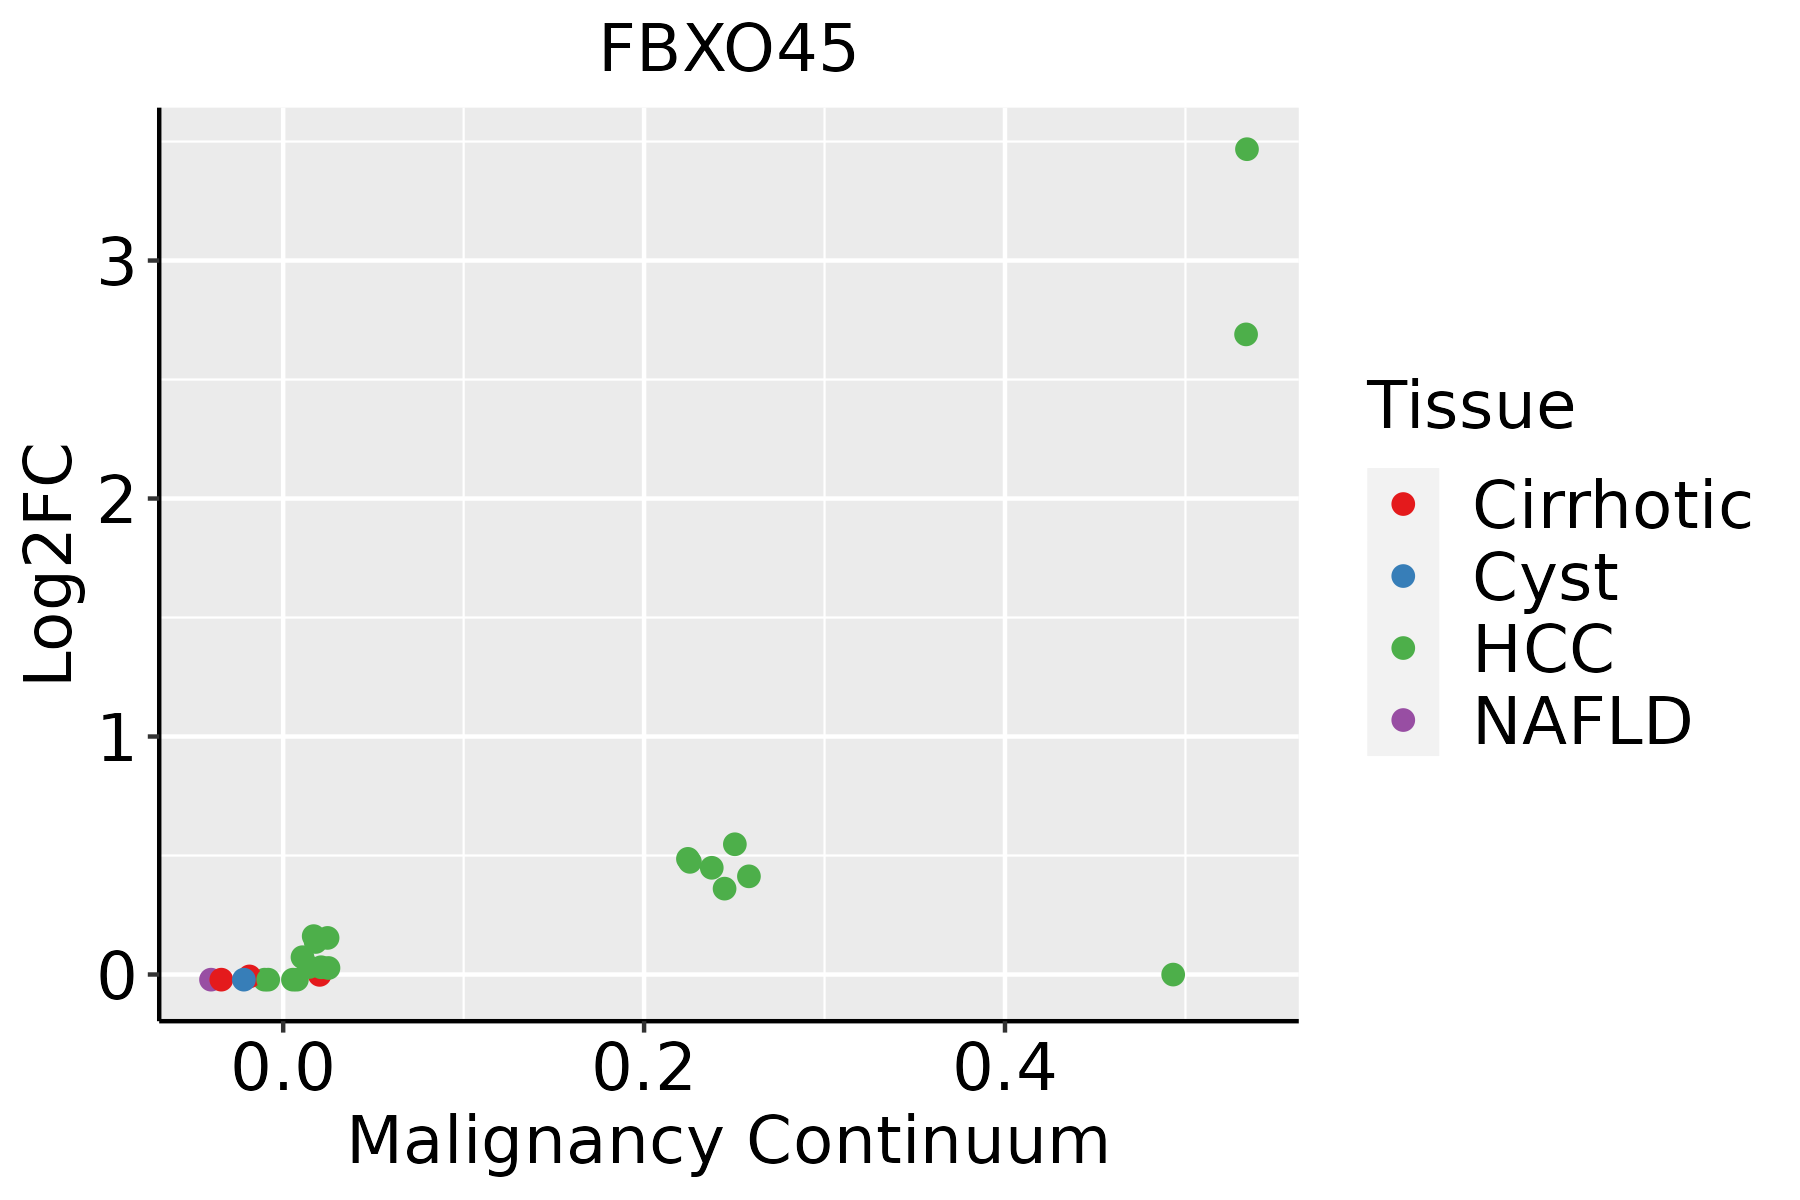 | HCC: Hepatocellular carcinoma |
| NAFLD: Non-alcoholic fatty liver disease | ||
| Oral Cavity | 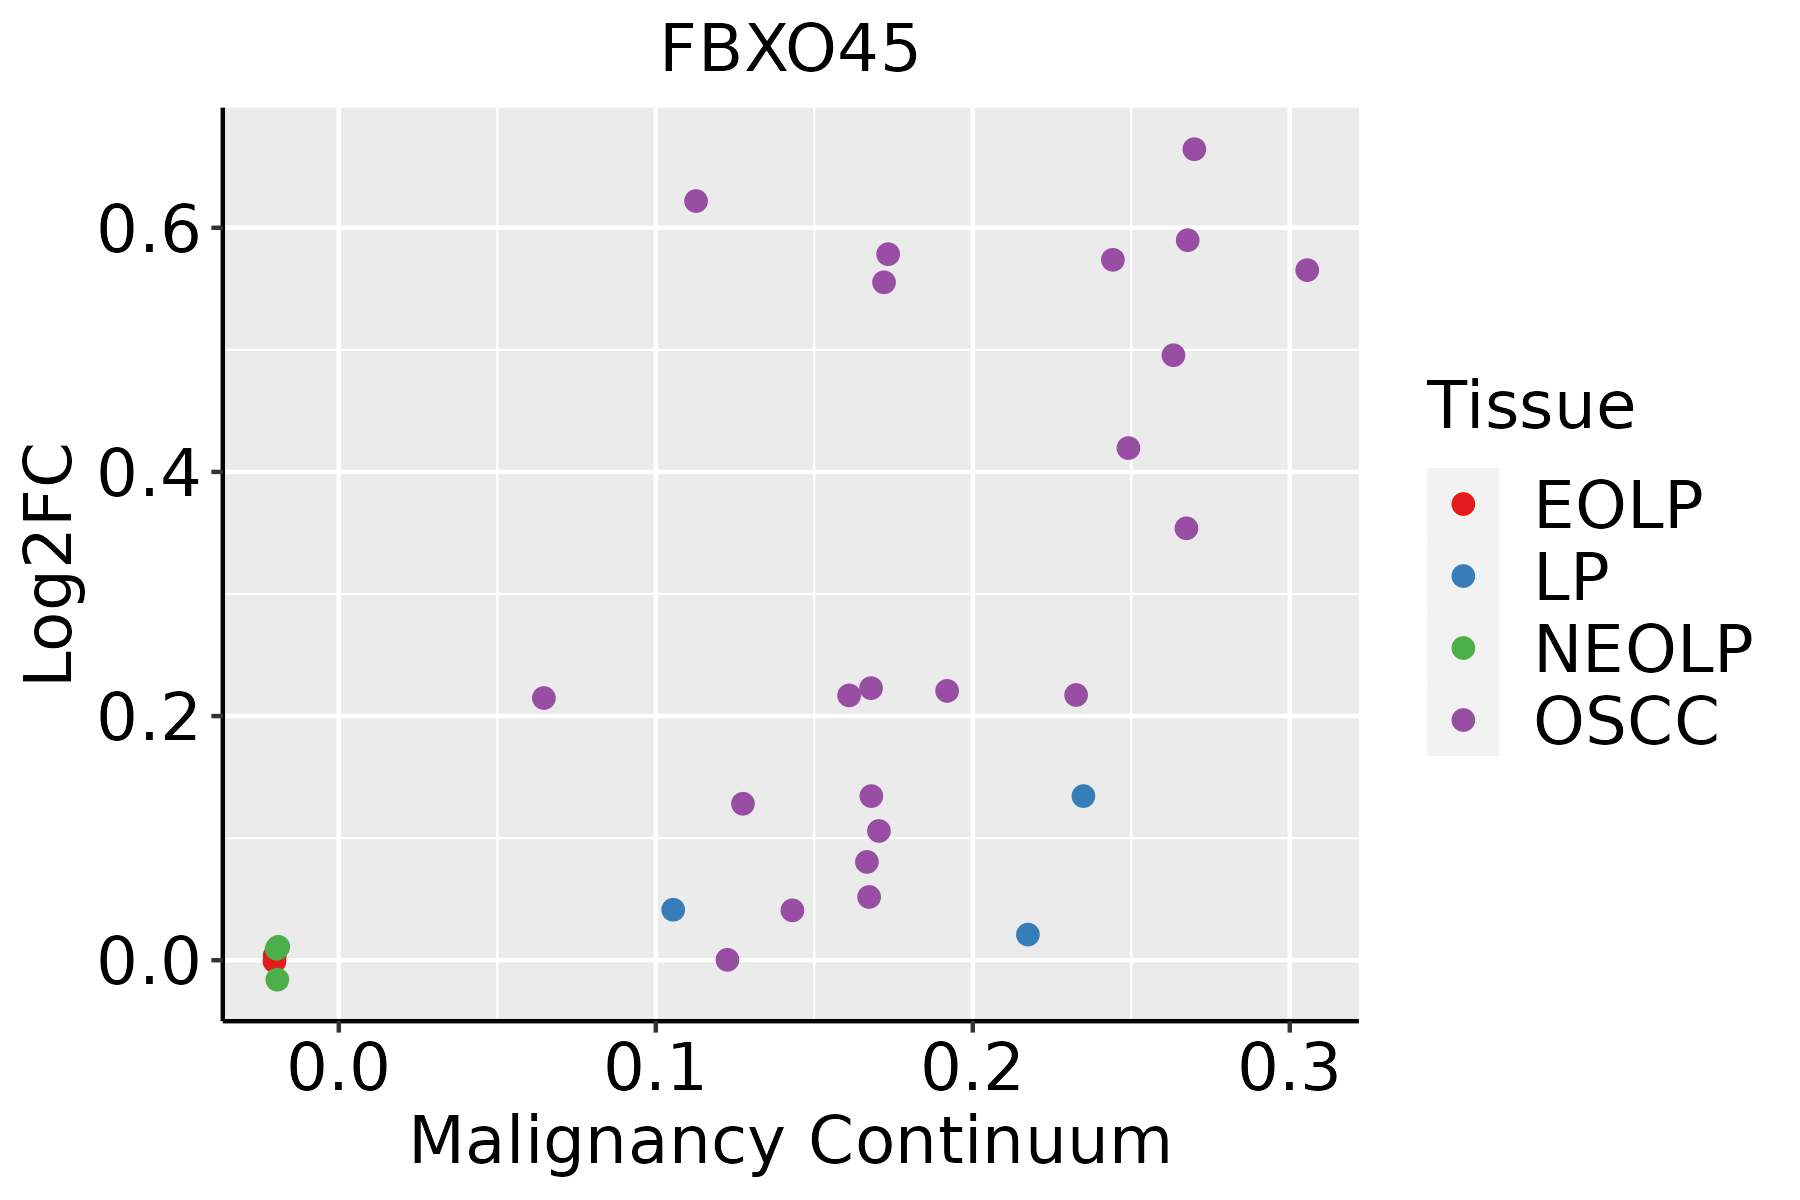 | EOLP: Erosive Oral lichen planus |
| LP: leukoplakia | ||
| NEOLP: Non-erosive oral lichen planus | ||
| OSCC: Oral squamous cell carcinoma |
| ∗log2FC in expression of this searched gene in stem-like cells from each diseased tissue sample relative to stem-like cells in normal samples in each tissue plotted against the malignancy continuum. Samples are colored based on if they are from different disease stage. |
Top |
Malignant transformation related pathway analysis |
| Find out the enriched GO biological processes and KEGG pathways involved in transition from healthy to precancer to cancer |
| Tissue | Disease Stage | Enriched GO biological Processes |
| Colorectum | AD |  |
| Colorectum | SER |  |
| Colorectum | MSS |  |
| Colorectum | MSI-H |  |
| Colorectum | FAP |  |
| ∗Top 15 enriched GO BP terms are showed in the bar plot of each disease state in each tissue. Each row represents a significant GO biological process which is colored according to the -log10(p.adjust). |
| Page: 1 2 3 4 5 6 7 8 9 |
| GO ID | Tissue | Disease Stage | Description | Gene Ratio | Bg Ratio | pvalue | p.adjust | Count |
| GO:0010498111 | Esophagus | ESCC | proteasomal protein catabolic process | 369/8552 | 490/18723 | 1.13e-41 | 1.80e-38 | 369 |
| GO:0043161111 | Esophagus | ESCC | proteasome-mediated ubiquitin-dependent protein catabolic process | 312/8552 | 412/18723 | 3.53e-36 | 4.48e-33 | 312 |
| GO:006156415 | Esophagus | ESCC | axon development | 251/8552 | 467/18723 | 2.41e-04 | 1.49e-03 | 251 |
| GO:003432918 | Esophagus | ESCC | cell junction assembly | 227/8552 | 420/18723 | 3.06e-04 | 1.83e-03 | 227 |
| GO:000740915 | Esophagus | ESCC | axonogenesis | 219/8552 | 418/18723 | 3.14e-03 | 1.31e-02 | 219 |
| GO:00215436 | Esophagus | ESCC | pallium development | 94/8552 | 169/18723 | 5.79e-03 | 2.14e-02 | 94 |
| GO:001049822 | Liver | HCC | proteasomal protein catabolic process | 351/7958 | 490/18723 | 6.92e-40 | 1.46e-36 | 351 |
| GO:004316122 | Liver | HCC | proteasome-mediated ubiquitin-dependent protein catabolic process | 299/7958 | 412/18723 | 7.82e-36 | 8.27e-33 | 299 |
| GO:001049820 | Oral cavity | OSCC | proteasomal protein catabolic process | 336/7305 | 490/18723 | 5.45e-41 | 8.63e-38 | 336 |
| GO:004316120 | Oral cavity | OSCC | proteasome-mediated ubiquitin-dependent protein catabolic process | 285/7305 | 412/18723 | 5.68e-36 | 5.99e-33 | 285 |
| GO:003432916 | Oral cavity | OSCC | cell junction assembly | 190/7305 | 420/18723 | 4.99e-03 | 1.96e-02 | 190 |
| GO:006156410 | Oral cavity | OSCC | axon development | 207/7305 | 467/18723 | 1.01e-02 | 3.51e-02 | 207 |
| GO:00219876 | Oral cavity | OSCC | cerebral cortex development | 57/7305 | 114/18723 | 1.09e-02 | 3.71e-02 | 57 |
| GO:00215435 | Oral cavity | OSCC | pallium development | 81/7305 | 169/18723 | 1.11e-02 | 3.76e-02 | 81 |
| Page: 1 |
| Pathway ID | Tissue | Disease Stage | Description | Gene Ratio | Bg Ratio | pvalue | p.adjust | qvalue | Count |
| Page: 1 |
Top |
Cell-cell communication analysis |
| Identification of potential cell-cell interactions between two cell types and their ligand-receptor pairs for different disease states |
| Ligand | Receptor | LRpair | Pathway | Tissue | Disease Stage |
| Page: 1 |
Top |
Single-cell gene regulatory network inference analysis |
| Find out the significant the regulons (TFs) and the target genes of each regulon across cell types for different disease states |
| TF | Cell Type | Tissue | Disease Stage | Target Gene | RSS | Regulon Activity |
| ∗The dot plots of a searched regulon are shown for all cell subpopulations in each disease state of each tissue based on the regulon specific score inferred using pySCENIC and by calculating the average expression. |
| Page: 1 |
Top |
Somatic mutation of malignant transformation related genes |
| Annotation of somatic variants for genes involved in malignant transformation |
| Hugo Symbol | Variant Class | Variant Classification | dbSNP RS | HGVSc | HGVSp | HGVSp Short | SWISSPROT | BIOTYPE | SIFT | PolyPhen | Tumor Sample Barcode | Tissue | Histology | Sex | Age | Stage | Therapy Types | Drugs | Outcome |
| FBXO45 | SNV | Missense_Mutation | novel | c.708G>T | p.Met236Ile | p.M236I | P0C2W1 | protein_coding | tolerated(0.07) | possibly_damaging(0.534) | TCGA-BH-AB28-01 | Breast | breast invasive carcinoma | Female | <65 | III/IV | Chemotherapy | taxotere | SD |
| FBXO45 | SNV | Missense_Mutation | novel | c.638N>A | p.Gly213Asp | p.G213D | P0C2W1 | protein_coding | tolerated(0.06) | possibly_damaging(0.729) | TCGA-D8-A1XQ-01 | Breast | breast invasive carcinoma | Female | >=65 | I/II | Unknown | Unknown | SD |
| FBXO45 | SNV | Missense_Mutation | rs751454123 | c.686G>T | p.Arg229Ile | p.R229I | P0C2W1 | protein_coding | deleterious(0) | probably_damaging(0.98) | TCGA-AA-A010-01 | Colorectum | colon adenocarcinoma | Female | <65 | I/II | Chemotherapy | folinic | CR |
| FBXO45 | SNV | Missense_Mutation | novel | c.692N>A | p.Arg231Gln | p.R231Q | P0C2W1 | protein_coding | tolerated(0.15) | possibly_damaging(0.806) | TCGA-CA-6717-01 | Colorectum | colon adenocarcinoma | Male | <65 | I/II | Chemotherapy | oxaliplatin | CR |
| FBXO45 | SNV | Missense_Mutation | c.717N>T | p.Lys239Asn | p.K239N | P0C2W1 | protein_coding | tolerated(0.34) | benign(0.012) | TCGA-AG-A002-01 | Colorectum | rectum adenocarcinoma | Male | <65 | I/II | Unknown | Unknown | SD | |
| FBXO45 | SNV | Missense_Mutation | novel | c.692N>A | p.Arg231Gln | p.R231Q | P0C2W1 | protein_coding | tolerated(0.15) | possibly_damaging(0.806) | TCGA-A5-A2K5-01 | Endometrium | uterine corpus endometrioid carcinoma | Female | >=65 | I/II | Unknown | Unknown | SD |
| FBXO45 | SNV | Missense_Mutation | novel | c.503T>C | p.Val168Ala | p.V168A | P0C2W1 | protein_coding | tolerated(0.76) | probably_damaging(0.91) | TCGA-AJ-A3EK-01 | Endometrium | uterine corpus endometrioid carcinoma | Female | <65 | I/II | Chemotherapy | carboplatin | CR |
| FBXO45 | SNV | Missense_Mutation | novel | c.192N>T | p.Lys64Asn | p.K64N | P0C2W1 | protein_coding | deleterious(0.01) | possibly_damaging(0.776) | TCGA-AJ-A5DW-01 | Endometrium | uterine corpus endometrioid carcinoma | Female | <65 | I/II | Unknown | Unknown | SD |
| FBXO45 | SNV | Missense_Mutation | c.401G>A | p.Arg134Gln | p.R134Q | P0C2W1 | protein_coding | deleterious(0) | probably_damaging(0.993) | TCGA-AP-A1E0-01 | Endometrium | uterine corpus endometrioid carcinoma | Female | <65 | III/IV | Chemotherapy | paclitaxel | SD | |
| FBXO45 | SNV | Missense_Mutation | novel | c.643T>G | p.Phe215Val | p.F215V | P0C2W1 | protein_coding | deleterious(0.03) | possibly_damaging(0.524) | TCGA-AP-A1E0-01 | Endometrium | uterine corpus endometrioid carcinoma | Female | <65 | III/IV | Chemotherapy | paclitaxel | SD |
| Page: 1 2 3 |
Top |
Related drugs of malignant transformation related genes |
| Identification of chemicals and drugs interact with genes involved in malignant transfromation |
| (DGIdb 4.0) |
| Entrez ID | Symbol | Category | Interaction Types | Drug Claim Name | Drug Name | PMIDs |
| Page: 1 |

Copyright 2023-Present -The University of Texas Health Science Center at Houston |