
|
|||||
|
 | |
| |
| |
| |
| |
| |
|
Gene: FBXO4 |
Gene summary for FBXO4 |
| Gene information | Species | Human | Gene symbol | FBXO4 | Gene ID | 26272 |
| Gene name | F-box protein 4 | |
| Gene Alias | FBX4 | |
| Cytomap | 5p13.1 | |
| Gene Type | protein-coding | GO ID | GO:0000075 | UniProtAcc | D6RAJ6 |
Top |
Malignant transformation analysis |
| Identification of the aberrant gene expression in precancerous and cancerous lesions by comparing the gene expression of stem-like cells in diseased tissues with normal stem cells |
| Entrez ID | Symbol | Replicates | Species | Organ | Tissue | Adj P-value | Log2FC | Malignancy |
| 26272 | FBXO4 | LZE8T | Human | Esophagus | ESCC | 1.32e-03 | 2.08e-01 | 0.067 |
| 26272 | FBXO4 | LZE24T | Human | Esophagus | ESCC | 1.31e-07 | 2.20e-01 | 0.0596 |
| 26272 | FBXO4 | LZE6T | Human | Esophagus | ESCC | 4.33e-10 | 3.85e-01 | 0.0845 |
| 26272 | FBXO4 | P1T-E | Human | Esophagus | ESCC | 1.63e-03 | 2.34e-01 | 0.0875 |
| 26272 | FBXO4 | P2T-E | Human | Esophagus | ESCC | 1.38e-13 | 2.25e-01 | 0.1177 |
| 26272 | FBXO4 | P4T-E | Human | Esophagus | ESCC | 1.03e-11 | 2.84e-01 | 0.1323 |
| 26272 | FBXO4 | P5T-E | Human | Esophagus | ESCC | 1.59e-08 | 1.96e-01 | 0.1327 |
| 26272 | FBXO4 | P8T-E | Human | Esophagus | ESCC | 2.87e-14 | 3.07e-01 | 0.0889 |
| 26272 | FBXO4 | P9T-E | Human | Esophagus | ESCC | 4.47e-08 | 2.28e-01 | 0.1131 |
| 26272 | FBXO4 | P10T-E | Human | Esophagus | ESCC | 1.06e-16 | 3.64e-01 | 0.116 |
| 26272 | FBXO4 | P11T-E | Human | Esophagus | ESCC | 4.33e-11 | 3.77e-01 | 0.1426 |
| 26272 | FBXO4 | P12T-E | Human | Esophagus | ESCC | 4.93e-12 | 3.58e-01 | 0.1122 |
| 26272 | FBXO4 | P16T-E | Human | Esophagus | ESCC | 5.75e-07 | 1.84e-01 | 0.1153 |
| 26272 | FBXO4 | P20T-E | Human | Esophagus | ESCC | 2.61e-05 | 2.13e-01 | 0.1124 |
| 26272 | FBXO4 | P21T-E | Human | Esophagus | ESCC | 1.62e-14 | 2.80e-01 | 0.1617 |
| 26272 | FBXO4 | P22T-E | Human | Esophagus | ESCC | 4.24e-05 | 1.36e-01 | 0.1236 |
| 26272 | FBXO4 | P23T-E | Human | Esophagus | ESCC | 9.50e-15 | 3.69e-01 | 0.108 |
| 26272 | FBXO4 | P24T-E | Human | Esophagus | ESCC | 2.88e-05 | 1.50e-01 | 0.1287 |
| 26272 | FBXO4 | P26T-E | Human | Esophagus | ESCC | 4.34e-06 | 1.54e-01 | 0.1276 |
| 26272 | FBXO4 | P27T-E | Human | Esophagus | ESCC | 3.72e-18 | 3.24e-01 | 0.1055 |
| Page: 1 2 3 |
| Tissue | Expression Dynamics | Abbreviation |
| Esophagus | 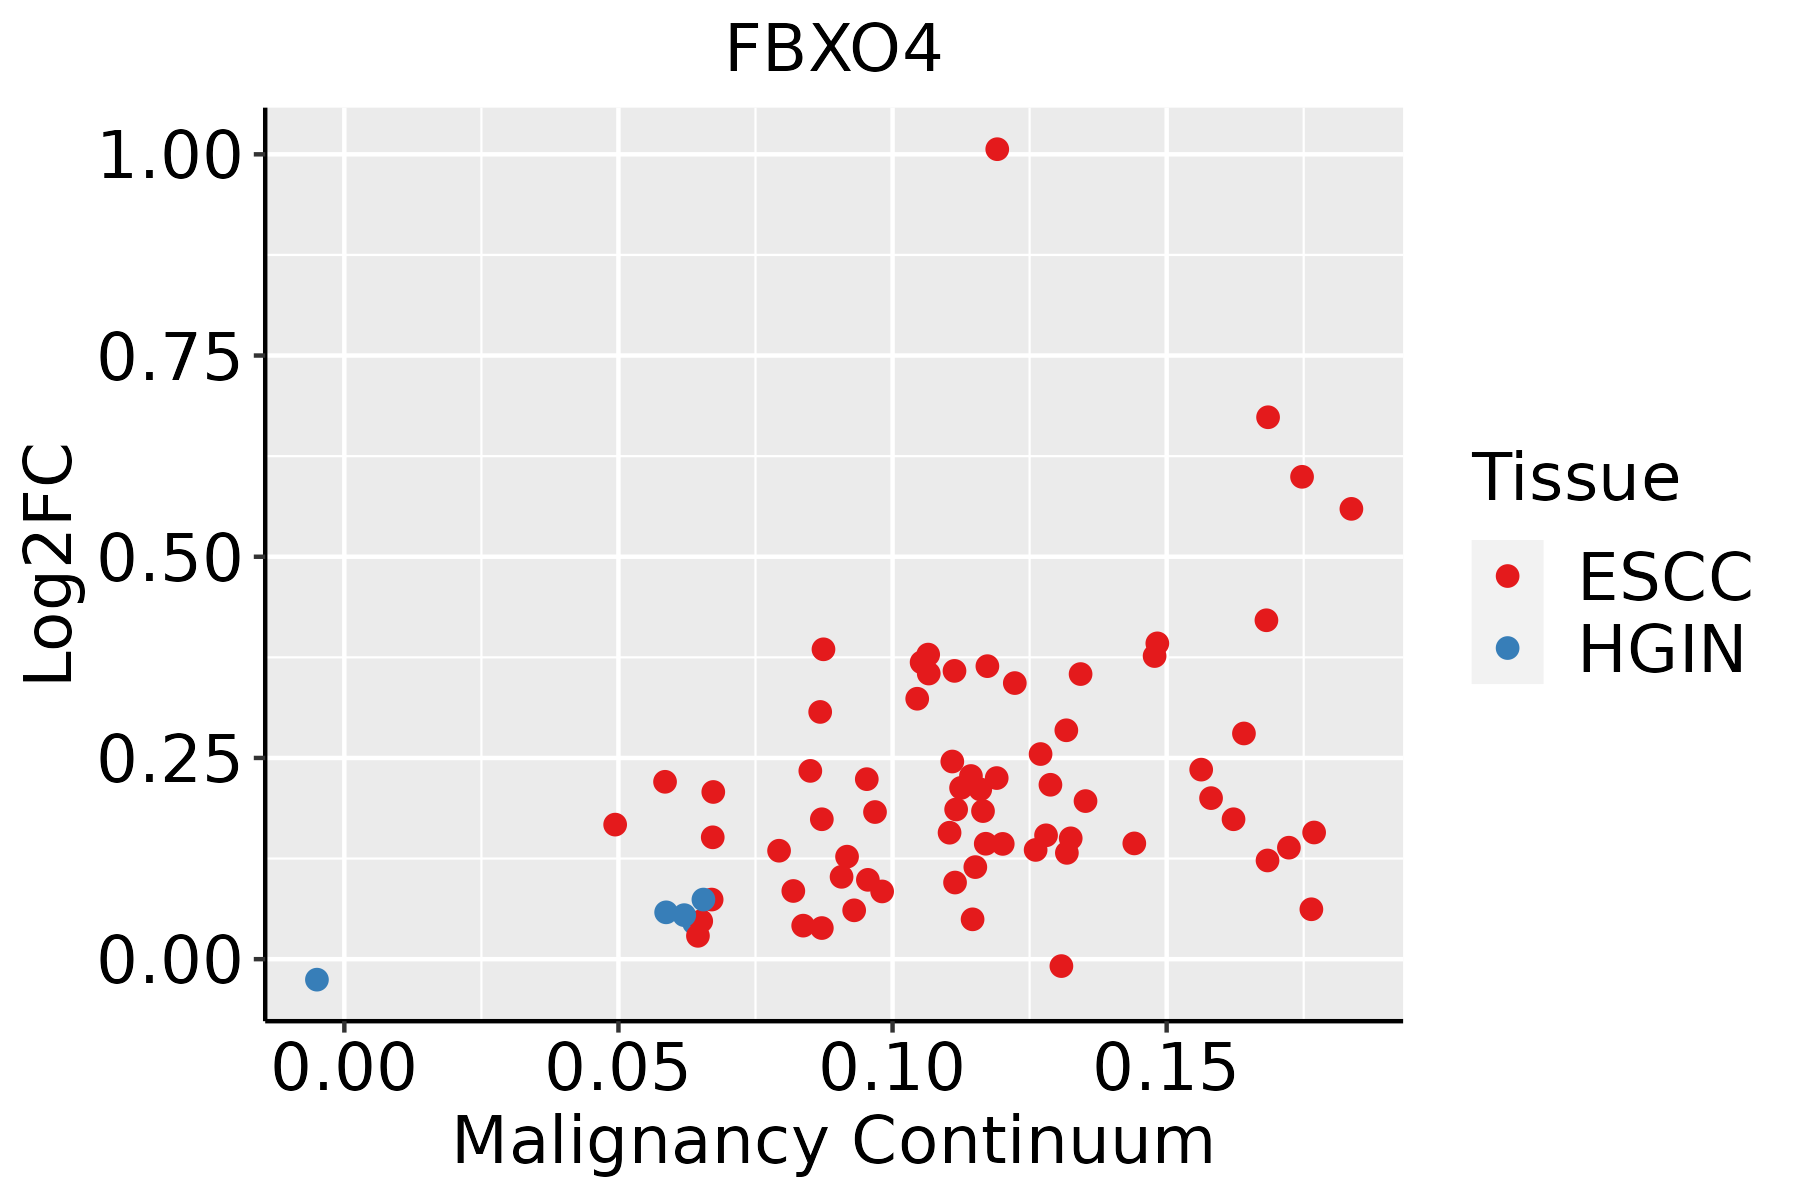 | ESCC: Esophageal squamous cell carcinoma |
| HGIN: High-grade intraepithelial neoplasias | ||
| LGIN: Low-grade intraepithelial neoplasias |
| ∗log2FC in expression of this searched gene in stem-like cells from each diseased tissue sample relative to stem-like cells in normal samples in each tissue plotted against the malignancy continuum. Samples are colored based on if they are from different disease stage. |
Top |
Malignant transformation related pathway analysis |
| Find out the enriched GO biological processes and KEGG pathways involved in transition from healthy to precancer to cancer |
| Tissue | Disease Stage | Enriched GO biological Processes |
| Colorectum | AD |  |
| Colorectum | SER |  |
| Colorectum | MSS |  |
| Colorectum | MSI-H |  |
| Colorectum | FAP |  |
| ∗Top 15 enriched GO BP terms are showed in the bar plot of each disease state in each tissue. Each row represents a significant GO biological process which is colored according to the -log10(p.adjust). |
| Page: 1 2 3 4 5 6 7 8 9 |
| GO ID | Tissue | Disease Stage | Description | Gene Ratio | Bg Ratio | pvalue | p.adjust | Count |
| GO:0010498111 | Esophagus | ESCC | proteasomal protein catabolic process | 369/8552 | 490/18723 | 1.13e-41 | 1.80e-38 | 369 |
| GO:0043161111 | Esophagus | ESCC | proteasome-mediated ubiquitin-dependent protein catabolic process | 312/8552 | 412/18723 | 3.53e-36 | 4.48e-33 | 312 |
| GO:0031647111 | Esophagus | ESCC | regulation of protein stability | 223/8552 | 298/18723 | 5.76e-25 | 1.52e-22 | 223 |
| GO:0034976111 | Esophagus | ESCC | response to endoplasmic reticulum stress | 192/8552 | 256/18723 | 7.15e-22 | 1.30e-19 | 192 |
| GO:003450418 | Esophagus | ESCC | protein localization to nucleus | 211/8552 | 290/18723 | 4.06e-21 | 6.60e-19 | 211 |
| GO:1903320111 | Esophagus | ESCC | regulation of protein modification by small protein conjugation or removal | 181/8552 | 242/18723 | 1.80e-20 | 2.60e-18 | 181 |
| GO:003304416 | Esophagus | ESCC | regulation of chromosome organization | 145/8552 | 187/18723 | 3.80e-19 | 4.31e-17 | 145 |
| GO:000020917 | Esophagus | ESCC | protein polyubiquitination | 170/8552 | 236/18723 | 1.40e-16 | 1.09e-14 | 170 |
| GO:0031396111 | Esophagus | ESCC | regulation of protein ubiquitination | 154/8552 | 210/18723 | 2.70e-16 | 2.04e-14 | 154 |
| GO:005105215 | Esophagus | ESCC | regulation of DNA metabolic process | 232/8552 | 359/18723 | 2.40e-13 | 1.13e-11 | 232 |
| GO:001021217 | Esophagus | ESCC | response to ionizing radiation | 110/8552 | 148/18723 | 1.11e-12 | 4.78e-11 | 110 |
| GO:000072319 | Esophagus | ESCC | telomere maintenance | 99/8552 | 131/18723 | 2.68e-12 | 1.08e-10 | 99 |
| GO:190018018 | Esophagus | ESCC | regulation of protein localization to nucleus | 102/8552 | 136/18723 | 2.84e-12 | 1.13e-10 | 102 |
| GO:007189716 | Esophagus | ESCC | DNA biosynthetic process | 127/8552 | 180/18723 | 1.04e-11 | 3.85e-10 | 127 |
| GO:005105417 | Esophagus | ESCC | positive regulation of DNA metabolic process | 139/8552 | 201/18723 | 1.20e-11 | 4.33e-10 | 139 |
| GO:190198713 | Esophagus | ESCC | regulation of cell cycle phase transition | 242/8552 | 390/18723 | 3.86e-11 | 1.26e-09 | 242 |
| GO:000931419 | Esophagus | ESCC | response to radiation | 277/8552 | 456/18723 | 4.42e-11 | 1.43e-09 | 277 |
| GO:200057319 | Esophagus | ESCC | positive regulation of DNA biosynthetic process | 56/8552 | 66/18723 | 4.51e-11 | 1.45e-09 | 56 |
| GO:003650315 | Esophagus | ESCC | ERAD pathway | 82/8552 | 107/18723 | 5.80e-11 | 1.84e-09 | 82 |
| GO:003220417 | Esophagus | ESCC | regulation of telomere maintenance | 65/8552 | 80/18723 | 6.02e-11 | 1.90e-09 | 65 |
| Page: 1 2 3 4 |
| Pathway ID | Tissue | Disease Stage | Description | Gene Ratio | Bg Ratio | pvalue | p.adjust | qvalue | Count |
| hsa0412027 | Esophagus | ESCC | Ubiquitin mediated proteolysis | 122/4205 | 142/8465 | 6.53e-20 | 7.29e-18 | 3.74e-18 | 122 |
| hsa0412036 | Esophagus | ESCC | Ubiquitin mediated proteolysis | 122/4205 | 142/8465 | 6.53e-20 | 7.29e-18 | 3.74e-18 | 122 |
| Page: 1 |
Top |
Cell-cell communication analysis |
| Identification of potential cell-cell interactions between two cell types and their ligand-receptor pairs for different disease states |
| Ligand | Receptor | LRpair | Pathway | Tissue | Disease Stage |
| Page: 1 |
Top |
Single-cell gene regulatory network inference analysis |
| Find out the significant the regulons (TFs) and the target genes of each regulon across cell types for different disease states |
| TF | Cell Type | Tissue | Disease Stage | Target Gene | RSS | Regulon Activity |
| ∗The dot plots of a searched regulon are shown for all cell subpopulations in each disease state of each tissue based on the regulon specific score inferred using pySCENIC and by calculating the average expression. |
| Page: 1 |
Top |
Somatic mutation of malignant transformation related genes |
| Annotation of somatic variants for genes involved in malignant transformation |
| Hugo Symbol | Variant Class | Variant Classification | dbSNP RS | HGVSc | HGVSp | HGVSp Short | SWISSPROT | BIOTYPE | SIFT | PolyPhen | Tumor Sample Barcode | Tissue | Histology | Sex | Age | Stage | Therapy Types | Drugs | Outcome |
| FBXO4 | SNV | Missense_Mutation | novel | c.412N>A | p.Asp138Asn | p.D138N | Q9UKT5 | protein_coding | tolerated(0.06) | probably_damaging(0.996) | TCGA-A7-A26I-01 | Breast | breast invasive carcinoma | Female | >=65 | I/II | Chemotherapy | cytoxan | SD |
| FBXO4 | SNV | Missense_Mutation | c.1132N>A | p.Leu378Ile | p.L378I | Q9UKT5 | protein_coding | deleterious(0.01) | probably_damaging(0.987) | TCGA-AN-A046-01 | Breast | breast invasive carcinoma | Female | >=65 | I/II | Unknown | Unknown | SD | |
| FBXO4 | insertion | Frame_Shift_Ins | novel | c.410_411insAA | p.Phe137LeufsTer36 | p.F137Lfs*36 | Q9UKT5 | protein_coding | TCGA-A7-A26I-01 | Breast | breast invasive carcinoma | Female | >=65 | I/II | Chemotherapy | cytoxan | SD | ||
| FBXO4 | deletion | Frame_Shift_Del | novel | c.787delN | p.Asn263MetfsTer13 | p.N263Mfs*13 | Q9UKT5 | protein_coding | TCGA-D8-A27V-01 | Breast | breast invasive carcinoma | Female | <65 | I/II | Hormone Therapy | tamoxiphen | SD | ||
| FBXO4 | deletion | Frame_Shift_Del | novel | c.544delN | p.Phe182LeufsTer8 | p.F182Lfs*8 | Q9UKT5 | protein_coding | TCGA-EW-A2FV-01 | Breast | breast invasive carcinoma | Female | <65 | III/IV | Chemotherapy | docetaxel | SD | ||
| FBXO4 | SNV | Missense_Mutation | rs563591124 | c.533G>A | p.Arg178Gln | p.R178Q | Q9UKT5 | protein_coding | tolerated(0.05) | possibly_damaging(0.548) | TCGA-2W-A8YY-01 | Cervix | cervical & endocervical cancer | Female | <65 | I/II | Chemotherapy | cisplatin | CR |
| FBXO4 | SNV | Missense_Mutation | novel | c.1048C>A | p.Leu350Met | p.L350M | Q9UKT5 | protein_coding | tolerated(0.07) | probably_damaging(0.997) | TCGA-C5-A902-01 | Cervix | cervical & endocervical cancer | Female | <65 | I/II | Chemotherapy | cisplatin | SD |
| FBXO4 | SNV | Missense_Mutation | c.229C>T | p.His77Tyr | p.H77Y | Q9UKT5 | protein_coding | tolerated(0.05) | benign(0.003) | TCGA-EK-A2H1-01 | Cervix | cervical & endocervical cancer | Female | <65 | I/II | Chemotherapy | cetuximab | SD | |
| FBXO4 | SNV | Missense_Mutation | novel | c.361N>G | p.Leu121Val | p.L121V | Q9UKT5 | protein_coding | tolerated(0.83) | benign(0) | TCGA-VS-A958-01 | Cervix | cervical & endocervical cancer | Female | <65 | I/II | Chemotherapy | cisplatin | CR |
| FBXO4 | SNV | Missense_Mutation | rs376695334 | c.1153N>T | p.Arg385Cys | p.R385C | Q9UKT5 | protein_coding | deleterious_low_confidence(0.01) | benign(0) | TCGA-AA-3510-01 | Colorectum | colon adenocarcinoma | Male | >=65 | I/II | Unknown | Unknown | SD |
| Page: 1 2 3 4 5 |
Top |
Related drugs of malignant transformation related genes |
| Identification of chemicals and drugs interact with genes involved in malignant transfromation |
| (DGIdb 4.0) |
| Entrez ID | Symbol | Category | Interaction Types | Drug Claim Name | Drug Name | PMIDs |
| Page: 1 |

Copyright 2023-Present -The University of Texas Health Science Center at Houston |