
|
|||||
|
 | |
| |
| |
| |
| |
| |
|
Gene: FBXO34 |
Gene summary for FBXO34 |
| Gene information | Species | Human | Gene symbol | FBXO34 | Gene ID | 55030 |
| Gene name | F-box protein 34 | |
| Gene Alias | CGI-301 | |
| Cytomap | 14q22.3 | |
| Gene Type | protein-coding | GO ID | GO:0003674 | UniProtAcc | A0A024R653 |
Top |
Malignant transformation analysis |
| Identification of the aberrant gene expression in precancerous and cancerous lesions by comparing the gene expression of stem-like cells in diseased tissues with normal stem cells |
| Entrez ID | Symbol | Replicates | Species | Organ | Tissue | Adj P-value | Log2FC | Malignancy |
| 55030 | FBXO34 | CA_HPV_1 | Human | Cervix | CC | 2.40e-02 | -1.62e-01 | 0.0264 |
| 55030 | FBXO34 | CCI_1 | Human | Cervix | CC | 2.82e-05 | 1.16e+00 | 0.528 |
| 55030 | FBXO34 | CCI_2 | Human | Cervix | CC | 6.28e-13 | 1.22e+00 | 0.5249 |
| 55030 | FBXO34 | CCI_3 | Human | Cervix | CC | 1.55e-05 | 7.86e-01 | 0.516 |
| 55030 | FBXO34 | HTA11_3410_2000001011 | Human | Colorectum | AD | 2.65e-13 | -5.63e-01 | 0.0155 |
| 55030 | FBXO34 | HTA11_347_2000001011 | Human | Colorectum | AD | 3.07e-08 | 4.45e-01 | -0.1954 |
| 55030 | FBXO34 | HTA11_8622_2000001021 | Human | Colorectum | SER | 8.27e-05 | -6.18e-01 | 0.0528 |
| 55030 | FBXO34 | HTA11_7469_2000001011 | Human | Colorectum | AD | 3.94e-04 | -7.41e-01 | -0.0124 |
| 55030 | FBXO34 | HTA11_99999970781_79442 | Human | Colorectum | MSS | 3.17e-12 | -5.01e-01 | 0.294 |
| 55030 | FBXO34 | HTA11_99999965062_69753 | Human | Colorectum | MSI-H | 1.75e-03 | -4.73e-01 | 0.3487 |
| 55030 | FBXO34 | HTA11_99999971662_82457 | Human | Colorectum | MSS | 1.56e-12 | -5.83e-01 | 0.3859 |
| 55030 | FBXO34 | HTA11_99999974143_84620 | Human | Colorectum | MSS | 1.43e-26 | -8.06e-01 | 0.3005 |
| 55030 | FBXO34 | A002-C-010 | Human | Colorectum | FAP | 2.08e-02 | -1.88e-01 | 0.242 |
| 55030 | FBXO34 | A015-C-203 | Human | Colorectum | FAP | 1.27e-32 | -5.20e-01 | -0.1294 |
| 55030 | FBXO34 | A015-C-204 | Human | Colorectum | FAP | 2.29e-05 | -2.76e-01 | -0.0228 |
| 55030 | FBXO34 | A014-C-040 | Human | Colorectum | FAP | 1.86e-02 | -2.17e-01 | -0.1184 |
| 55030 | FBXO34 | A002-C-201 | Human | Colorectum | FAP | 1.17e-15 | -4.60e-01 | 0.0324 |
| 55030 | FBXO34 | A001-C-119 | Human | Colorectum | FAP | 9.44e-06 | -1.81e-01 | -0.1557 |
| 55030 | FBXO34 | A001-C-108 | Human | Colorectum | FAP | 1.12e-13 | -1.16e-01 | -0.0272 |
| 55030 | FBXO34 | A002-C-205 | Human | Colorectum | FAP | 1.16e-24 | -4.15e-01 | -0.1236 |
| Page: 1 2 3 4 5 6 7 8 |
| Tissue | Expression Dynamics | Abbreviation |
| Cervix |  | CC: Cervix cancer |
| HSIL_HPV: HPV-infected high-grade squamous intraepithelial lesions | ||
| N_HPV: HPV-infected normal cervix | ||
| Colorectum (GSE201348) |  | FAP: Familial adenomatous polyposis |
| CRC: Colorectal cancer | ||
| Colorectum (HTA11) |  | AD: Adenomas |
| SER: Sessile serrated lesions | ||
| MSI-H: Microsatellite-high colorectal cancer | ||
| MSS: Microsatellite stable colorectal cancer | ||
| Endometrium | 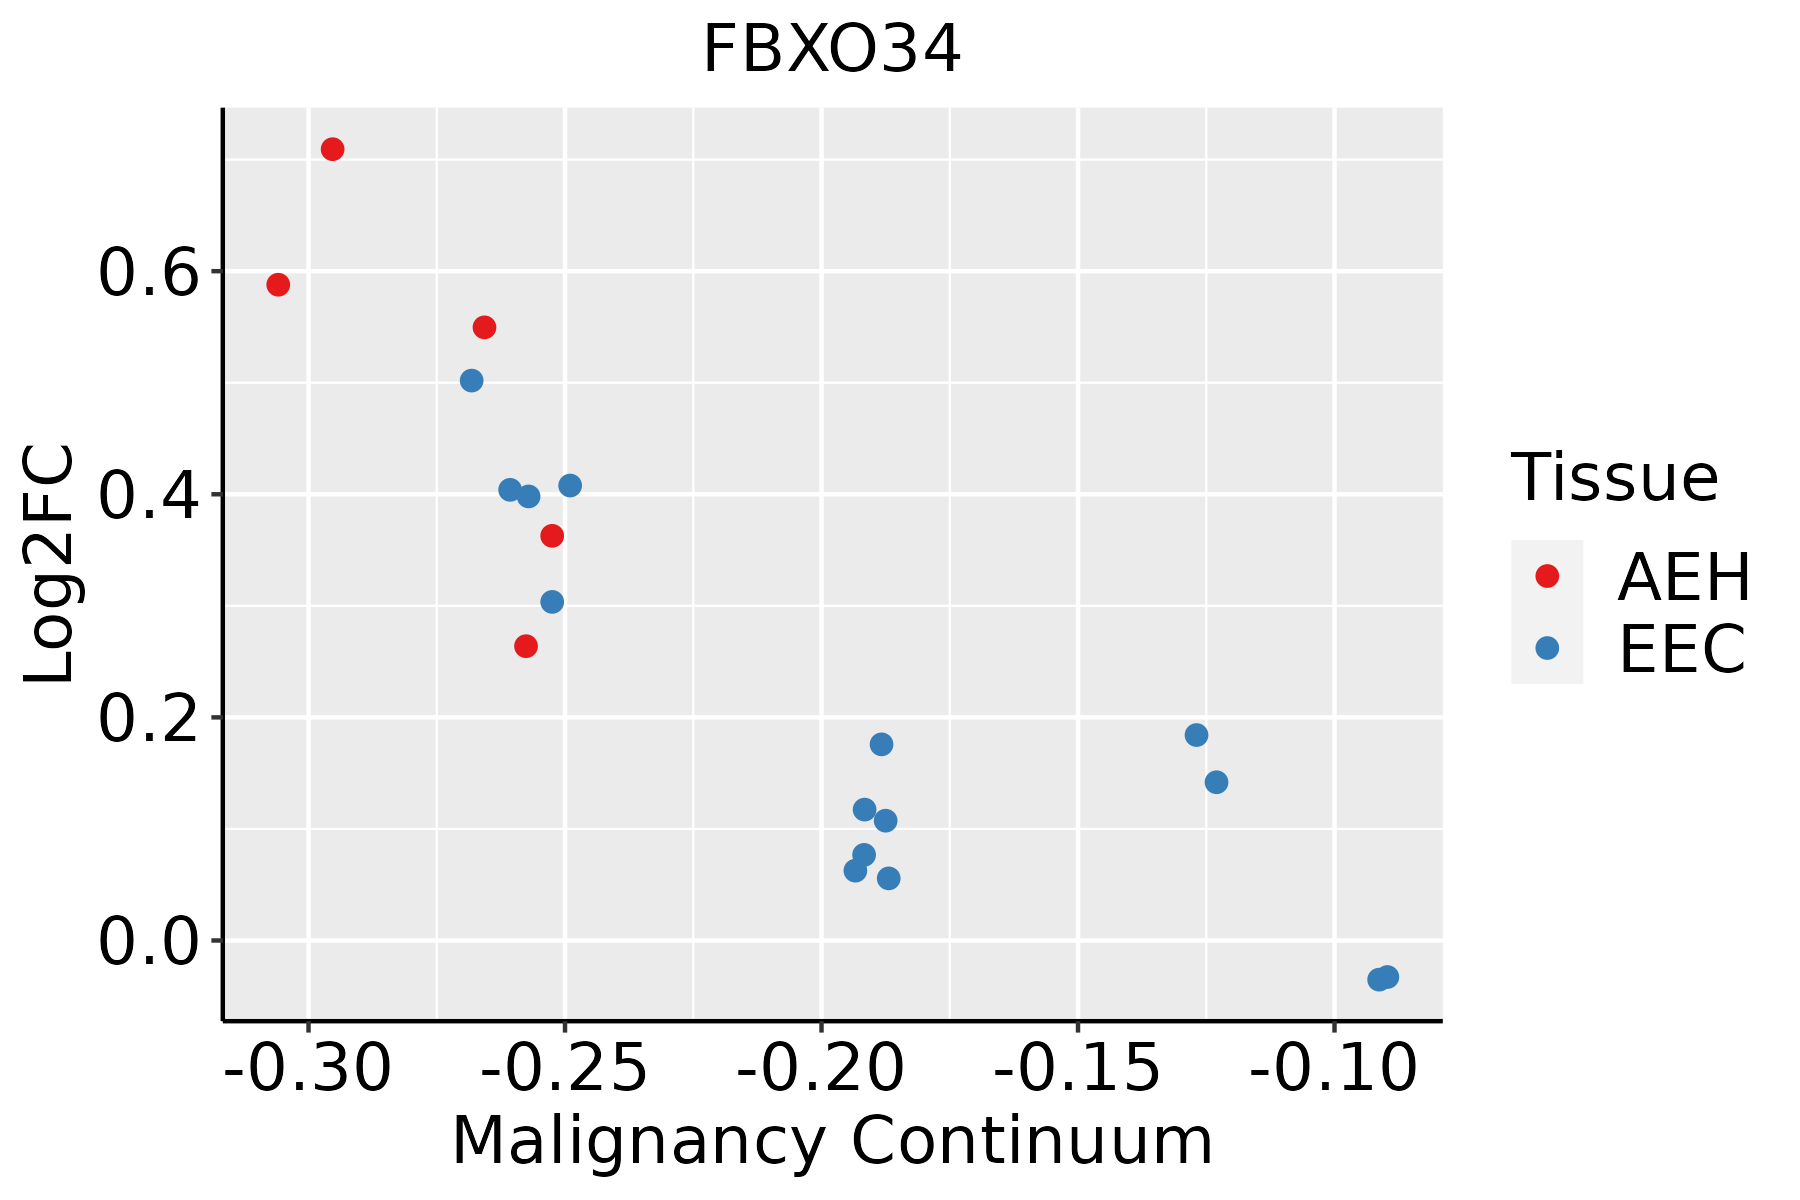 | AEH: Atypical endometrial hyperplasia |
| EEC: Endometrioid Cancer | ||
| Esophagus | 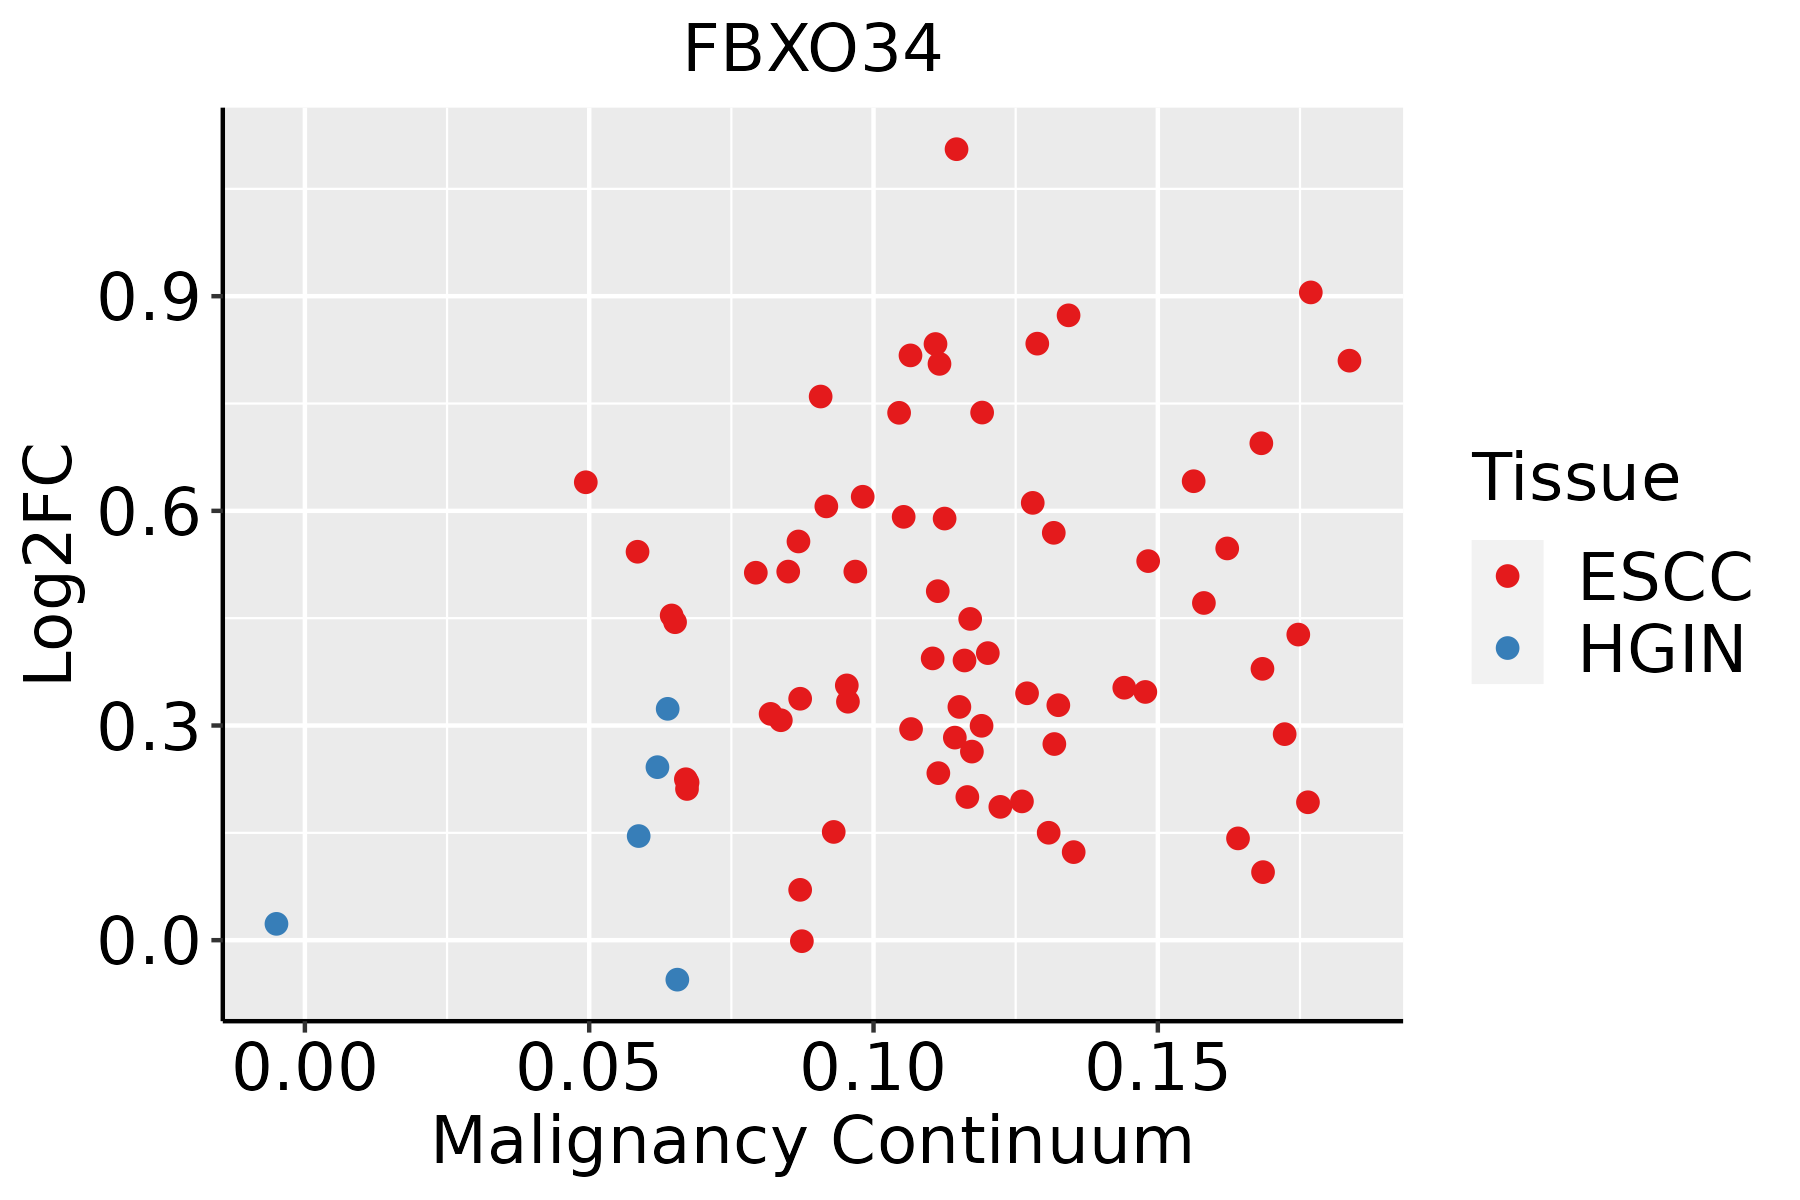 | ESCC: Esophageal squamous cell carcinoma |
| HGIN: High-grade intraepithelial neoplasias | ||
| LGIN: Low-grade intraepithelial neoplasias | ||
| Lung | 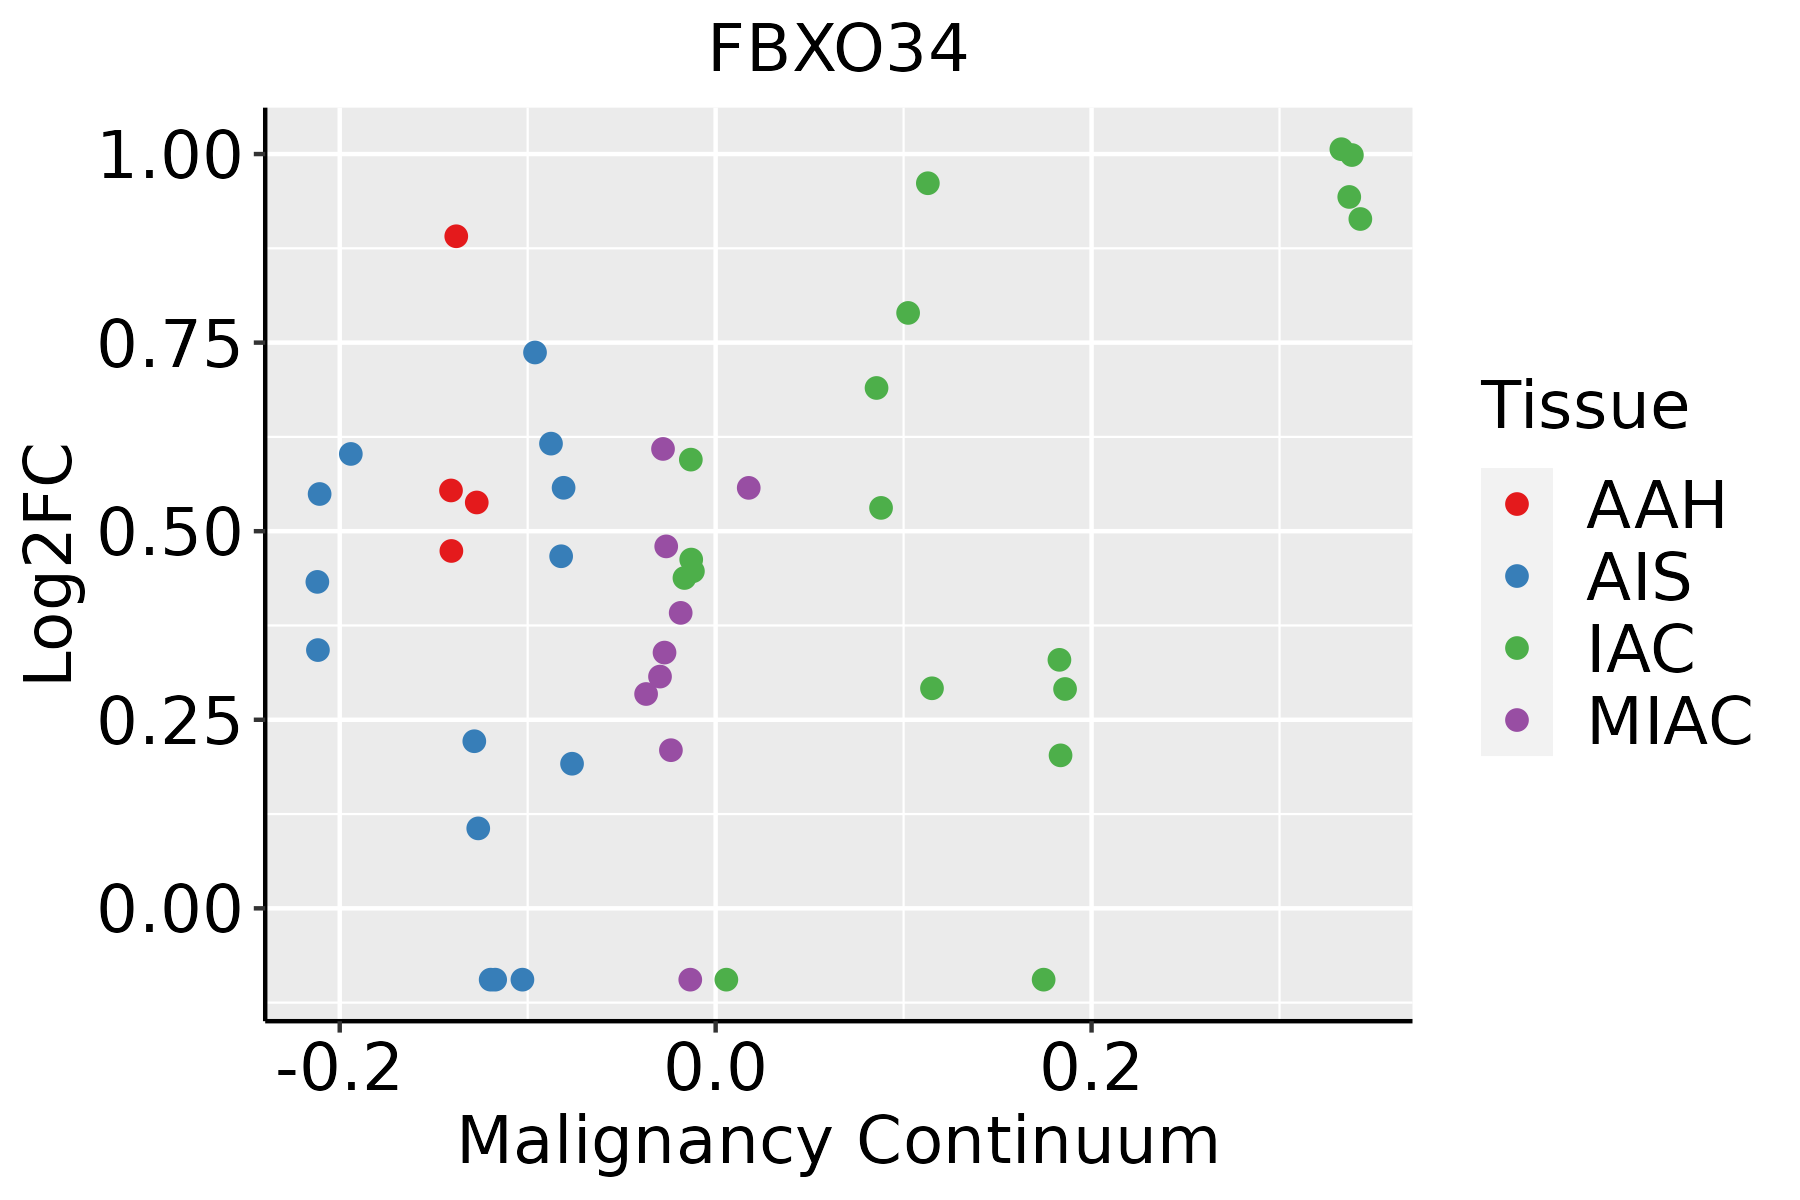 | AAH: Atypical adenomatous hyperplasia |
| AIS: Adenocarcinoma in situ | ||
| IAC: Invasive lung adenocarcinoma | ||
| MIA: Minimally invasive adenocarcinoma | ||
| Prostate |  | BPH: Benign Prostatic Hyperplasia |
| Thyroid | 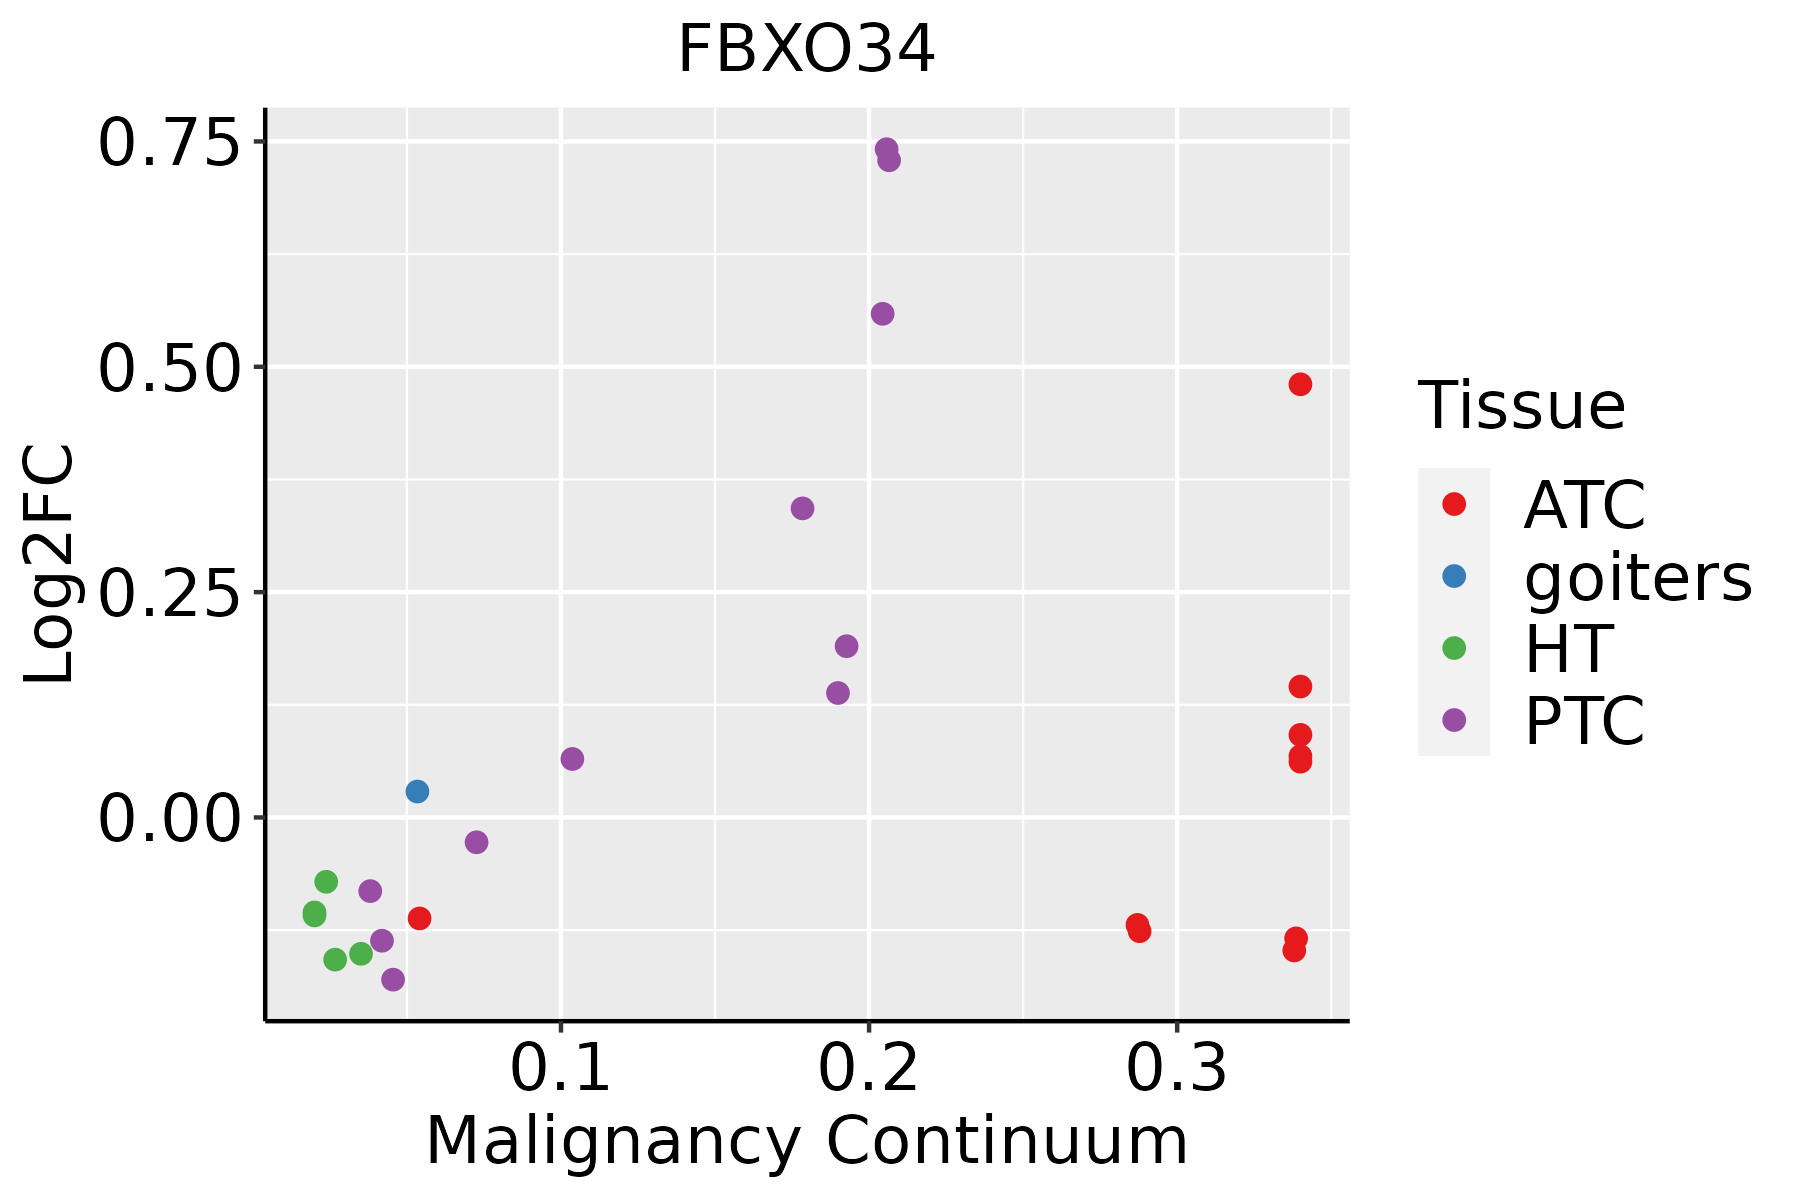 | ATC: Anaplastic thyroid cancer |
| HT: Hashimoto's thyroiditis | ||
| PTC: Papillary thyroid cancer |
| ∗log2FC in expression of this searched gene in stem-like cells from each diseased tissue sample relative to stem-like cells in normal samples in each tissue plotted against the malignancy continuum. Samples are colored based on if they are from different disease stage. |
Top |
Malignant transformation related pathway analysis |
| Find out the enriched GO biological processes and KEGG pathways involved in transition from healthy to precancer to cancer |
| Tissue | Disease Stage | Enriched GO biological Processes |
| Colorectum | AD |  |
| Colorectum | SER |  |
| Colorectum | MSS |  |
| Colorectum | MSI-H |  |
| Colorectum | FAP |  |
| ∗Top 15 enriched GO BP terms are showed in the bar plot of each disease state in each tissue. Each row represents a significant GO biological process which is colored according to the -log10(p.adjust). |
| Page: 1 2 3 4 5 6 7 8 9 |
| GO ID | Tissue | Disease Stage | Description | Gene Ratio | Bg Ratio | pvalue | p.adjust | Count |
| Page: 1 |
| Pathway ID | Tissue | Disease Stage | Description | Gene Ratio | Bg Ratio | pvalue | p.adjust | qvalue | Count |
| Page: 1 |
Top |
Cell-cell communication analysis |
| Identification of potential cell-cell interactions between two cell types and their ligand-receptor pairs for different disease states |
| Ligand | Receptor | LRpair | Pathway | Tissue | Disease Stage |
| Page: 1 |
Top |
Single-cell gene regulatory network inference analysis |
| Find out the significant the regulons (TFs) and the target genes of each regulon across cell types for different disease states |
| TF | Cell Type | Tissue | Disease Stage | Target Gene | RSS | Regulon Activity |
| ∗The dot plots of a searched regulon are shown for all cell subpopulations in each disease state of each tissue based on the regulon specific score inferred using pySCENIC and by calculating the average expression. |
| Page: 1 |
Top |
Somatic mutation of malignant transformation related genes |
| Annotation of somatic variants for genes involved in malignant transformation |
| Hugo Symbol | Variant Class | Variant Classification | dbSNP RS | HGVSc | HGVSp | HGVSp Short | SWISSPROT | BIOTYPE | SIFT | PolyPhen | Tumor Sample Barcode | Tissue | Histology | Sex | Age | Stage | Therapy Types | Drugs | Outcome |
| FBXO34 | SNV | Missense_Mutation | c.1987G>C | p.Gly663Arg | p.G663R | Q9NWN3 | protein_coding | deleterious(0) | probably_damaging(0.999) | TCGA-AN-A0XN-01 | Breast | breast invasive carcinoma | Female | >=65 | III/IV | Unknown | Unknown | SD | |
| FBXO34 | SNV | Missense_Mutation | c.98T>C | p.Val33Ala | p.V33A | Q9NWN3 | protein_coding | tolerated(1) | benign(0) | TCGA-D8-A27W-01 | Breast | breast invasive carcinoma | Female | <65 | III/IV | Chemotherapy | doxorubicine+cyclophosphamide | SD | |
| FBXO34 | insertion | Nonsense_Mutation | novel | c.1960_1961insGAAAAACAGCAACAGATATGATGTGGAAATG | p.Tyr654Ter | p.Y654* | Q9NWN3 | protein_coding | TCGA-A8-A08H-01 | Breast | breast invasive carcinoma | Female | >=65 | I/II | Unknown | Unknown | SD | ||
| FBXO34 | insertion | Nonsense_Mutation | novel | c.1935_1936insTTGACATGGTAGCCAAGTTGGAGT | p.Leu646_Cys647insThrTrpTerProSerTrpSerLeu | p.L646_C647insTW*PSWSL | Q9NWN3 | protein_coding | TCGA-AO-A0JB-01 | Breast | breast invasive carcinoma | Female | <65 | III/IV | Chemotherapy | cyclophosphamide | SD | ||
| FBXO34 | insertion | In_Frame_Ins | novel | c.1122_1123insACTACG | p.Pro374_Pro375insThrThr | p.P374_P375insTT | Q9NWN3 | protein_coding | TCGA-B6-A0I6-01 | Breast | breast invasive carcinoma | Female | <65 | I/II | Unknown | Unknown | PD | ||
| FBXO34 | insertion | Nonsense_Mutation | novel | c.1124_1125insCGGCTGATTTTTGTACTTTTAGTAAAG | p.Pro375_Leu376insGlyTerPheLeuTyrPheTerTerArg | p.P375_L376insG*FLYF**R | Q9NWN3 | protein_coding | TCGA-B6-A0I6-01 | Breast | breast invasive carcinoma | Female | <65 | I/II | Unknown | Unknown | PD | ||
| FBXO34 | insertion | Nonsense_Mutation | novel | c.1172_1173insATCATGAGAGAGTTGGTAAAGATTTAAT | p.Gly392SerfsTer2 | p.G392Sfs*2 | Q9NWN3 | protein_coding | TCGA-B6-A0RE-01 | Breast | breast invasive carcinoma | Female | <65 | I/II | Unknown | Unknown | SD | ||
| FBXO34 | SNV | Missense_Mutation | c.1610N>T | p.Ser537Phe | p.S537F | Q9NWN3 | protein_coding | deleterious(0.01) | benign(0.075) | TCGA-C5-A1BQ-01 | Cervix | cervical & endocervical cancer | Female | >=65 | III/IV | Chemotherapy | cisplatin | CR | |
| FBXO34 | SNV | Missense_Mutation | rs369227884 | c.823N>A | p.Glu275Lys | p.E275K | Q9NWN3 | protein_coding | tolerated(0.07) | probably_damaging(0.993) | TCGA-EA-A410-01 | Cervix | cervical & endocervical cancer | Female | <65 | I/II | Unknown | Unknown | SD |
| FBXO34 | SNV | Missense_Mutation | c.1607N>G | p.Ser536Cys | p.S536C | Q9NWN3 | protein_coding | tolerated(0.05) | possibly_damaging(0.621) | TCGA-EX-A69L-01 | Cervix | cervical & endocervical cancer | Female | <65 | I/II | Unknown | Unknown | SD |
| Page: 1 2 3 4 5 6 7 8 9 10 |
Top |
Related drugs of malignant transformation related genes |
| Identification of chemicals and drugs interact with genes involved in malignant transfromation |
| (DGIdb 4.0) |
| Entrez ID | Symbol | Category | Interaction Types | Drug Claim Name | Drug Name | PMIDs |
| Page: 1 |

Copyright 2023-Present -The University of Texas Health Science Center at Houston |