
|
|||||
|
 | |
| |
| |
| |
| |
| |
|
Gene: FBXO33 |
Gene summary for FBXO33 |
| Gene information | Species | Human | Gene symbol | FBXO33 | Gene ID | 254170 |
| Gene name | F-box protein 33 | |
| Gene Alias | BMND12 | |
| Cytomap | 14q21.1 | |
| Gene Type | protein-coding | GO ID | GO:0006464 | UniProtAcc | Q7Z6M2 |
Top |
Malignant transformation analysis |
| Identification of the aberrant gene expression in precancerous and cancerous lesions by comparing the gene expression of stem-like cells in diseased tissues with normal stem cells |
| Entrez ID | Symbol | Replicates | Species | Organ | Tissue | Adj P-value | Log2FC | Malignancy |
| 254170 | FBXO33 | LZE4T | Human | Esophagus | ESCC | 1.35e-02 | 5.40e-02 | 0.0811 |
| 254170 | FBXO33 | LZE7T | Human | Esophagus | ESCC | 1.61e-04 | 1.41e-01 | 0.0667 |
| 254170 | FBXO33 | LZE8T | Human | Esophagus | ESCC | 6.96e-03 | 4.75e-02 | 0.067 |
| 254170 | FBXO33 | LZE24T | Human | Esophagus | ESCC | 2.38e-05 | 2.65e-01 | 0.0596 |
| 254170 | FBXO33 | P1T-E | Human | Esophagus | ESCC | 1.92e-02 | 5.68e-02 | 0.0875 |
| 254170 | FBXO33 | P2T-E | Human | Esophagus | ESCC | 6.05e-12 | 8.22e-02 | 0.1177 |
| 254170 | FBXO33 | P4T-E | Human | Esophagus | ESCC | 1.31e-07 | 1.14e-01 | 0.1323 |
| 254170 | FBXO33 | P5T-E | Human | Esophagus | ESCC | 1.07e-08 | 5.73e-02 | 0.1327 |
| 254170 | FBXO33 | P8T-E | Human | Esophagus | ESCC | 4.03e-20 | 4.20e-01 | 0.0889 |
| 254170 | FBXO33 | P9T-E | Human | Esophagus | ESCC | 9.35e-07 | 1.63e-01 | 0.1131 |
| 254170 | FBXO33 | P10T-E | Human | Esophagus | ESCC | 9.22e-18 | 1.36e-01 | 0.116 |
| 254170 | FBXO33 | P12T-E | Human | Esophagus | ESCC | 7.07e-53 | 1.35e+00 | 0.1122 |
| 254170 | FBXO33 | P15T-E | Human | Esophagus | ESCC | 6.77e-19 | 3.86e-01 | 0.1149 |
| 254170 | FBXO33 | P16T-E | Human | Esophagus | ESCC | 1.88e-07 | 3.33e-02 | 0.1153 |
| 254170 | FBXO33 | P20T-E | Human | Esophagus | ESCC | 4.11e-10 | 1.59e-01 | 0.1124 |
| 254170 | FBXO33 | P21T-E | Human | Esophagus | ESCC | 4.29e-03 | 2.77e-03 | 0.1617 |
| 254170 | FBXO33 | P22T-E | Human | Esophagus | ESCC | 7.90e-04 | 1.53e-02 | 0.1236 |
| 254170 | FBXO33 | P23T-E | Human | Esophagus | ESCC | 6.76e-05 | 6.26e-02 | 0.108 |
| 254170 | FBXO33 | P24T-E | Human | Esophagus | ESCC | 3.93e-07 | -9.22e-03 | 0.1287 |
| 254170 | FBXO33 | P26T-E | Human | Esophagus | ESCC | 8.02e-21 | 5.02e-01 | 0.1276 |
| Page: 1 2 3 |
| Tissue | Expression Dynamics | Abbreviation |
| Esophagus | 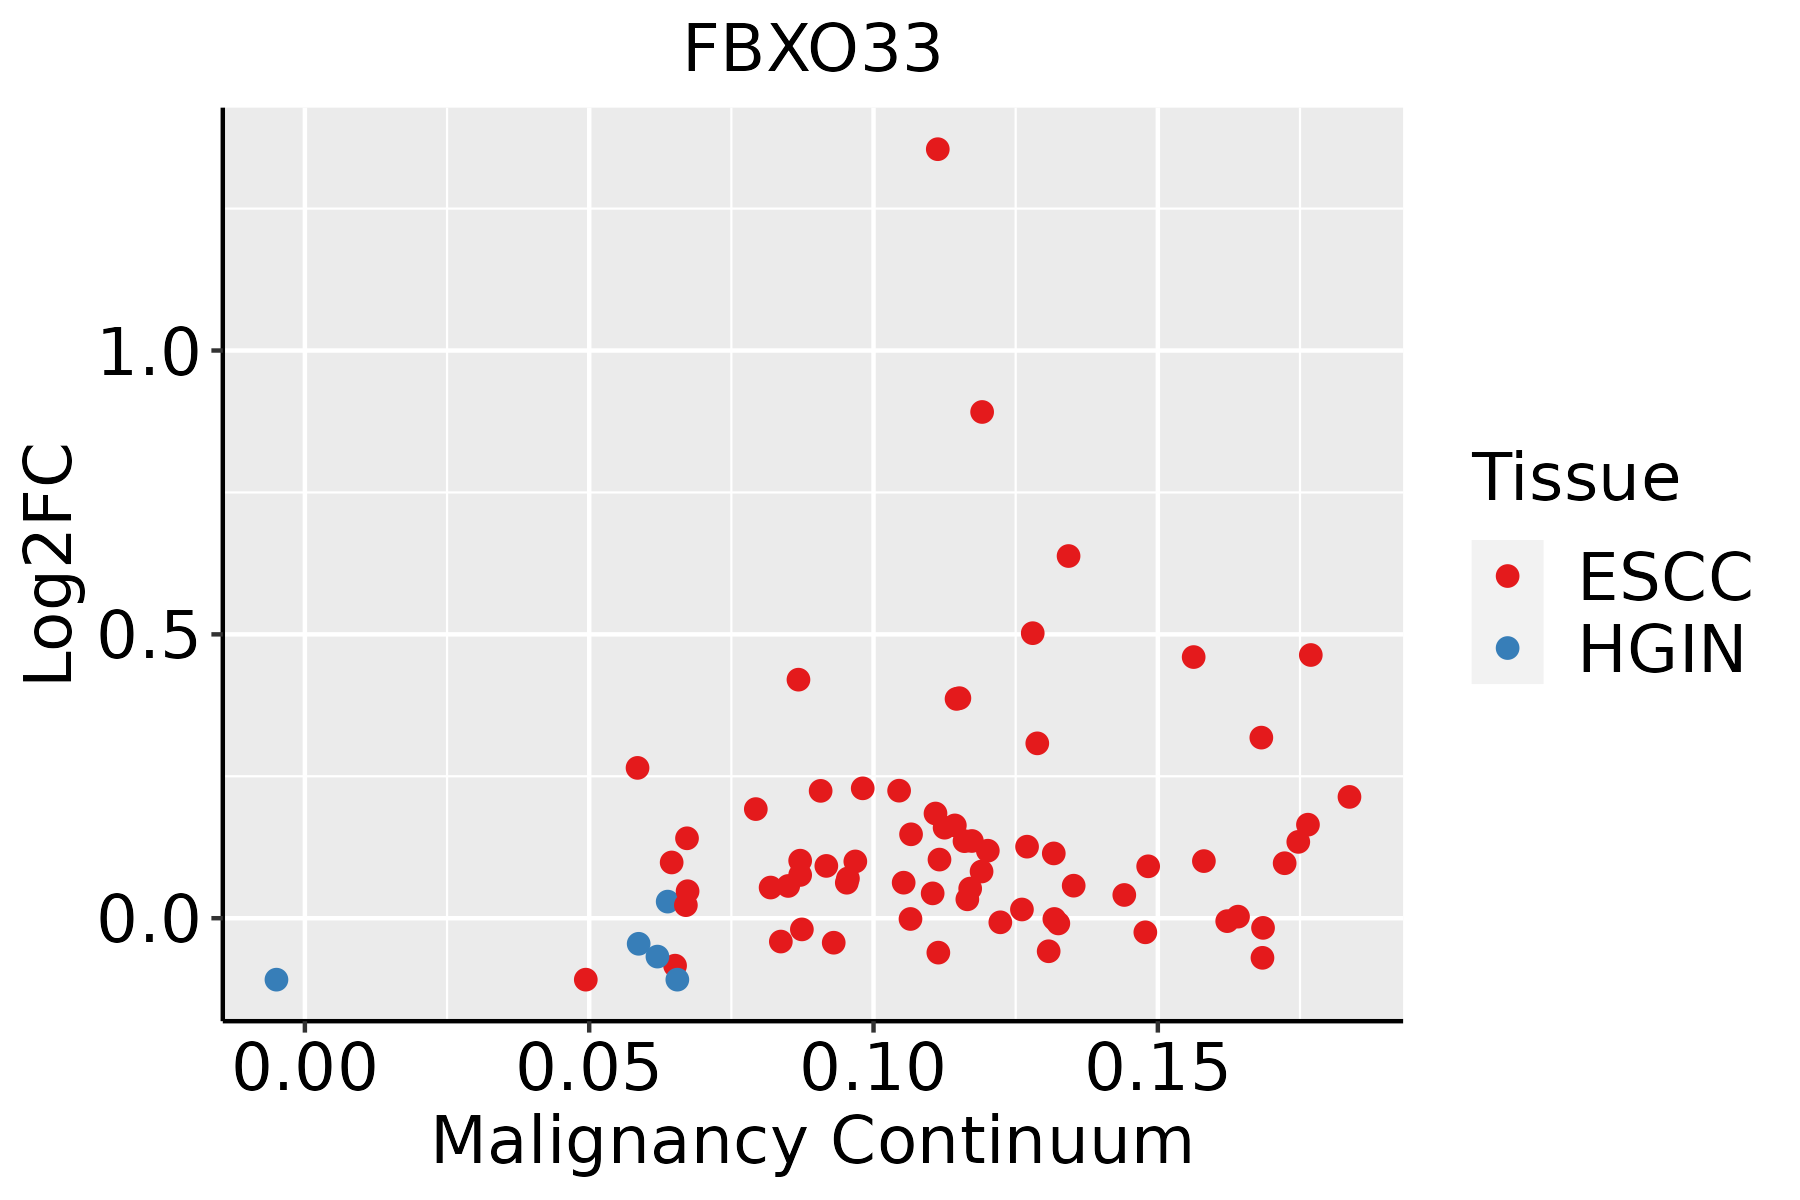 | ESCC: Esophageal squamous cell carcinoma |
| HGIN: High-grade intraepithelial neoplasias | ||
| LGIN: Low-grade intraepithelial neoplasias |
| ∗log2FC in expression of this searched gene in stem-like cells from each diseased tissue sample relative to stem-like cells in normal samples in each tissue plotted against the malignancy continuum. Samples are colored based on if they are from different disease stage. |
Top |
Malignant transformation related pathway analysis |
| Find out the enriched GO biological processes and KEGG pathways involved in transition from healthy to precancer to cancer |
| Tissue | Disease Stage | Enriched GO biological Processes |
| Colorectum | AD |  |
| Colorectum | SER |  |
| Colorectum | MSS |  |
| Colorectum | MSI-H |  |
| Colorectum | FAP |  |
| ∗Top 15 enriched GO BP terms are showed in the bar plot of each disease state in each tissue. Each row represents a significant GO biological process which is colored according to the -log10(p.adjust). |
| Page: 1 2 3 4 5 6 7 8 9 |
| GO ID | Tissue | Disease Stage | Description | Gene Ratio | Bg Ratio | pvalue | p.adjust | Count |
| GO:0010498111 | Esophagus | ESCC | proteasomal protein catabolic process | 369/8552 | 490/18723 | 1.13e-41 | 1.80e-38 | 369 |
| GO:0043161111 | Esophagus | ESCC | proteasome-mediated ubiquitin-dependent protein catabolic process | 312/8552 | 412/18723 | 3.53e-36 | 4.48e-33 | 312 |
| GO:1903320111 | Esophagus | ESCC | regulation of protein modification by small protein conjugation or removal | 181/8552 | 242/18723 | 1.80e-20 | 2.60e-18 | 181 |
| GO:0031396111 | Esophagus | ESCC | regulation of protein ubiquitination | 154/8552 | 210/18723 | 2.70e-16 | 2.04e-14 | 154 |
| GO:190332216 | Esophagus | ESCC | positive regulation of protein modification by small protein conjugation or removal | 99/8552 | 138/18723 | 4.39e-10 | 1.16e-08 | 99 |
| GO:003139816 | Esophagus | ESCC | positive regulation of protein ubiquitination | 82/8552 | 119/18723 | 2.41e-07 | 3.64e-06 | 82 |
| GO:00311461 | Esophagus | ESCC | SCF-dependent proteasomal ubiquitin-dependent protein catabolic process | 33/8552 | 49/18723 | 1.80e-03 | 8.26e-03 | 33 |
| Page: 1 |
| Pathway ID | Tissue | Disease Stage | Description | Gene Ratio | Bg Ratio | pvalue | p.adjust | qvalue | Count |
| Page: 1 |
Top |
Cell-cell communication analysis |
| Identification of potential cell-cell interactions between two cell types and their ligand-receptor pairs for different disease states |
| Ligand | Receptor | LRpair | Pathway | Tissue | Disease Stage |
| Page: 1 |
Top |
Single-cell gene regulatory network inference analysis |
| Find out the significant the regulons (TFs) and the target genes of each regulon across cell types for different disease states |
| TF | Cell Type | Tissue | Disease Stage | Target Gene | RSS | Regulon Activity |
| ∗The dot plots of a searched regulon are shown for all cell subpopulations in each disease state of each tissue based on the regulon specific score inferred using pySCENIC and by calculating the average expression. |
| Page: 1 |
Top |
Somatic mutation of malignant transformation related genes |
| Annotation of somatic variants for genes involved in malignant transformation |
| Hugo Symbol | Variant Class | Variant Classification | dbSNP RS | HGVSc | HGVSp | HGVSp Short | SWISSPROT | BIOTYPE | SIFT | PolyPhen | Tumor Sample Barcode | Tissue | Histology | Sex | Age | Stage | Therapy Types | Drugs | Outcome |
| FBXO33 | SNV | Missense_Mutation | c.916N>A | p.Val306Met | p.V306M | Q7Z6M2 | protein_coding | tolerated(0.21) | benign(0.031) | TCGA-BH-A0HF-01 | Breast | breast invasive carcinoma | Female | >=65 | I/II | Hormone Therapy | arimidex | SD | |
| FBXO33 | SNV | Missense_Mutation | novel | c.1198N>A | p.Asp400Asn | p.D400N | Q7Z6M2 | protein_coding | deleterious(0.04) | probably_damaging(0.996) | TCGA-BH-A2L8-01 | Breast | breast invasive carcinoma | Female | <65 | I/II | Chemotherapy | cytoxan | CR |
| FBXO33 | SNV | Missense_Mutation | c.727G>A | p.Glu243Lys | p.E243K | Q7Z6M2 | protein_coding | tolerated(0.48) | possibly_damaging(0.76) | TCGA-D8-A27G-01 | Breast | breast invasive carcinoma | Female | >=65 | I/II | Unknown | Unknown | SD | |
| FBXO33 | SNV | Missense_Mutation | c.1054G>A | p.Asp352Asn | p.D352N | Q7Z6M2 | protein_coding | deleterious(0.02) | benign(0.006) | TCGA-D8-A27R-01 | Breast | breast invasive carcinoma | Female | <65 | III/IV | Chemotherapy | adriamycin+cyclophosphamide | SD | |
| FBXO33 | SNV | Missense_Mutation | novel | c.871N>G | p.Pro291Ala | p.P291A | Q7Z6M2 | protein_coding | tolerated(0.05) | benign(0.034) | TCGA-E9-A22E-01 | Breast | breast invasive carcinoma | Female | <65 | III/IV | Chemotherapy | cyclophosphane | SD |
| FBXO33 | insertion | Nonsense_Mutation | novel | c.554_555insGATC | p.Tyr185Ter | p.Y185* | Q7Z6M2 | protein_coding | TCGA-A8-A07R-01 | Breast | breast invasive carcinoma | Female | >=65 | III/IV | Ancillary | zoledronic | SD | ||
| FBXO33 | insertion | In_Frame_Ins | novel | c.552_553insCTATTAATT | p.Thr184_Tyr185insLeuLeuIle | p.T184_Y185insLLI | Q7Z6M2 | protein_coding | TCGA-A8-A07R-01 | Breast | breast invasive carcinoma | Female | >=65 | III/IV | Ancillary | zoledronic | SD | ||
| FBXO33 | SNV | Missense_Mutation | c.1450N>A | p.Asp484Asn | p.D484N | Q7Z6M2 | protein_coding | tolerated(0.47) | benign(0.001) | TCGA-C5-A1MK-01 | Cervix | cervical & endocervical cancer | Female | >=65 | III/IV | Chemotherapy | carboplatin | PD | |
| FBXO33 | SNV | Missense_Mutation | c.818C>G | p.Ser273Cys | p.S273C | Q7Z6M2 | protein_coding | deleterious(0.02) | possibly_damaging(0.498) | TCGA-LP-A5U2-01 | Cervix | cervical & endocervical cancer | Female | <65 | III/IV | Unknown | Unknown | SD | |
| FBXO33 | SNV | Missense_Mutation | c.1274N>G | p.Phe425Cys | p.F425C | Q7Z6M2 | protein_coding | deleterious(0.01) | probably_damaging(0.996) | TCGA-AA-3510-01 | Colorectum | colon adenocarcinoma | Male | >=65 | I/II | Unknown | Unknown | SD |
| Page: 1 2 3 4 |
Top |
Related drugs of malignant transformation related genes |
| Identification of chemicals and drugs interact with genes involved in malignant transfromation |
| (DGIdb 4.0) |
| Entrez ID | Symbol | Category | Interaction Types | Drug Claim Name | Drug Name | PMIDs |
| Page: 1 |

Copyright 2023-Present -The University of Texas Health Science Center at Houston |