
|
|||||
|
 | |
| |
| |
| |
| |
| |
|
Gene: FBXO31 |
Gene summary for FBXO31 |
| Gene information | Species | Human | Gene symbol | FBXO31 | Gene ID | 79791 |
| Gene name | F-box protein 31 | |
| Gene Alias | FBX14 | |
| Cytomap | 16q24.2 | |
| Gene Type | protein-coding | GO ID | GO:0000075 | UniProtAcc | A0A0C4DGU8 |
Top |
Malignant transformation analysis |
| Identification of the aberrant gene expression in precancerous and cancerous lesions by comparing the gene expression of stem-like cells in diseased tissues with normal stem cells |
| Entrez ID | Symbol | Replicates | Species | Organ | Tissue | Adj P-value | Log2FC | Malignancy |
| 79791 | FBXO31 | LZE4T | Human | Esophagus | ESCC | 2.48e-03 | 7.87e-02 | 0.0811 |
| 79791 | FBXO31 | LZE7T | Human | Esophagus | ESCC | 4.09e-08 | 3.26e-01 | 0.0667 |
| 79791 | FBXO31 | LZE24T | Human | Esophagus | ESCC | 1.06e-08 | 2.31e-01 | 0.0596 |
| 79791 | FBXO31 | LZE21T | Human | Esophagus | ESCC | 3.93e-05 | 2.26e-01 | 0.0655 |
| 79791 | FBXO31 | P1T-E | Human | Esophagus | ESCC | 1.92e-05 | 2.22e-01 | 0.0875 |
| 79791 | FBXO31 | P2T-E | Human | Esophagus | ESCC | 7.48e-14 | 1.97e-01 | 0.1177 |
| 79791 | FBXO31 | P4T-E | Human | Esophagus | ESCC | 4.52e-10 | 1.49e-01 | 0.1323 |
| 79791 | FBXO31 | P5T-E | Human | Esophagus | ESCC | 2.16e-12 | 1.33e-01 | 0.1327 |
| 79791 | FBXO31 | P8T-E | Human | Esophagus | ESCC | 5.91e-07 | 1.10e-01 | 0.0889 |
| 79791 | FBXO31 | P9T-E | Human | Esophagus | ESCC | 1.41e-07 | 1.61e-01 | 0.1131 |
| 79791 | FBXO31 | P10T-E | Human | Esophagus | ESCC | 3.28e-03 | 8.06e-02 | 0.116 |
| 79791 | FBXO31 | P11T-E | Human | Esophagus | ESCC | 1.60e-09 | 2.49e-01 | 0.1426 |
| 79791 | FBXO31 | P12T-E | Human | Esophagus | ESCC | 7.67e-21 | 2.90e-01 | 0.1122 |
| 79791 | FBXO31 | P15T-E | Human | Esophagus | ESCC | 1.79e-18 | 3.98e-01 | 0.1149 |
| 79791 | FBXO31 | P16T-E | Human | Esophagus | ESCC | 1.74e-14 | 1.55e-01 | 0.1153 |
| 79791 | FBXO31 | P19T-E | Human | Esophagus | ESCC | 3.60e-02 | 3.32e-01 | 0.1662 |
| 79791 | FBXO31 | P20T-E | Human | Esophagus | ESCC | 3.35e-12 | 2.17e-01 | 0.1124 |
| 79791 | FBXO31 | P21T-E | Human | Esophagus | ESCC | 2.59e-11 | 1.69e-01 | 0.1617 |
| 79791 | FBXO31 | P22T-E | Human | Esophagus | ESCC | 3.47e-15 | 2.88e-01 | 0.1236 |
| 79791 | FBXO31 | P23T-E | Human | Esophagus | ESCC | 6.74e-13 | 3.02e-01 | 0.108 |
| Page: 1 2 3 4 |
| Tissue | Expression Dynamics | Abbreviation |
| Esophagus | 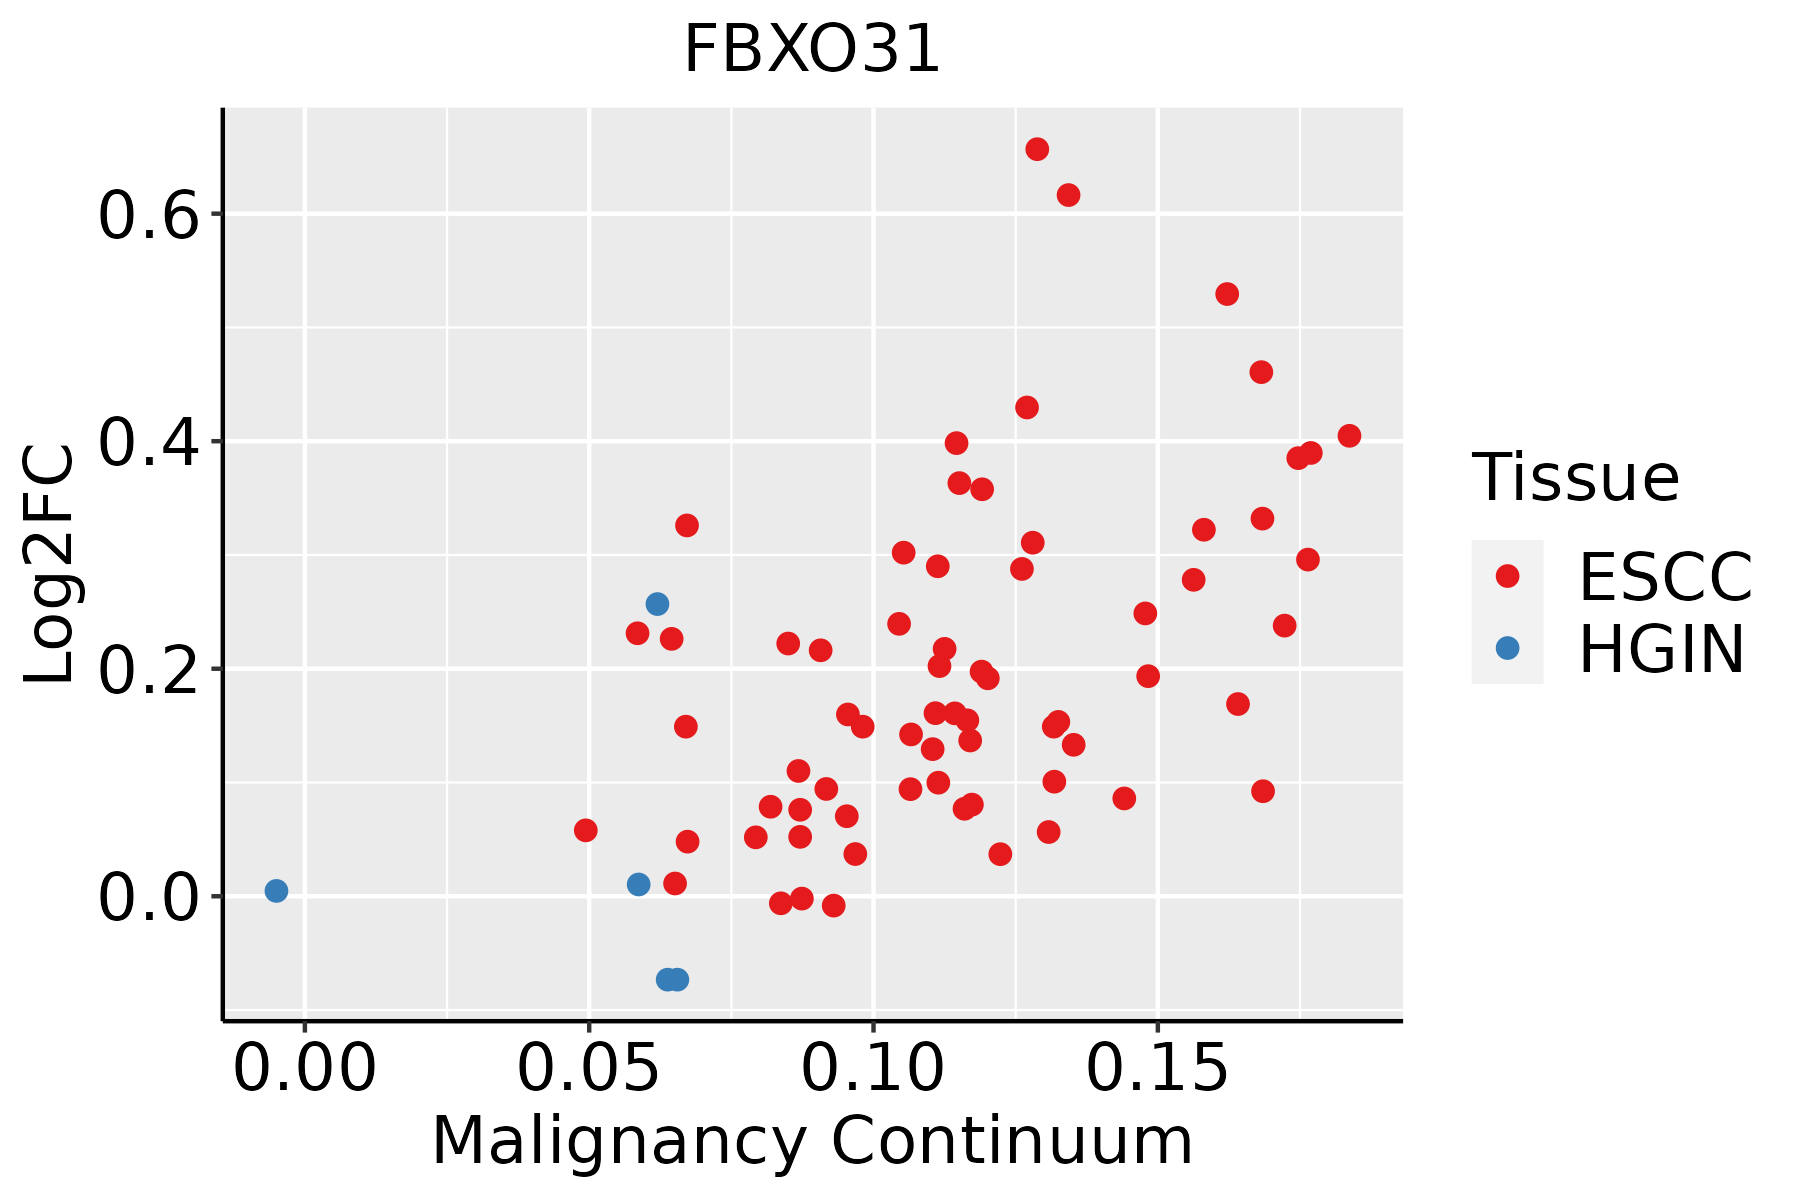 | ESCC: Esophageal squamous cell carcinoma |
| HGIN: High-grade intraepithelial neoplasias | ||
| LGIN: Low-grade intraepithelial neoplasias | ||
| Liver |  | HCC: Hepatocellular carcinoma |
| NAFLD: Non-alcoholic fatty liver disease |
| ∗log2FC in expression of this searched gene in stem-like cells from each diseased tissue sample relative to stem-like cells in normal samples in each tissue plotted against the malignancy continuum. Samples are colored based on if they are from different disease stage. |
Top |
Malignant transformation related pathway analysis |
| Find out the enriched GO biological processes and KEGG pathways involved in transition from healthy to precancer to cancer |
| Tissue | Disease Stage | Enriched GO biological Processes |
| Colorectum | AD |  |
| Colorectum | SER |  |
| Colorectum | MSS |  |
| Colorectum | MSI-H |  |
| Colorectum | FAP |  |
| ∗Top 15 enriched GO BP terms are showed in the bar plot of each disease state in each tissue. Each row represents a significant GO biological process which is colored according to the -log10(p.adjust). |
| Page: 1 2 3 4 5 6 7 8 9 |
| GO ID | Tissue | Disease Stage | Description | Gene Ratio | Bg Ratio | pvalue | p.adjust | Count |
| GO:0010498111 | Esophagus | ESCC | proteasomal protein catabolic process | 369/8552 | 490/18723 | 1.13e-41 | 1.80e-38 | 369 |
| GO:0043161111 | Esophagus | ESCC | proteasome-mediated ubiquitin-dependent protein catabolic process | 312/8552 | 412/18723 | 3.53e-36 | 4.48e-33 | 312 |
| GO:004477216 | Esophagus | ESCC | mitotic cell cycle phase transition | 281/8552 | 424/18723 | 4.63e-18 | 4.45e-16 | 281 |
| GO:000734615 | Esophagus | ESCC | regulation of mitotic cell cycle | 293/8552 | 457/18723 | 8.00e-16 | 5.64e-14 | 293 |
| GO:190198713 | Esophagus | ESCC | regulation of cell cycle phase transition | 242/8552 | 390/18723 | 3.86e-11 | 1.26e-09 | 242 |
| GO:190199013 | Esophagus | ESCC | regulation of mitotic cell cycle phase transition | 191/8552 | 299/18723 | 1.35e-10 | 3.94e-09 | 191 |
| GO:00457865 | Esophagus | ESCC | negative regulation of cell cycle | 236/8552 | 385/18723 | 3.62e-10 | 9.93e-09 | 236 |
| GO:00000754 | Esophagus | ESCC | cell cycle checkpoint | 117/8552 | 169/18723 | 4.47e-10 | 1.17e-08 | 117 |
| GO:004277014 | Esophagus | ESCC | signal transduction in response to DNA damage | 117/8552 | 172/18723 | 2.38e-09 | 5.32e-08 | 117 |
| GO:00070934 | Esophagus | ESCC | mitotic cell cycle checkpoint | 90/8552 | 129/18723 | 2.49e-08 | 4.69e-07 | 90 |
| GO:00109484 | Esophagus | ESCC | negative regulation of cell cycle process | 177/8552 | 294/18723 | 3.26e-07 | 4.59e-06 | 177 |
| GO:000008214 | Esophagus | ESCC | G1/S transition of mitotic cell cycle | 134/8552 | 214/18723 | 4.04e-07 | 5.55e-06 | 134 |
| GO:004484314 | Esophagus | ESCC | cell cycle G1/S phase transition | 148/8552 | 241/18723 | 5.68e-07 | 7.48e-06 | 148 |
| GO:00315705 | Esophagus | ESCC | DNA integrity checkpoint | 83/8552 | 123/18723 | 8.17e-07 | 1.06e-05 | 83 |
| GO:00000775 | Esophagus | ESCC | DNA damage checkpoint | 78/8552 | 115/18723 | 1.27e-06 | 1.56e-05 | 78 |
| GO:19019883 | Esophagus | ESCC | negative regulation of cell cycle phase transition | 151/8552 | 249/18723 | 1.28e-06 | 1.57e-05 | 151 |
| GO:004593013 | Esophagus | ESCC | negative regulation of mitotic cell cycle | 143/8552 | 235/18723 | 1.84e-06 | 2.15e-05 | 143 |
| GO:190199113 | Esophagus | ESCC | negative regulation of mitotic cell cycle phase transition | 112/8552 | 179/18723 | 3.69e-06 | 4.03e-05 | 112 |
| GO:002260420 | Esophagus | ESCC | regulation of cell morphogenesis | 180/8552 | 309/18723 | 5.19e-06 | 5.45e-05 | 180 |
| GO:003134616 | Esophagus | ESCC | positive regulation of cell projection organization | 201/8552 | 353/18723 | 1.19e-05 | 1.11e-04 | 201 |
| Page: 1 2 3 4 5 |
| Pathway ID | Tissue | Disease Stage | Description | Gene Ratio | Bg Ratio | pvalue | p.adjust | qvalue | Count |
| Page: 1 |
Top |
Cell-cell communication analysis |
| Identification of potential cell-cell interactions between two cell types and their ligand-receptor pairs for different disease states |
| Ligand | Receptor | LRpair | Pathway | Tissue | Disease Stage |
| Page: 1 |
Top |
Single-cell gene regulatory network inference analysis |
| Find out the significant the regulons (TFs) and the target genes of each regulon across cell types for different disease states |
| TF | Cell Type | Tissue | Disease Stage | Target Gene | RSS | Regulon Activity |
| ∗The dot plots of a searched regulon are shown for all cell subpopulations in each disease state of each tissue based on the regulon specific score inferred using pySCENIC and by calculating the average expression. |
| Page: 1 |
Top |
Somatic mutation of malignant transformation related genes |
| Annotation of somatic variants for genes involved in malignant transformation |
| Hugo Symbol | Variant Class | Variant Classification | dbSNP RS | HGVSc | HGVSp | HGVSp Short | SWISSPROT | BIOTYPE | SIFT | PolyPhen | Tumor Sample Barcode | Tissue | Histology | Sex | Age | Stage | Therapy Types | Drugs | Outcome |
| FBXO31 | SNV | Missense_Mutation | c.821N>C | p.Phe274Ser | p.F274S | Q5XUX0 | protein_coding | deleterious(0) | probably_damaging(0.994) | TCGA-A8-A09Z-01 | Breast | breast invasive carcinoma | Female | >=65 | I/II | Unknown | Unknown | SD | |
| FBXO31 | SNV | Missense_Mutation | c.718N>T | p.Gly240Cys | p.G240C | Q5XUX0 | protein_coding | deleterious(0.02) | probably_damaging(1) | TCGA-JW-A852-01 | Cervix | cervical & endocervical cancer | Female | <65 | I/II | Unknown | Unknown | PD | |
| FBXO31 | SNV | Missense_Mutation | novel | c.404N>G | p.Tyr135Cys | p.Y135C | Q5XUX0 | protein_coding | deleterious(0.01) | probably_damaging(0.942) | TCGA-AA-3949-01 | Colorectum | colon adenocarcinoma | Female | >=65 | III/IV | Unknown | Unknown | SD |
| FBXO31 | SNV | Missense_Mutation | rs772688100 | c.1051C>T | p.Arg351Trp | p.R351W | Q5XUX0 | protein_coding | deleterious(0) | possibly_damaging(0.846) | TCGA-AA-3977-01 | Colorectum | colon adenocarcinoma | Male | >=65 | I/II | Unknown | Unknown | SD |
| FBXO31 | SNV | Missense_Mutation | c.365G>A | p.Arg122Gln | p.R122Q | Q5XUX0 | protein_coding | tolerated(1) | probably_damaging(0.992) | TCGA-AZ-6601-01 | Colorectum | colon adenocarcinoma | Male | >=65 | I/II | Unknown | Unknown | PD | |
| FBXO31 | SNV | Missense_Mutation | c.1121N>A | p.Arg374His | p.R374H | Q5XUX0 | protein_coding | tolerated(0.63) | benign(0) | TCGA-F4-6856-01 | Colorectum | colon adenocarcinoma | Male | <65 | I/II | Ancillary | leucovorin | CR | |
| FBXO31 | SNV | Missense_Mutation | c.394N>T | p.Arg132Trp | p.R132W | Q5XUX0 | protein_coding | deleterious(0) | possibly_damaging(0.714) | TCGA-G4-6302-01 | Colorectum | colon adenocarcinoma | Female | >=65 | I/II | Unknown | Unknown | SD | |
| FBXO31 | SNV | Missense_Mutation | c.1318N>C | p.Cys440Arg | p.C440R | Q5XUX0 | protein_coding | tolerated_low_confidence(0.59) | benign(0) | TCGA-G4-6586-01 | Colorectum | colon adenocarcinoma | Female | >=65 | I/II | Unknown | Unknown | SD | |
| FBXO31 | SNV | Missense_Mutation | c.740N>A | p.Arg247Gln | p.R247Q | Q5XUX0 | protein_coding | tolerated(0.13) | probably_damaging(0.992) | TCGA-AG-A026-01 | Colorectum | rectum adenocarcinoma | Male | >=65 | I/II | Unknown | Unknown | PD | |
| FBXO31 | SNV | Missense_Mutation | c.544N>A | p.Val182Ile | p.V182I | Q5XUX0 | protein_coding | deleterious(0.04) | probably_damaging(0.979) | TCGA-EI-6882-01 | Colorectum | rectum adenocarcinoma | Male | <65 | I/II | Unknown | Unknown | SD |
| Page: 1 2 3 4 5 6 |
Top |
Related drugs of malignant transformation related genes |
| Identification of chemicals and drugs interact with genes involved in malignant transfromation |
| (DGIdb 4.0) |
| Entrez ID | Symbol | Category | Interaction Types | Drug Claim Name | Drug Name | PMIDs |
| Page: 1 |

Copyright 2023-Present -The University of Texas Health Science Center at Houston |