
|
|||||
|
 | |
| |
| |
| |
| |
| |
|
Gene: FBXO28 |
Gene summary for FBXO28 |
| Gene information | Species | Human | Gene symbol | FBXO28 | Gene ID | 23219 |
| Gene name | F-box protein 28 | |
| Gene Alias | CENP-30 | |
| Cytomap | 1q42.11 | |
| Gene Type | protein-coding | GO ID | GO:0000209 | UniProtAcc | Q9NVF7 |
Top |
Malignant transformation analysis |
| Identification of the aberrant gene expression in precancerous and cancerous lesions by comparing the gene expression of stem-like cells in diseased tissues with normal stem cells |
| Entrez ID | Symbol | Replicates | Species | Organ | Tissue | Adj P-value | Log2FC | Malignancy |
| 23219 | FBXO28 | CCI_1 | Human | Cervix | CC | 2.51e-03 | 7.75e-01 | 0.528 |
| 23219 | FBXO28 | CCI_3 | Human | Cervix | CC | 4.38e-04 | 5.94e-01 | 0.516 |
| 23219 | FBXO28 | LZE4T | Human | Esophagus | ESCC | 9.18e-11 | 1.49e-01 | 0.0811 |
| 23219 | FBXO28 | LZE7T | Human | Esophagus | ESCC | 1.40e-06 | 4.18e-01 | 0.0667 |
| 23219 | FBXO28 | LZE8T | Human | Esophagus | ESCC | 2.70e-05 | 6.46e-02 | 0.067 |
| 23219 | FBXO28 | LZE20T | Human | Esophagus | ESCC | 6.15e-05 | 1.06e-01 | 0.0662 |
| 23219 | FBXO28 | LZE24T | Human | Esophagus | ESCC | 3.98e-05 | 1.50e-01 | 0.0596 |
| 23219 | FBXO28 | P2T-E | Human | Esophagus | ESCC | 9.05e-19 | 2.55e-01 | 0.1177 |
| 23219 | FBXO28 | P4T-E | Human | Esophagus | ESCC | 5.04e-18 | 2.37e-01 | 0.1323 |
| 23219 | FBXO28 | P5T-E | Human | Esophagus | ESCC | 2.62e-14 | 2.06e-01 | 0.1327 |
| 23219 | FBXO28 | P8T-E | Human | Esophagus | ESCC | 2.49e-12 | 1.34e-01 | 0.0889 |
| 23219 | FBXO28 | P9T-E | Human | Esophagus | ESCC | 2.31e-08 | 2.30e-01 | 0.1131 |
| 23219 | FBXO28 | P10T-E | Human | Esophagus | ESCC | 2.50e-21 | 2.20e-01 | 0.116 |
| 23219 | FBXO28 | P11T-E | Human | Esophagus | ESCC | 5.47e-09 | 3.63e-01 | 0.1426 |
| 23219 | FBXO28 | P12T-E | Human | Esophagus | ESCC | 3.96e-05 | 1.23e-01 | 0.1122 |
| 23219 | FBXO28 | P15T-E | Human | Esophagus | ESCC | 9.39e-20 | 2.49e-01 | 0.1149 |
| 23219 | FBXO28 | P16T-E | Human | Esophagus | ESCC | 5.60e-20 | 2.67e-01 | 0.1153 |
| 23219 | FBXO28 | P17T-E | Human | Esophagus | ESCC | 1.71e-03 | 1.04e-01 | 0.1278 |
| 23219 | FBXO28 | P19T-E | Human | Esophagus | ESCC | 5.37e-03 | 2.12e-01 | 0.1662 |
| 23219 | FBXO28 | P20T-E | Human | Esophagus | ESCC | 2.07e-18 | 2.28e-01 | 0.1124 |
| Page: 1 2 3 4 |
| Tissue | Expression Dynamics | Abbreviation |
| Cervix | 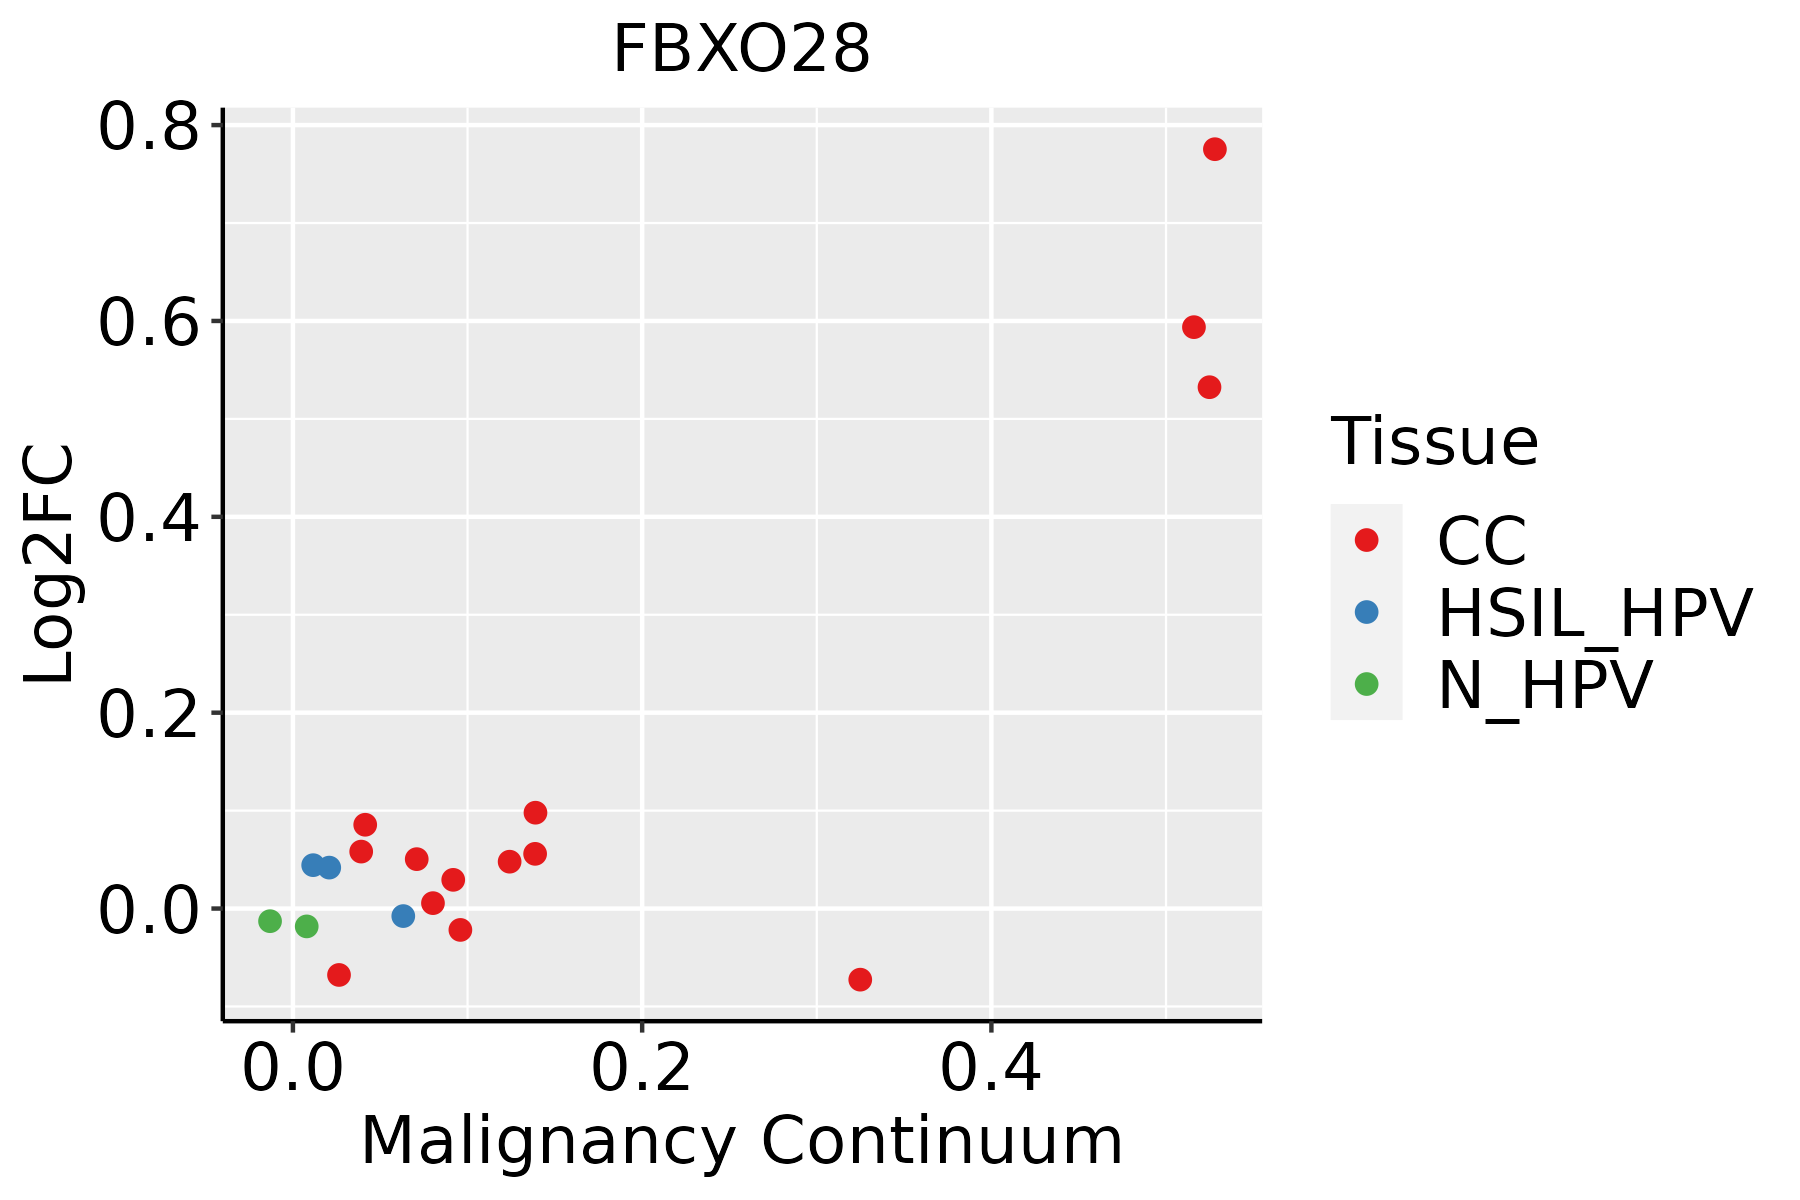 | CC: Cervix cancer |
| HSIL_HPV: HPV-infected high-grade squamous intraepithelial lesions | ||
| N_HPV: HPV-infected normal cervix | ||
| Esophagus | 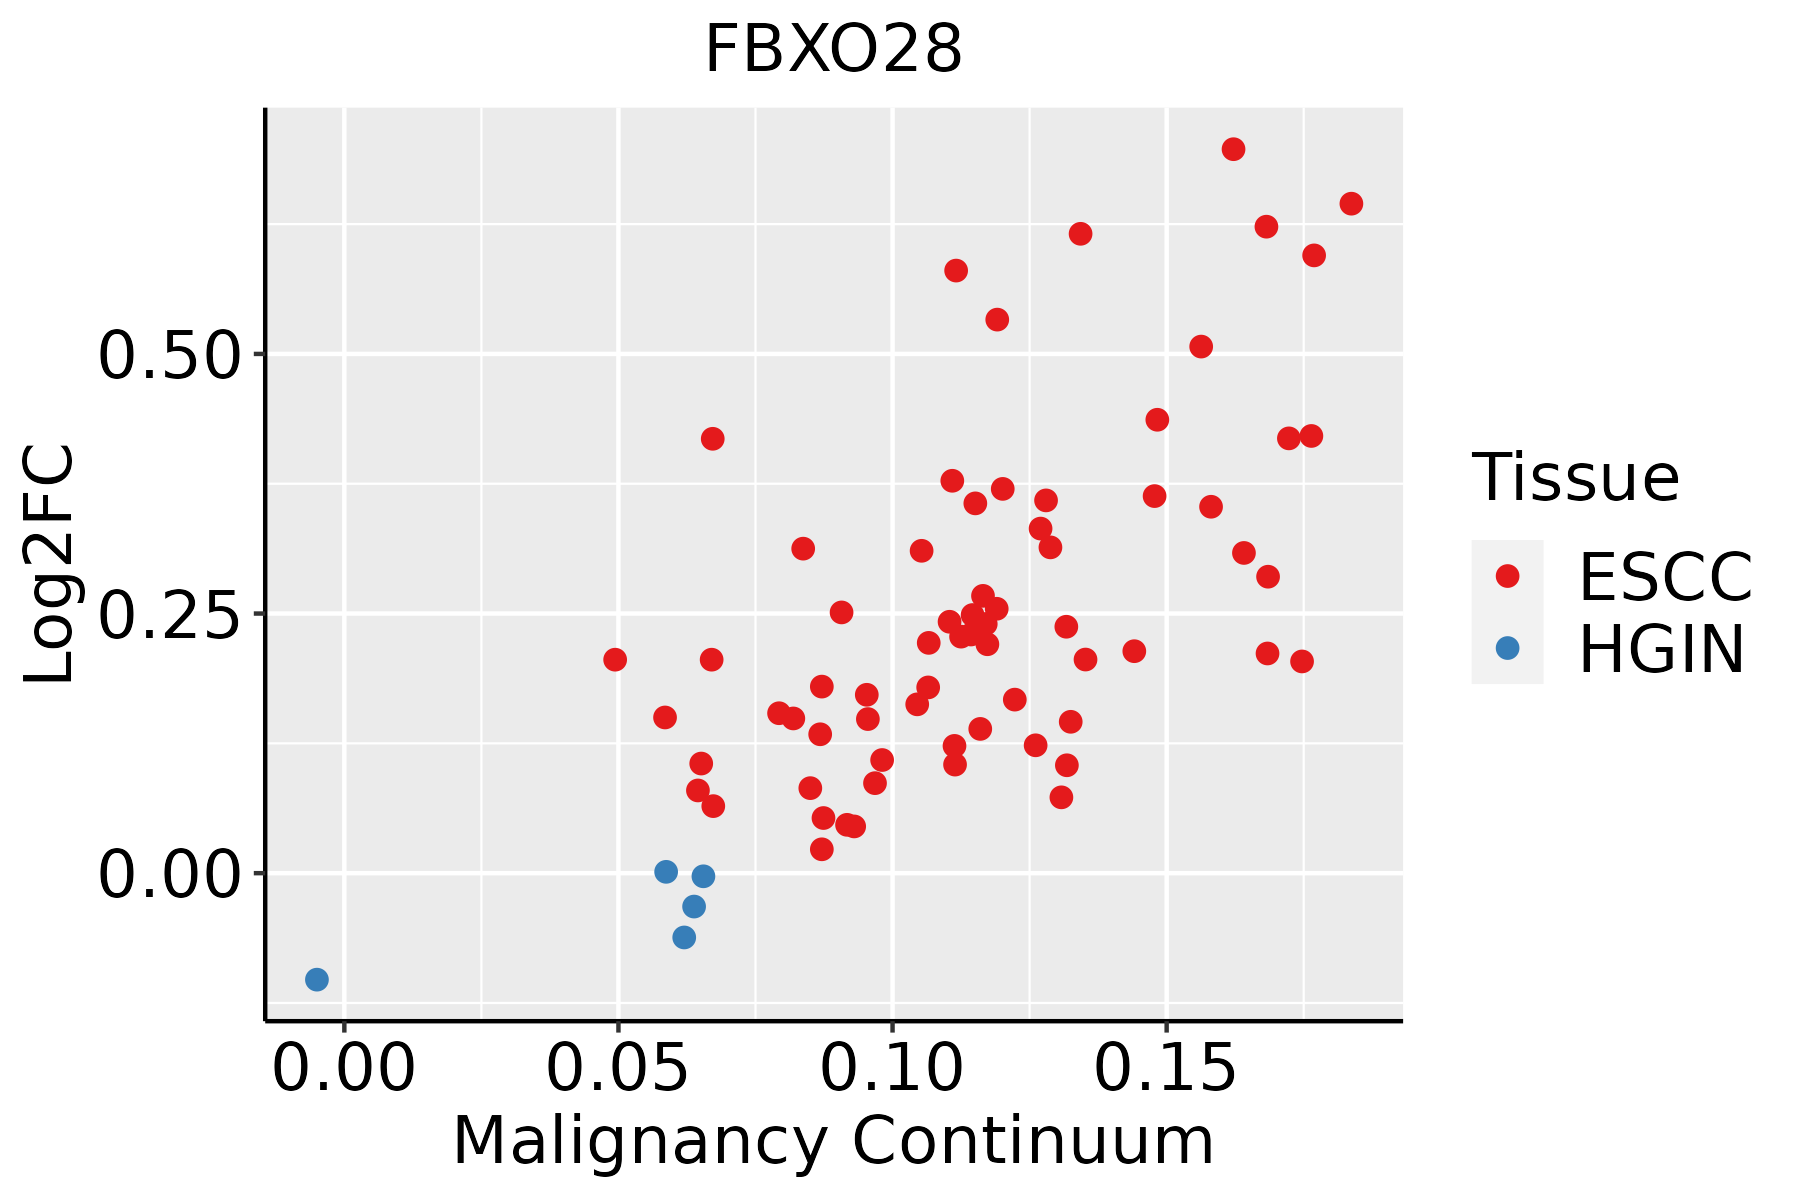 | ESCC: Esophageal squamous cell carcinoma |
| HGIN: High-grade intraepithelial neoplasias | ||
| LGIN: Low-grade intraepithelial neoplasias | ||
| Oral Cavity | 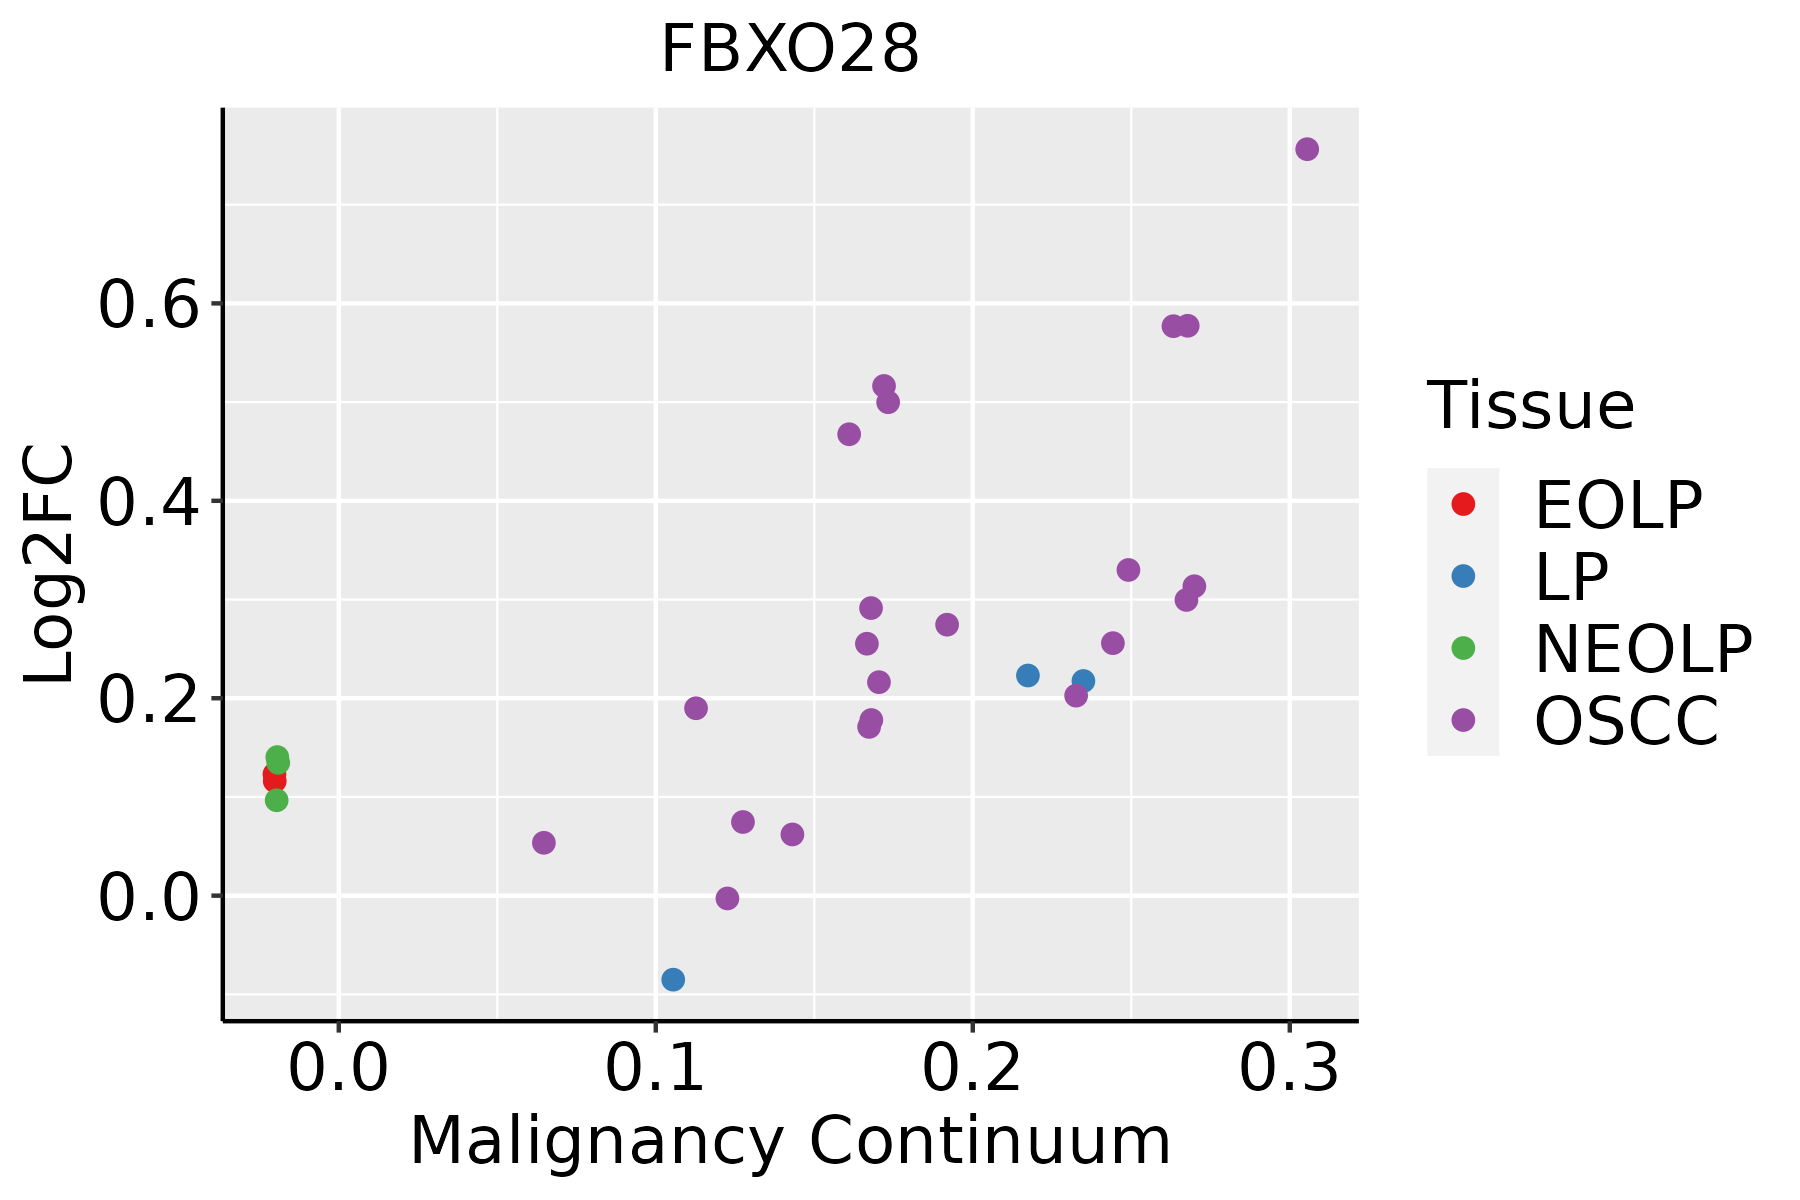 | EOLP: Erosive Oral lichen planus |
| LP: leukoplakia | ||
| NEOLP: Non-erosive oral lichen planus | ||
| OSCC: Oral squamous cell carcinoma |
| ∗log2FC in expression of this searched gene in stem-like cells from each diseased tissue sample relative to stem-like cells in normal samples in each tissue plotted against the malignancy continuum. Samples are colored based on if they are from different disease stage. |
Top |
Malignant transformation related pathway analysis |
| Find out the enriched GO biological processes and KEGG pathways involved in transition from healthy to precancer to cancer |
| Tissue | Disease Stage | Enriched GO biological Processes |
| Colorectum | AD |  |
| Colorectum | SER |  |
| Colorectum | MSS |  |
| Colorectum | MSI-H |  |
| Colorectum | FAP |  |
| ∗Top 15 enriched GO BP terms are showed in the bar plot of each disease state in each tissue. Each row represents a significant GO biological process which is colored according to the -log10(p.adjust). |
| Page: 1 2 3 4 5 6 7 8 9 |
| GO ID | Tissue | Disease Stage | Description | Gene Ratio | Bg Ratio | pvalue | p.adjust | Count |
| GO:00002097 | Cervix | CC | protein polyubiquitination | 58/2311 | 236/18723 | 1.57e-07 | 7.41e-06 | 58 |
| GO:000020917 | Esophagus | ESCC | protein polyubiquitination | 170/8552 | 236/18723 | 1.40e-16 | 1.09e-14 | 170 |
| GO:000020910 | Oral cavity | OSCC | protein polyubiquitination | 150/7305 | 236/18723 | 1.59e-14 | 9.27e-13 | 150 |
| Page: 1 |
| Pathway ID | Tissue | Disease Stage | Description | Gene Ratio | Bg Ratio | pvalue | p.adjust | qvalue | Count |
| Page: 1 |
Top |
Cell-cell communication analysis |
| Identification of potential cell-cell interactions between two cell types and their ligand-receptor pairs for different disease states |
| Ligand | Receptor | LRpair | Pathway | Tissue | Disease Stage |
| Page: 1 |
Top |
Single-cell gene regulatory network inference analysis |
| Find out the significant the regulons (TFs) and the target genes of each regulon across cell types for different disease states |
| TF | Cell Type | Tissue | Disease Stage | Target Gene | RSS | Regulon Activity |
| ∗The dot plots of a searched regulon are shown for all cell subpopulations in each disease state of each tissue based on the regulon specific score inferred using pySCENIC and by calculating the average expression. |
| Page: 1 |
Top |
Somatic mutation of malignant transformation related genes |
| Annotation of somatic variants for genes involved in malignant transformation |
| Hugo Symbol | Variant Class | Variant Classification | dbSNP RS | HGVSc | HGVSp | HGVSp Short | SWISSPROT | BIOTYPE | SIFT | PolyPhen | Tumor Sample Barcode | Tissue | Histology | Sex | Age | Stage | Therapy Types | Drugs | Outcome |
| FBXO28 | SNV | Missense_Mutation | c.692G>A | p.Arg231Lys | p.R231K | Q9NVF7 | protein_coding | tolerated(0.18) | probably_damaging(0.931) | TCGA-A8-A09G-01 | Breast | breast invasive carcinoma | Female | >=65 | III/IV | Unknown | Unknown | SD | |
| FBXO28 | SNV | Missense_Mutation | rs769544662 | c.965N>A | p.Arg322His | p.R322H | Q9NVF7 | protein_coding | tolerated(0.46) | benign(0) | TCGA-AN-A0AK-01 | Breast | breast invasive carcinoma | Female | >=65 | I/II | Unknown | Unknown | SD |
| FBXO28 | SNV | Missense_Mutation | c.330N>C | p.Glu110Asp | p.E110D | Q9NVF7 | protein_coding | tolerated(0.24) | possibly_damaging(0.899) | TCGA-BH-A0B3-01 | Breast | breast invasive carcinoma | Female | <65 | I/II | Chemotherapy | cyclophosphamide | SD | |
| FBXO28 | SNV | Missense_Mutation | c.38G>A | p.Gly13Glu | p.G13E | Q9NVF7 | protein_coding | deleterious_low_confidence(0) | benign(0.001) | TCGA-C8-A1HM-01 | Breast | breast invasive carcinoma | Female | >=65 | I/II | Chemotherapy | doxorubicin | CR | |
| FBXO28 | SNV | Missense_Mutation | c.1094N>A | p.Arg365Gln | p.R365Q | Q9NVF7 | protein_coding | deleterious_low_confidence(0.02) | benign(0.062) | TCGA-D8-A1JB-01 | Breast | breast invasive carcinoma | Female | <65 | I/II | Chemotherapy | adriamycin | SD | |
| FBXO28 | SNV | Missense_Mutation | novel | c.1003N>G | p.Ser335Ala | p.S335A | Q9NVF7 | protein_coding | tolerated(0.33) | benign(0.003) | TCGA-AA-3984-01 | Colorectum | colon adenocarcinoma | Female | <65 | I/II | Unknown | Unknown | SD |
| FBXO28 | SNV | Missense_Mutation | c.431C>T | p.Ala144Val | p.A144V | Q9NVF7 | protein_coding | deleterious(0.02) | probably_damaging(0.968) | TCGA-AZ-4615-01 | Colorectum | colon adenocarcinoma | Male | >=65 | III/IV | Chemotherapy | xeloda | PD | |
| FBXO28 | SNV | Missense_Mutation | c.76T>G | p.Ser26Ala | p.S26A | Q9NVF7 | protein_coding | tolerated_low_confidence(1) | benign(0) | TCGA-WS-AB45-01 | Colorectum | colon adenocarcinoma | Female | <65 | I/II | Unknown | Unknown | SD | |
| FBXO28 | SNV | Missense_Mutation | novel | c.587N>C | p.Val196Ala | p.V196A | Q9NVF7 | protein_coding | deleterious(0) | probably_damaging(0.956) | TCGA-AG-A00Y-01 | Colorectum | rectum adenocarcinoma | Male | >=65 | I/II | Unknown | Unknown | PD |
| FBXO28 | SNV | Missense_Mutation | novel | c.871G>A | p.Glu291Lys | p.E291K | Q9NVF7 | protein_coding | tolerated(0.12) | probably_damaging(0.971) | TCGA-F5-6814-01 | Colorectum | rectum adenocarcinoma | Male | <65 | I/II | Unknown | Unknown | SD |
| Page: 1 2 3 4 |
Top |
Related drugs of malignant transformation related genes |
| Identification of chemicals and drugs interact with genes involved in malignant transfromation |
| (DGIdb 4.0) |
| Entrez ID | Symbol | Category | Interaction Types | Drug Claim Name | Drug Name | PMIDs |
| Page: 1 |

Copyright 2023-Present -The University of Texas Health Science Center at Houston |