
|
|||||
|
 | |
| |
| |
| |
| |
| |
|
Gene: FBXO25 |
Gene summary for FBXO25 |
| Gene information | Species | Human | Gene symbol | FBXO25 | Gene ID | 26260 |
| Gene name | F-box protein 25 | |
| Gene Alias | FBX25 | |
| Cytomap | 8p23.3 | |
| Gene Type | protein-coding | GO ID | GO:0006464 | UniProtAcc | Q8TCJ0 |
Top |
Malignant transformation analysis |
| Identification of the aberrant gene expression in precancerous and cancerous lesions by comparing the gene expression of stem-like cells in diseased tissues with normal stem cells |
| Entrez ID | Symbol | Replicates | Species | Organ | Tissue | Adj P-value | Log2FC | Malignancy |
| 26260 | FBXO25 | LZE4T | Human | Esophagus | ESCC | 6.53e-04 | 9.85e-02 | 0.0811 |
| 26260 | FBXO25 | LZE8T | Human | Esophagus | ESCC | 8.37e-03 | 3.88e-02 | 0.067 |
| 26260 | FBXO25 | LZE24T | Human | Esophagus | ESCC | 6.80e-18 | 1.78e-01 | 0.0596 |
| 26260 | FBXO25 | P2T-E | Human | Esophagus | ESCC | 1.71e-15 | 1.93e-01 | 0.1177 |
| 26260 | FBXO25 | P4T-E | Human | Esophagus | ESCC | 2.69e-15 | 2.22e-01 | 0.1323 |
| 26260 | FBXO25 | P5T-E | Human | Esophagus | ESCC | 1.35e-05 | 8.73e-02 | 0.1327 |
| 26260 | FBXO25 | P8T-E | Human | Esophagus | ESCC | 2.75e-22 | 1.99e-01 | 0.0889 |
| 26260 | FBXO25 | P9T-E | Human | Esophagus | ESCC | 1.19e-15 | 1.21e-01 | 0.1131 |
| 26260 | FBXO25 | P10T-E | Human | Esophagus | ESCC | 7.68e-28 | 6.00e-01 | 0.116 |
| 26260 | FBXO25 | P12T-E | Human | Esophagus | ESCC | 2.00e-06 | 8.32e-02 | 0.1122 |
| 26260 | FBXO25 | P15T-E | Human | Esophagus | ESCC | 1.56e-02 | 2.87e-02 | 0.1149 |
| 26260 | FBXO25 | P16T-E | Human | Esophagus | ESCC | 1.62e-15 | 2.10e-01 | 0.1153 |
| 26260 | FBXO25 | P20T-E | Human | Esophagus | ESCC | 1.11e-08 | 4.59e-02 | 0.1124 |
| 26260 | FBXO25 | P21T-E | Human | Esophagus | ESCC | 5.07e-13 | 2.07e-01 | 0.1617 |
| 26260 | FBXO25 | P22T-E | Human | Esophagus | ESCC | 1.85e-16 | 1.67e-01 | 0.1236 |
| 26260 | FBXO25 | P23T-E | Human | Esophagus | ESCC | 6.46e-07 | 9.13e-02 | 0.108 |
| 26260 | FBXO25 | P24T-E | Human | Esophagus | ESCC | 3.05e-12 | 2.15e-01 | 0.1287 |
| 26260 | FBXO25 | P26T-E | Human | Esophagus | ESCC | 3.89e-11 | 1.14e-01 | 0.1276 |
| 26260 | FBXO25 | P27T-E | Human | Esophagus | ESCC | 3.65e-09 | 1.57e-01 | 0.1055 |
| 26260 | FBXO25 | P28T-E | Human | Esophagus | ESCC | 1.14e-14 | 3.83e-01 | 0.1149 |
| Page: 1 2 3 4 5 |
| Tissue | Expression Dynamics | Abbreviation |
| Esophagus |  | ESCC: Esophageal squamous cell carcinoma |
| HGIN: High-grade intraepithelial neoplasias | ||
| LGIN: Low-grade intraepithelial neoplasias | ||
| Liver | 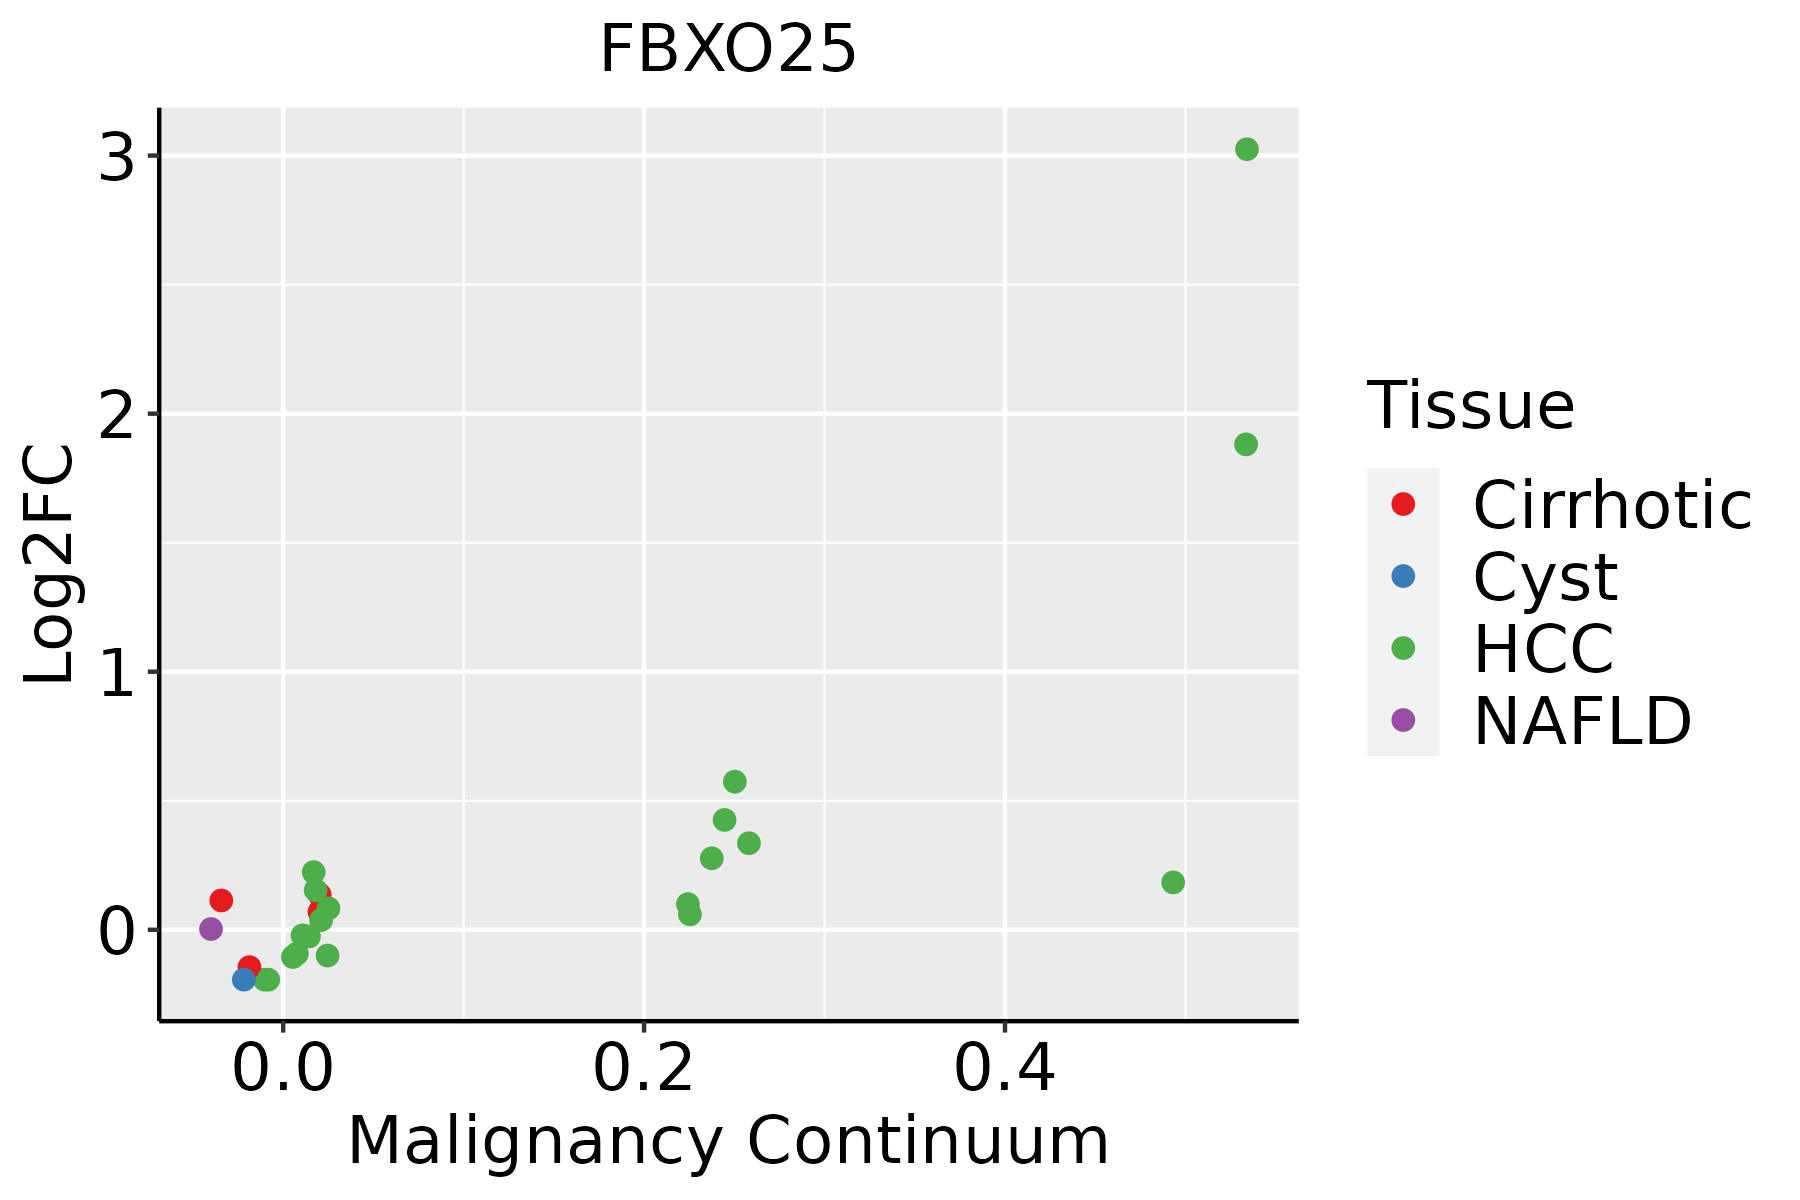 | HCC: Hepatocellular carcinoma |
| NAFLD: Non-alcoholic fatty liver disease | ||
| Oral Cavity | 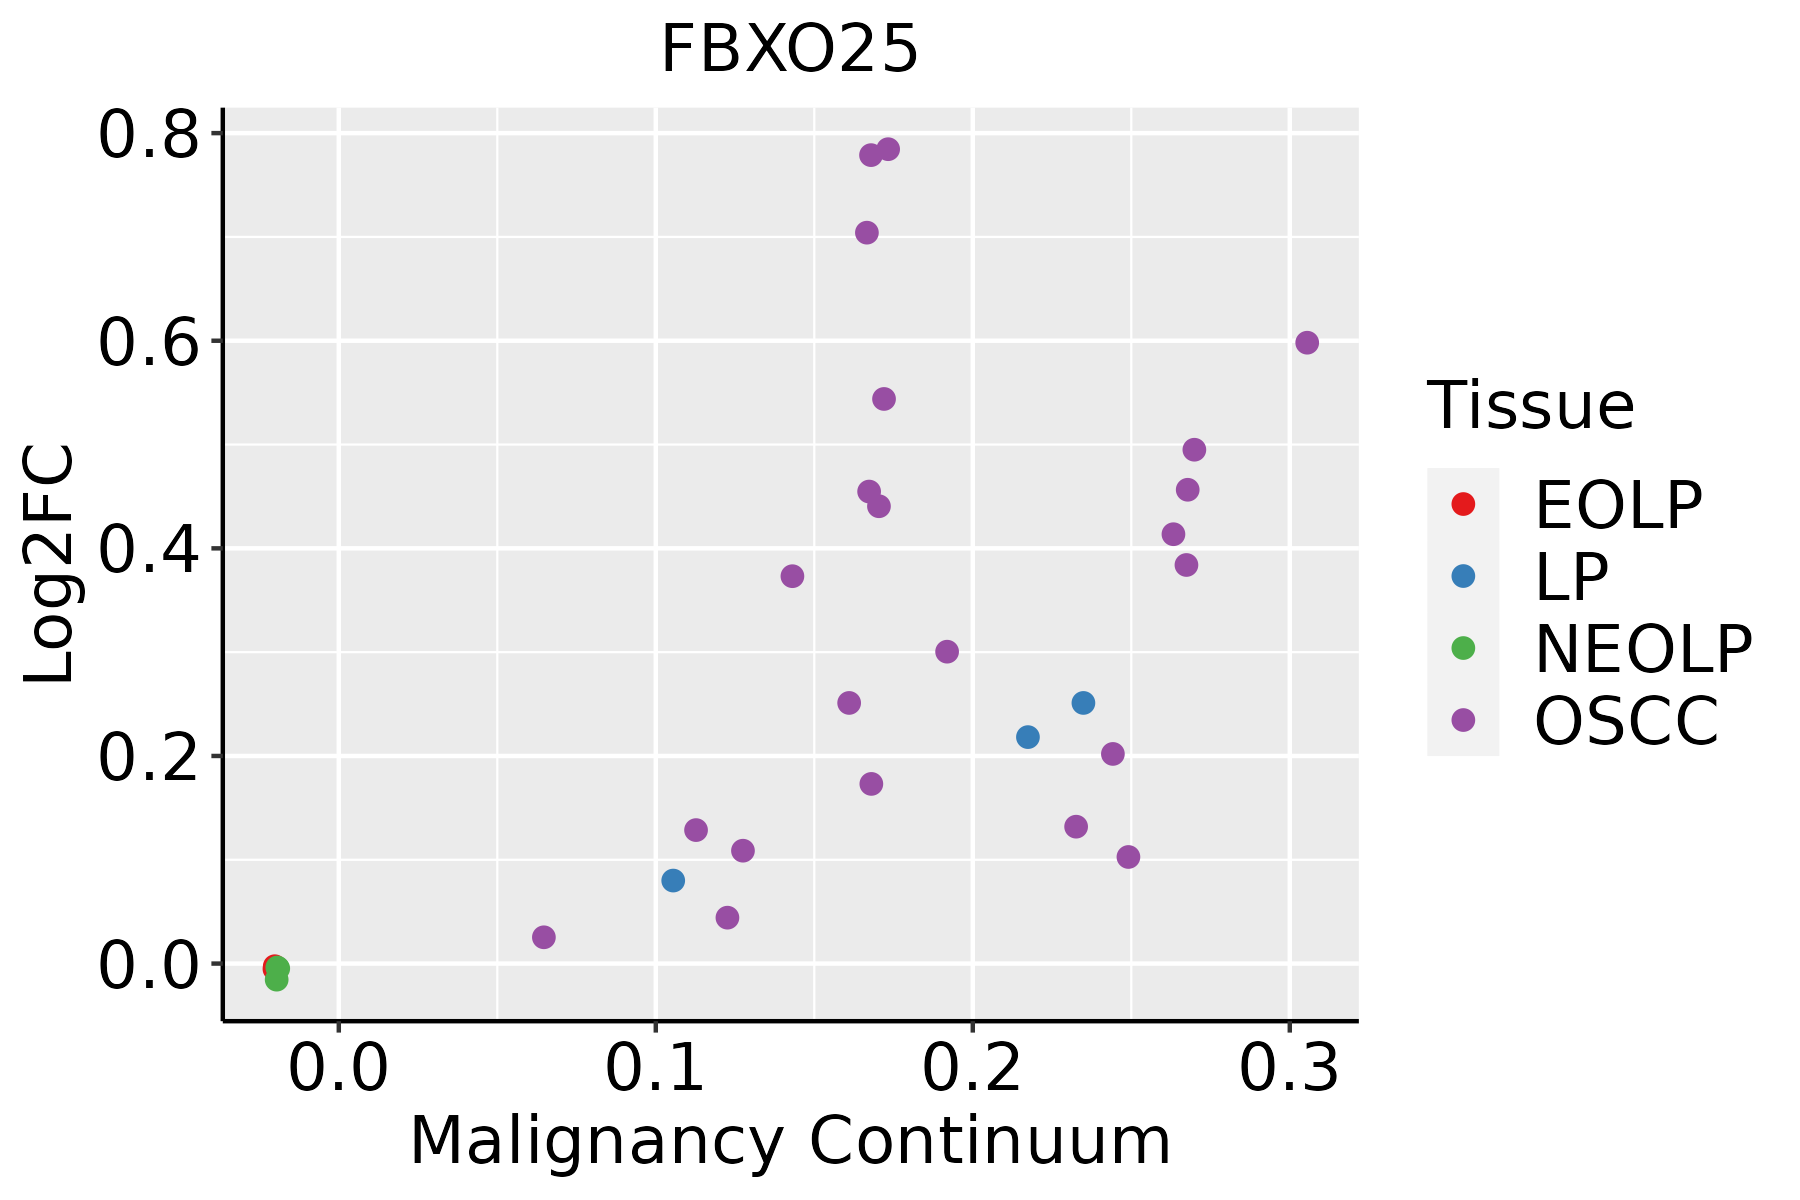 | EOLP: Erosive Oral lichen planus |
| LP: leukoplakia | ||
| NEOLP: Non-erosive oral lichen planus | ||
| OSCC: Oral squamous cell carcinoma | ||
| Prostate | 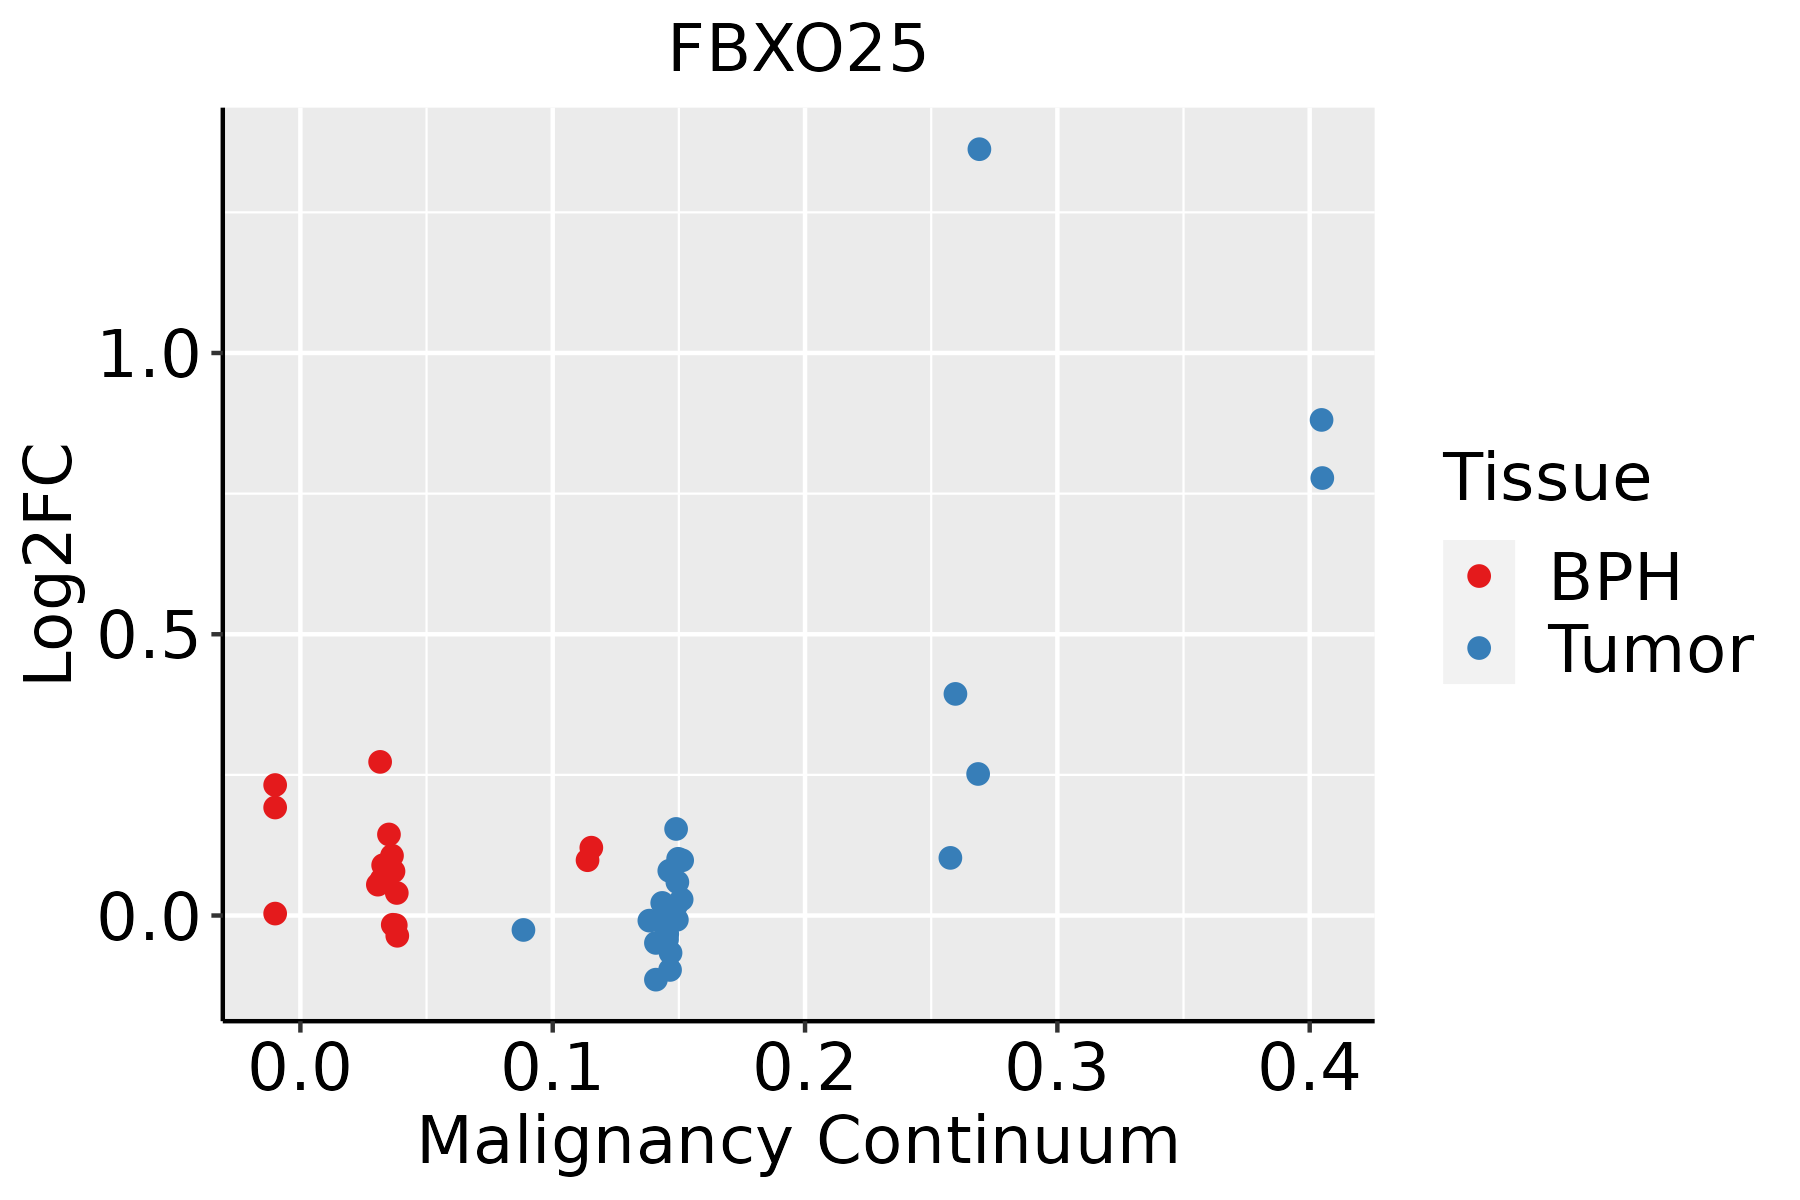 | BPH: Benign Prostatic Hyperplasia |
| Skin | 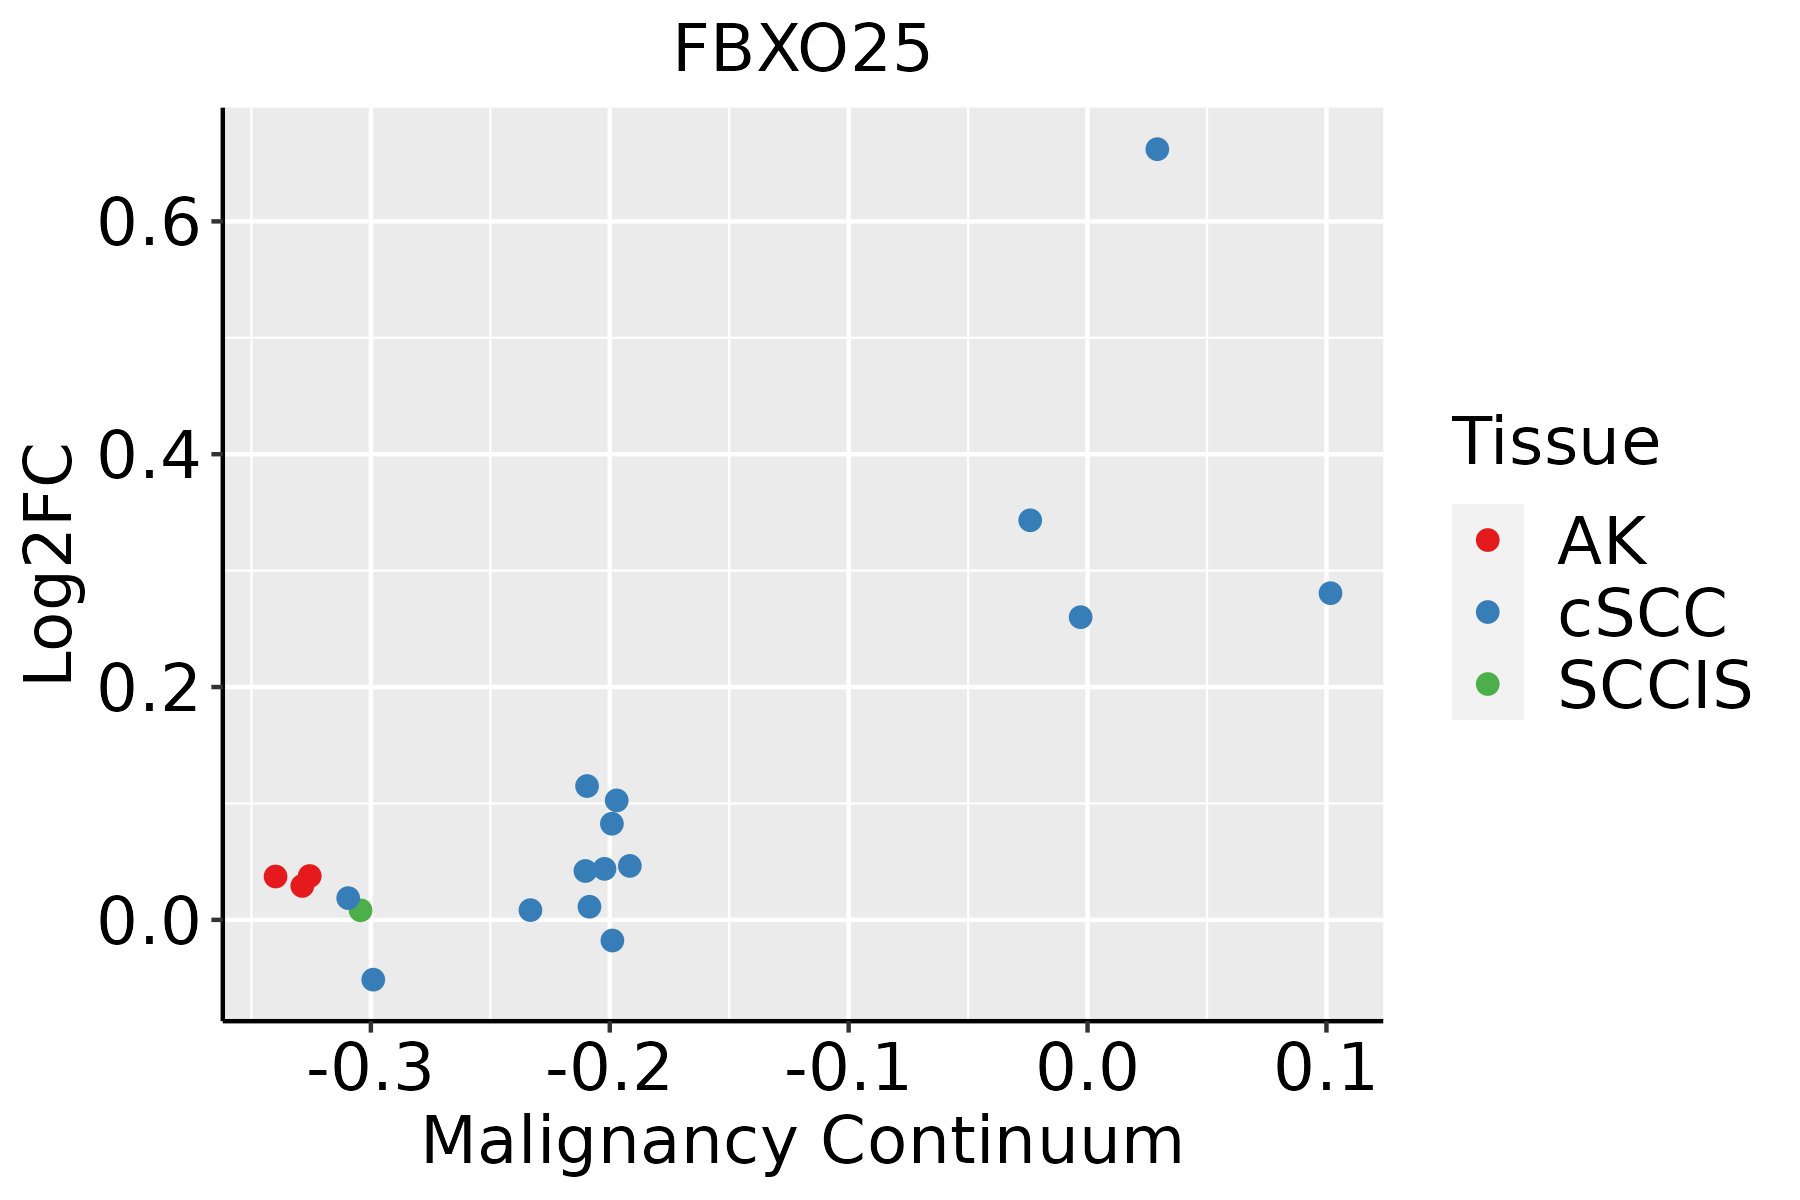 | AK: Actinic keratosis |
| cSCC: Cutaneous squamous cell carcinoma | ||
| SCCIS:squamous cell carcinoma in situ | ||
| Thyroid | 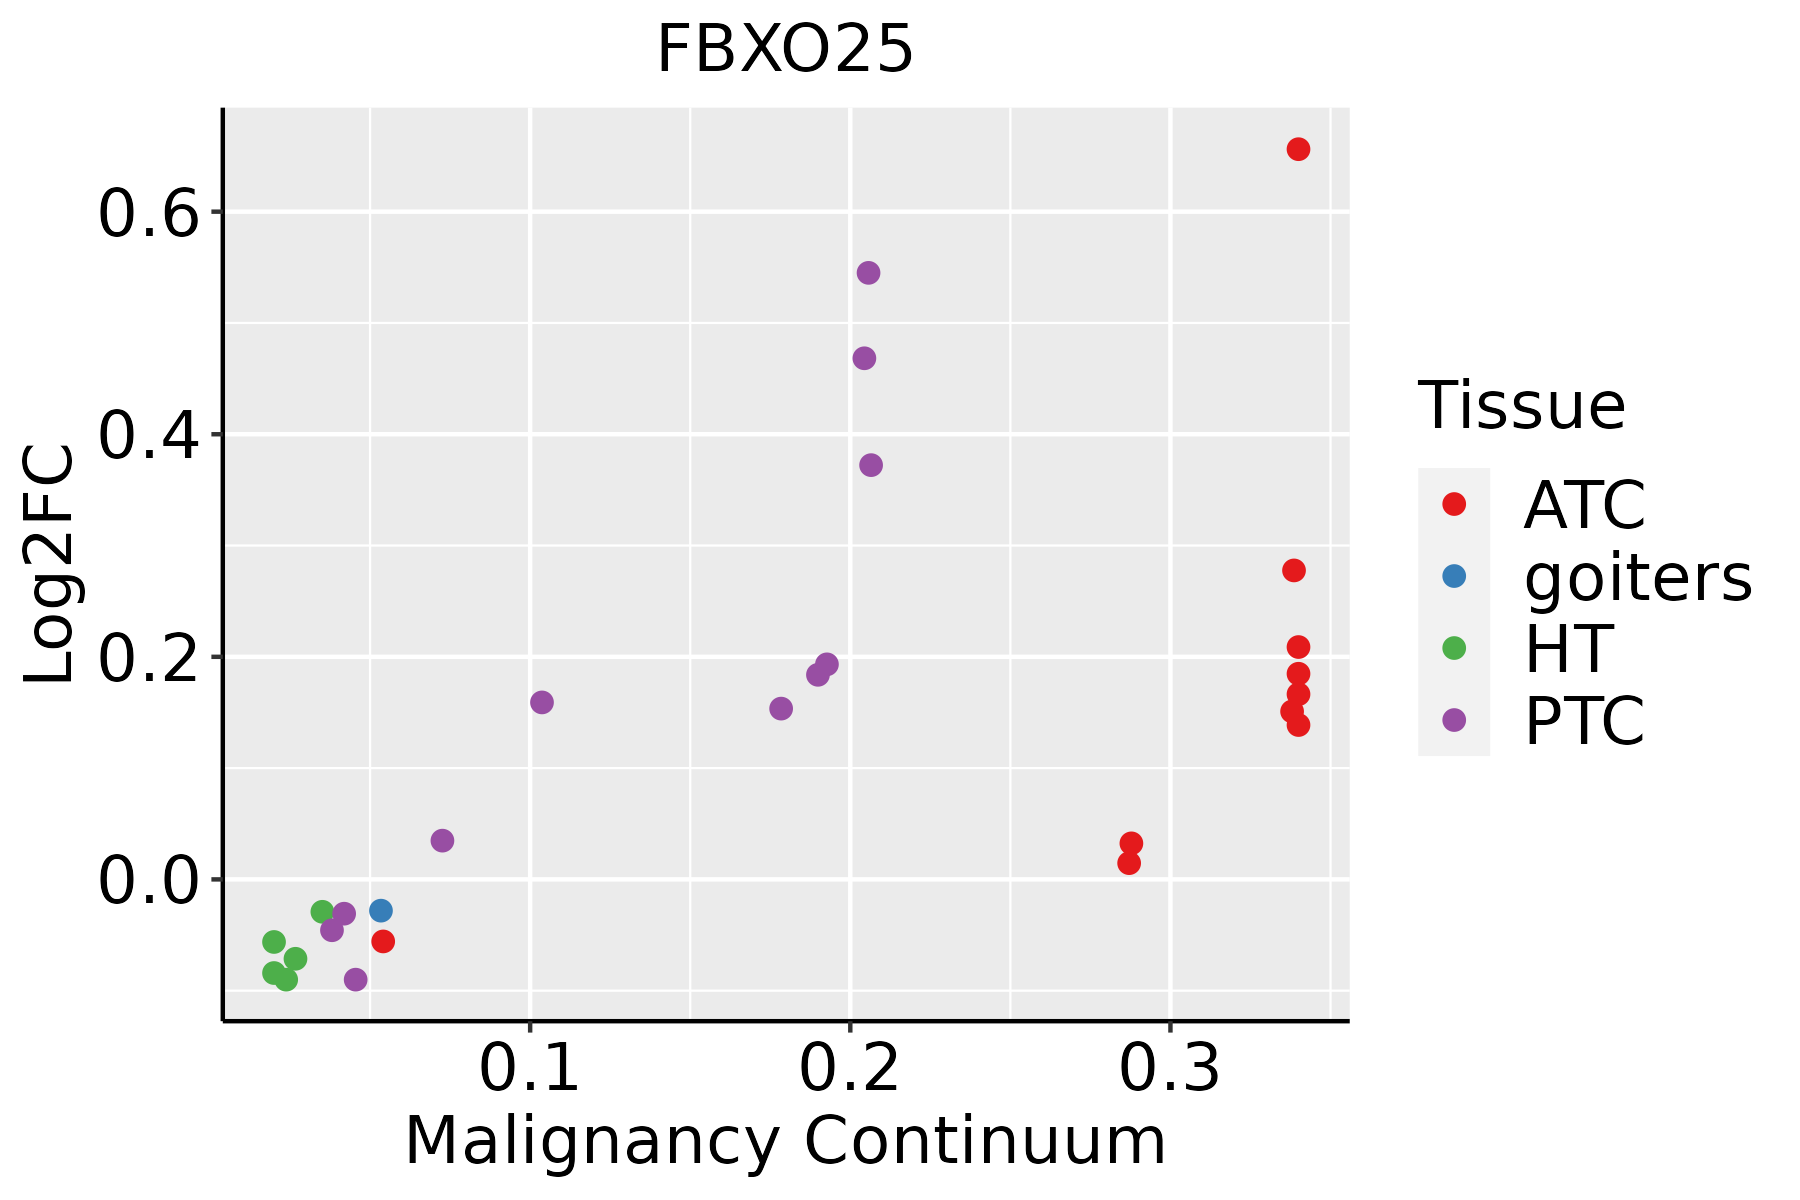 | ATC: Anaplastic thyroid cancer |
| HT: Hashimoto's thyroiditis | ||
| PTC: Papillary thyroid cancer |
| ∗log2FC in expression of this searched gene in stem-like cells from each diseased tissue sample relative to stem-like cells in normal samples in each tissue plotted against the malignancy continuum. Samples are colored based on if they are from different disease stage. |
Top |
Malignant transformation related pathway analysis |
| Find out the enriched GO biological processes and KEGG pathways involved in transition from healthy to precancer to cancer |
| Tissue | Disease Stage | Enriched GO biological Processes |
| Colorectum | AD |  |
| Colorectum | SER |  |
| Colorectum | MSS |  |
| Colorectum | MSI-H |  |
| Colorectum | FAP |  |
| ∗Top 15 enriched GO BP terms are showed in the bar plot of each disease state in each tissue. Each row represents a significant GO biological process which is colored according to the -log10(p.adjust). |
| Page: 1 2 3 4 5 6 7 8 9 |
| GO ID | Tissue | Disease Stage | Description | Gene Ratio | Bg Ratio | pvalue | p.adjust | Count |
| Page: 1 |
| Pathway ID | Tissue | Disease Stage | Description | Gene Ratio | Bg Ratio | pvalue | p.adjust | qvalue | Count |
| hsa040689 | Esophagus | ESCC | FoxO signaling pathway | 89/4205 | 131/8465 | 1.56e-05 | 7.98e-05 | 4.09e-05 | 89 |
| hsa0406814 | Esophagus | ESCC | FoxO signaling pathway | 89/4205 | 131/8465 | 1.56e-05 | 7.98e-05 | 4.09e-05 | 89 |
| hsa040682 | Liver | Cirrhotic | FoxO signaling pathway | 52/2530 | 131/8465 | 9.98e-03 | 3.32e-02 | 2.05e-02 | 52 |
| hsa040683 | Liver | Cirrhotic | FoxO signaling pathway | 52/2530 | 131/8465 | 9.98e-03 | 3.32e-02 | 2.05e-02 | 52 |
| hsa040684 | Liver | HCC | FoxO signaling pathway | 85/4020 | 131/8465 | 3.99e-05 | 2.16e-04 | 1.20e-04 | 85 |
| hsa040685 | Liver | HCC | FoxO signaling pathway | 85/4020 | 131/8465 | 3.99e-05 | 2.16e-04 | 1.20e-04 | 85 |
| hsa040688 | Oral cavity | OSCC | FoxO signaling pathway | 85/3704 | 131/8465 | 7.50e-07 | 4.33e-06 | 2.21e-06 | 85 |
| hsa0406813 | Oral cavity | OSCC | FoxO signaling pathway | 85/3704 | 131/8465 | 7.50e-07 | 4.33e-06 | 2.21e-06 | 85 |
| hsa040687 | Prostate | BPH | FoxO signaling pathway | 54/1718 | 131/8465 | 3.05e-08 | 3.59e-07 | 2.22e-07 | 54 |
| hsa0406812 | Prostate | BPH | FoxO signaling pathway | 54/1718 | 131/8465 | 3.05e-08 | 3.59e-07 | 2.22e-07 | 54 |
| hsa0406822 | Prostate | Tumor | FoxO signaling pathway | 54/1791 | 131/8465 | 1.32e-07 | 1.51e-06 | 9.36e-07 | 54 |
| hsa0406832 | Prostate | Tumor | FoxO signaling pathway | 54/1791 | 131/8465 | 1.32e-07 | 1.51e-06 | 9.36e-07 | 54 |
| Page: 1 |
Top |
Cell-cell communication analysis |
| Identification of potential cell-cell interactions between two cell types and their ligand-receptor pairs for different disease states |
| Ligand | Receptor | LRpair | Pathway | Tissue | Disease Stage |
| Page: 1 |
Top |
Single-cell gene regulatory network inference analysis |
| Find out the significant the regulons (TFs) and the target genes of each regulon across cell types for different disease states |
| TF | Cell Type | Tissue | Disease Stage | Target Gene | RSS | Regulon Activity |
| ∗The dot plots of a searched regulon are shown for all cell subpopulations in each disease state of each tissue based on the regulon specific score inferred using pySCENIC and by calculating the average expression. |
| Page: 1 |
Top |
Somatic mutation of malignant transformation related genes |
| Annotation of somatic variants for genes involved in malignant transformation |
| Hugo Symbol | Variant Class | Variant Classification | dbSNP RS | HGVSc | HGVSp | HGVSp Short | SWISSPROT | BIOTYPE | SIFT | PolyPhen | Tumor Sample Barcode | Tissue | Histology | Sex | Age | Stage | Therapy Types | Drugs | Outcome |
| FBXO25 | SNV | Missense_Mutation | novel | c.1028C>G | p.Pro343Arg | p.P343R | Q8TCJ0 | protein_coding | deleterious(0) | probably_damaging(1) | TCGA-AC-A6IX-01 | Breast | breast invasive carcinoma | Female | <65 | III/IV | Unknown | Unknown | SD |
| FBXO25 | SNV | Missense_Mutation | novel | c.988G>T | p.Asp330Tyr | p.D330Y | Q8TCJ0 | protein_coding | deleterious(0.02) | possibly_damaging(0.875) | TCGA-AQ-A54N-01 | Breast | breast invasive carcinoma | Female | <65 | I/II | Unknown | Unknown | SD |
| FBXO25 | SNV | Missense_Mutation | rs374460400 | c.616A>G | p.Ile206Val | p.I206V | Q8TCJ0 | protein_coding | tolerated(0.14) | benign(0.02) | TCGA-BH-A0BO-01 | Breast | breast invasive carcinoma | Female | <65 | I/II | Unknown | Unknown | SD |
| FBXO25 | SNV | Missense_Mutation | rs756484956 | c.961N>T | p.Arg321Trp | p.R321W | Q8TCJ0 | protein_coding | deleterious(0) | probably_damaging(0.949) | TCGA-C8-A1HG-01 | Breast | breast invasive carcinoma | Female | <65 | I/II | Unknown | Unknown | SD |
| FBXO25 | SNV | Missense_Mutation | rs761289056 | c.736N>A | p.Gly246Arg | p.G246R | Q8TCJ0 | protein_coding | tolerated(0.07) | probably_damaging(0.927) | TCGA-2W-A8YY-01 | Cervix | cervical & endocervical cancer | Female | <65 | I/II | Chemotherapy | cisplatin | CR |
| FBXO25 | SNV | Missense_Mutation | c.469N>G | p.Gln157Glu | p.Q157E | Q8TCJ0 | protein_coding | tolerated(0.27) | benign(0.117) | TCGA-DS-A0VN-01 | Cervix | cervical & endocervical cancer | Female | <65 | I/II | Chemotherapy | cisplatin | SD | |
| FBXO25 | SNV | Missense_Mutation | c.1087G>A | p.Asp363Asn | p.D363N | Q8TCJ0 | protein_coding | tolerated(0.63) | probably_damaging(0.999) | TCGA-A6-5661-01 | Colorectum | colon adenocarcinoma | Female | >=65 | I/II | Unknown | Unknown | SD | |
| FBXO25 | SNV | Missense_Mutation | c.833N>A | p.Ala278Asp | p.A278D | Q8TCJ0 | protein_coding | deleterious(0.01) | possibly_damaging(0.561) | TCGA-A6-6780-01 | Colorectum | colon adenocarcinoma | Male | >=65 | I/II | Unknown | Unknown | SD | |
| FBXO25 | SNV | Missense_Mutation | rs770759492 | c.31N>T | p.Pro11Ser | p.P11S | Q8TCJ0 | protein_coding | deleterious(0) | probably_damaging(0.999) | TCGA-AA-3511-01 | Colorectum | colon adenocarcinoma | Male | <65 | I/II | Unknown | Unknown | PD |
| FBXO25 | insertion | In_Frame_Ins | novel | c.918_919insAATATTAGG | p.His306_Tyr307insAsnIleArg | p.H306_Y307insNIR | Q8TCJ0 | protein_coding | TCGA-AM-5820-01 | Colorectum | colon adenocarcinoma | Female | <65 | I/II | Unknown | Unknown | SD |
| Page: 1 2 3 4 |
Top |
Related drugs of malignant transformation related genes |
| Identification of chemicals and drugs interact with genes involved in malignant transfromation |
| (DGIdb 4.0) |
| Entrez ID | Symbol | Category | Interaction Types | Drug Claim Name | Drug Name | PMIDs |
| Page: 1 |

Copyright 2023-Present -The University of Texas Health Science Center at Houston |