
|
|||||
|
 | |
| |
| |
| |
| |
| |
|
Gene: FBXO21 |
Gene summary for FBXO21 |
| Gene information | Species | Human | Gene symbol | FBXO21 | Gene ID | 23014 |
| Gene name | F-box protein 21 | |
| Gene Alias | FBX21 | |
| Cytomap | 12q24.22 | |
| Gene Type | protein-coding | GO ID | GO:0006464 | UniProtAcc | A0A024RBL8 |
Top |
Malignant transformation analysis |
| Identification of the aberrant gene expression in precancerous and cancerous lesions by comparing the gene expression of stem-like cells in diseased tissues with normal stem cells |
| Entrez ID | Symbol | Replicates | Species | Organ | Tissue | Adj P-value | Log2FC | Malignancy |
| 23014 | FBXO21 | LZE4T | Human | Esophagus | ESCC | 5.66e-12 | 2.85e-01 | 0.0811 |
| 23014 | FBXO21 | LZE7T | Human | Esophagus | ESCC | 5.10e-10 | 5.87e-01 | 0.0667 |
| 23014 | FBXO21 | LZE8T | Human | Esophagus | ESCC | 1.10e-10 | 4.30e-01 | 0.067 |
| 23014 | FBXO21 | LZE20T | Human | Esophagus | ESCC | 1.42e-04 | 1.43e-01 | 0.0662 |
| 23014 | FBXO21 | LZE22D1 | Human | Esophagus | HGIN | 2.78e-03 | 1.87e-01 | 0.0595 |
| 23014 | FBXO21 | LZE22T | Human | Esophagus | ESCC | 5.80e-07 | 4.04e-01 | 0.068 |
| 23014 | FBXO21 | LZE24T | Human | Esophagus | ESCC | 1.01e-14 | 5.32e-01 | 0.0596 |
| 23014 | FBXO21 | LZE21T | Human | Esophagus | ESCC | 1.33e-03 | 2.36e-01 | 0.0655 |
| 23014 | FBXO21 | P1T-E | Human | Esophagus | ESCC | 9.71e-03 | 4.24e-01 | 0.0875 |
| 23014 | FBXO21 | P2T-E | Human | Esophagus | ESCC | 8.90e-83 | 1.20e+00 | 0.1177 |
| 23014 | FBXO21 | P4T-E | Human | Esophagus | ESCC | 3.83e-34 | 9.10e-01 | 0.1323 |
| 23014 | FBXO21 | P5T-E | Human | Esophagus | ESCC | 3.31e-12 | 3.12e-01 | 0.1327 |
| 23014 | FBXO21 | P8T-E | Human | Esophagus | ESCC | 7.46e-30 | 5.87e-01 | 0.0889 |
| 23014 | FBXO21 | P9T-E | Human | Esophagus | ESCC | 2.45e-11 | 2.58e-01 | 0.1131 |
| 23014 | FBXO21 | P10T-E | Human | Esophagus | ESCC | 1.82e-26 | 5.49e-01 | 0.116 |
| 23014 | FBXO21 | P11T-E | Human | Esophagus | ESCC | 4.32e-13 | 5.66e-01 | 0.1426 |
| 23014 | FBXO21 | P12T-E | Human | Esophagus | ESCC | 2.39e-25 | 5.94e-01 | 0.1122 |
| 23014 | FBXO21 | P15T-E | Human | Esophagus | ESCC | 5.58e-27 | 6.04e-01 | 0.1149 |
| 23014 | FBXO21 | P16T-E | Human | Esophagus | ESCC | 2.76e-29 | 6.46e-01 | 0.1153 |
| 23014 | FBXO21 | P17T-E | Human | Esophagus | ESCC | 4.73e-11 | 3.43e-01 | 0.1278 |
| Page: 1 2 3 4 5 6 |
| Tissue | Expression Dynamics | Abbreviation |
| Esophagus |  | ESCC: Esophageal squamous cell carcinoma |
| HGIN: High-grade intraepithelial neoplasias | ||
| LGIN: Low-grade intraepithelial neoplasias | ||
| Liver |  | HCC: Hepatocellular carcinoma |
| NAFLD: Non-alcoholic fatty liver disease | ||
| Oral Cavity | 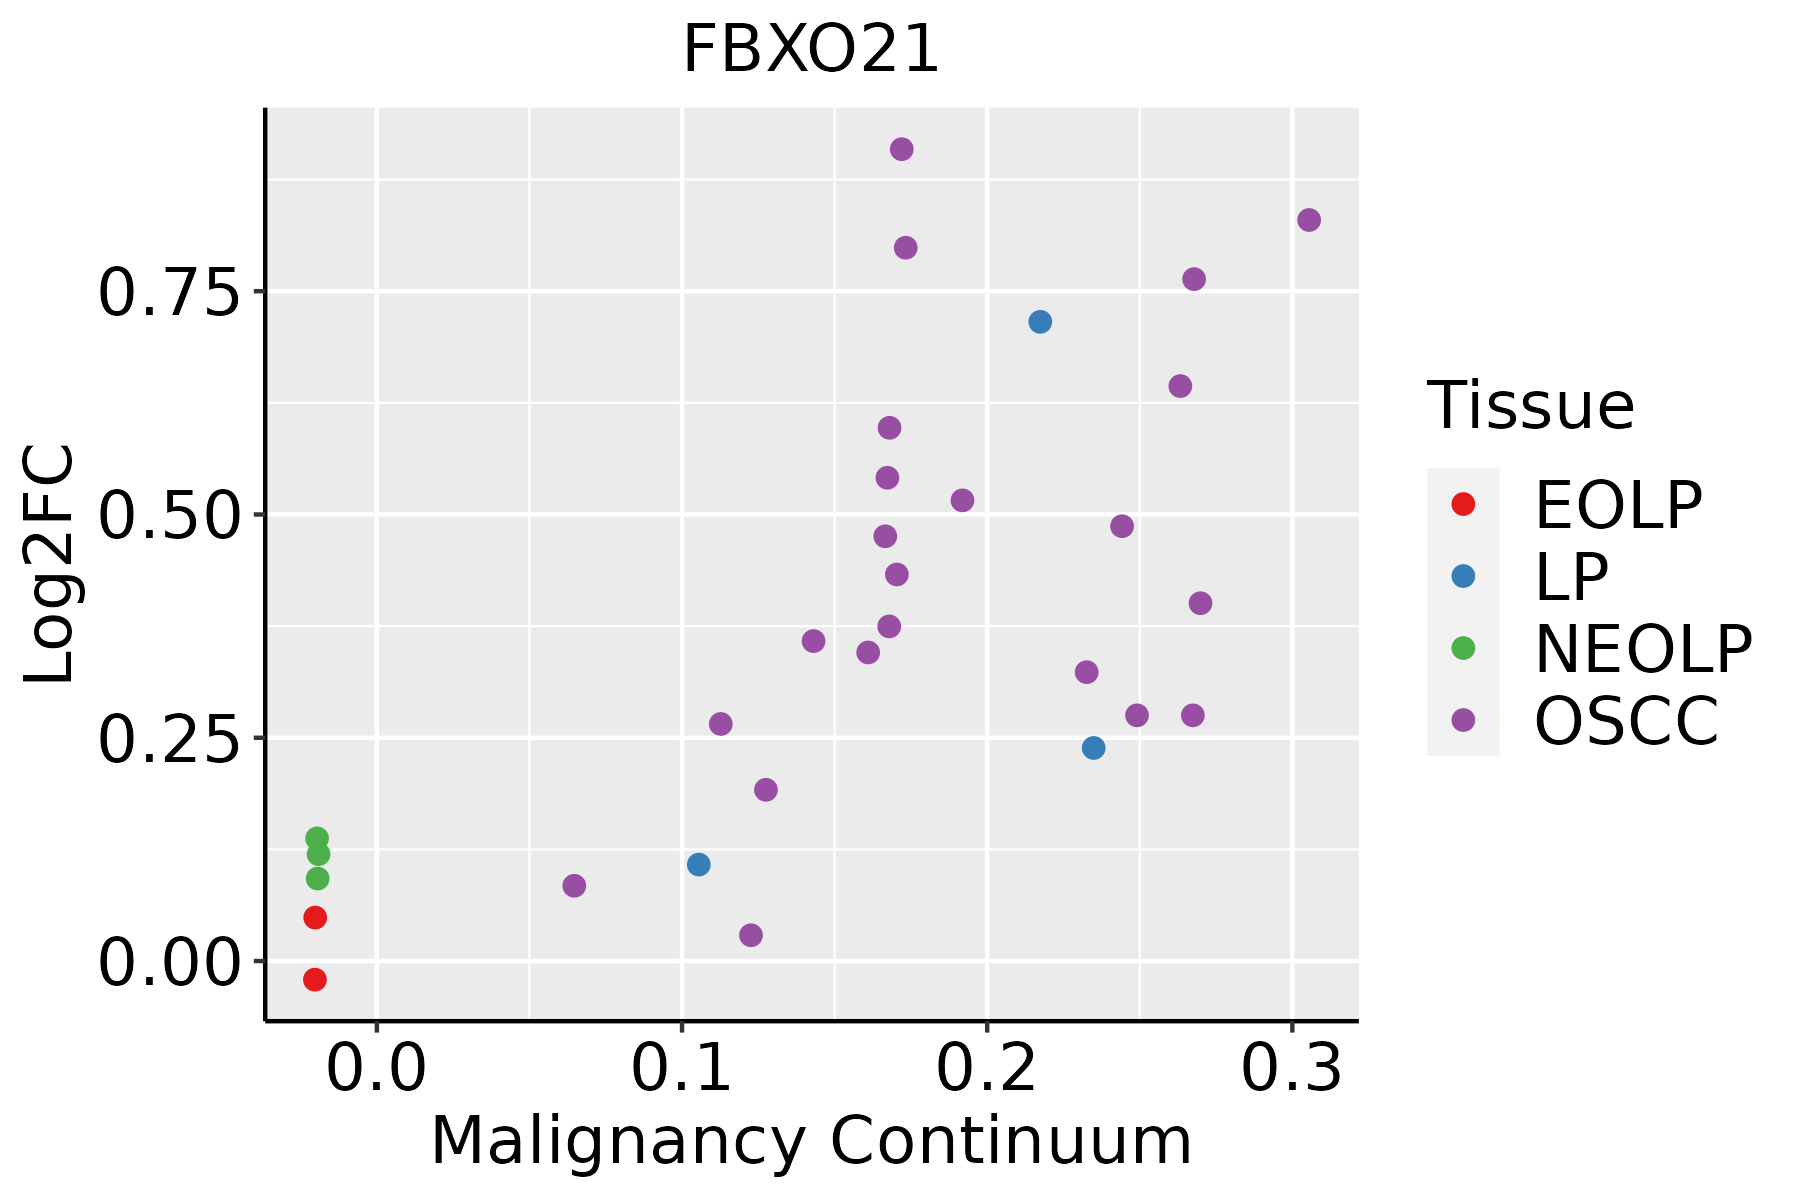 | EOLP: Erosive Oral lichen planus |
| LP: leukoplakia | ||
| NEOLP: Non-erosive oral lichen planus | ||
| OSCC: Oral squamous cell carcinoma | ||
| Skin | 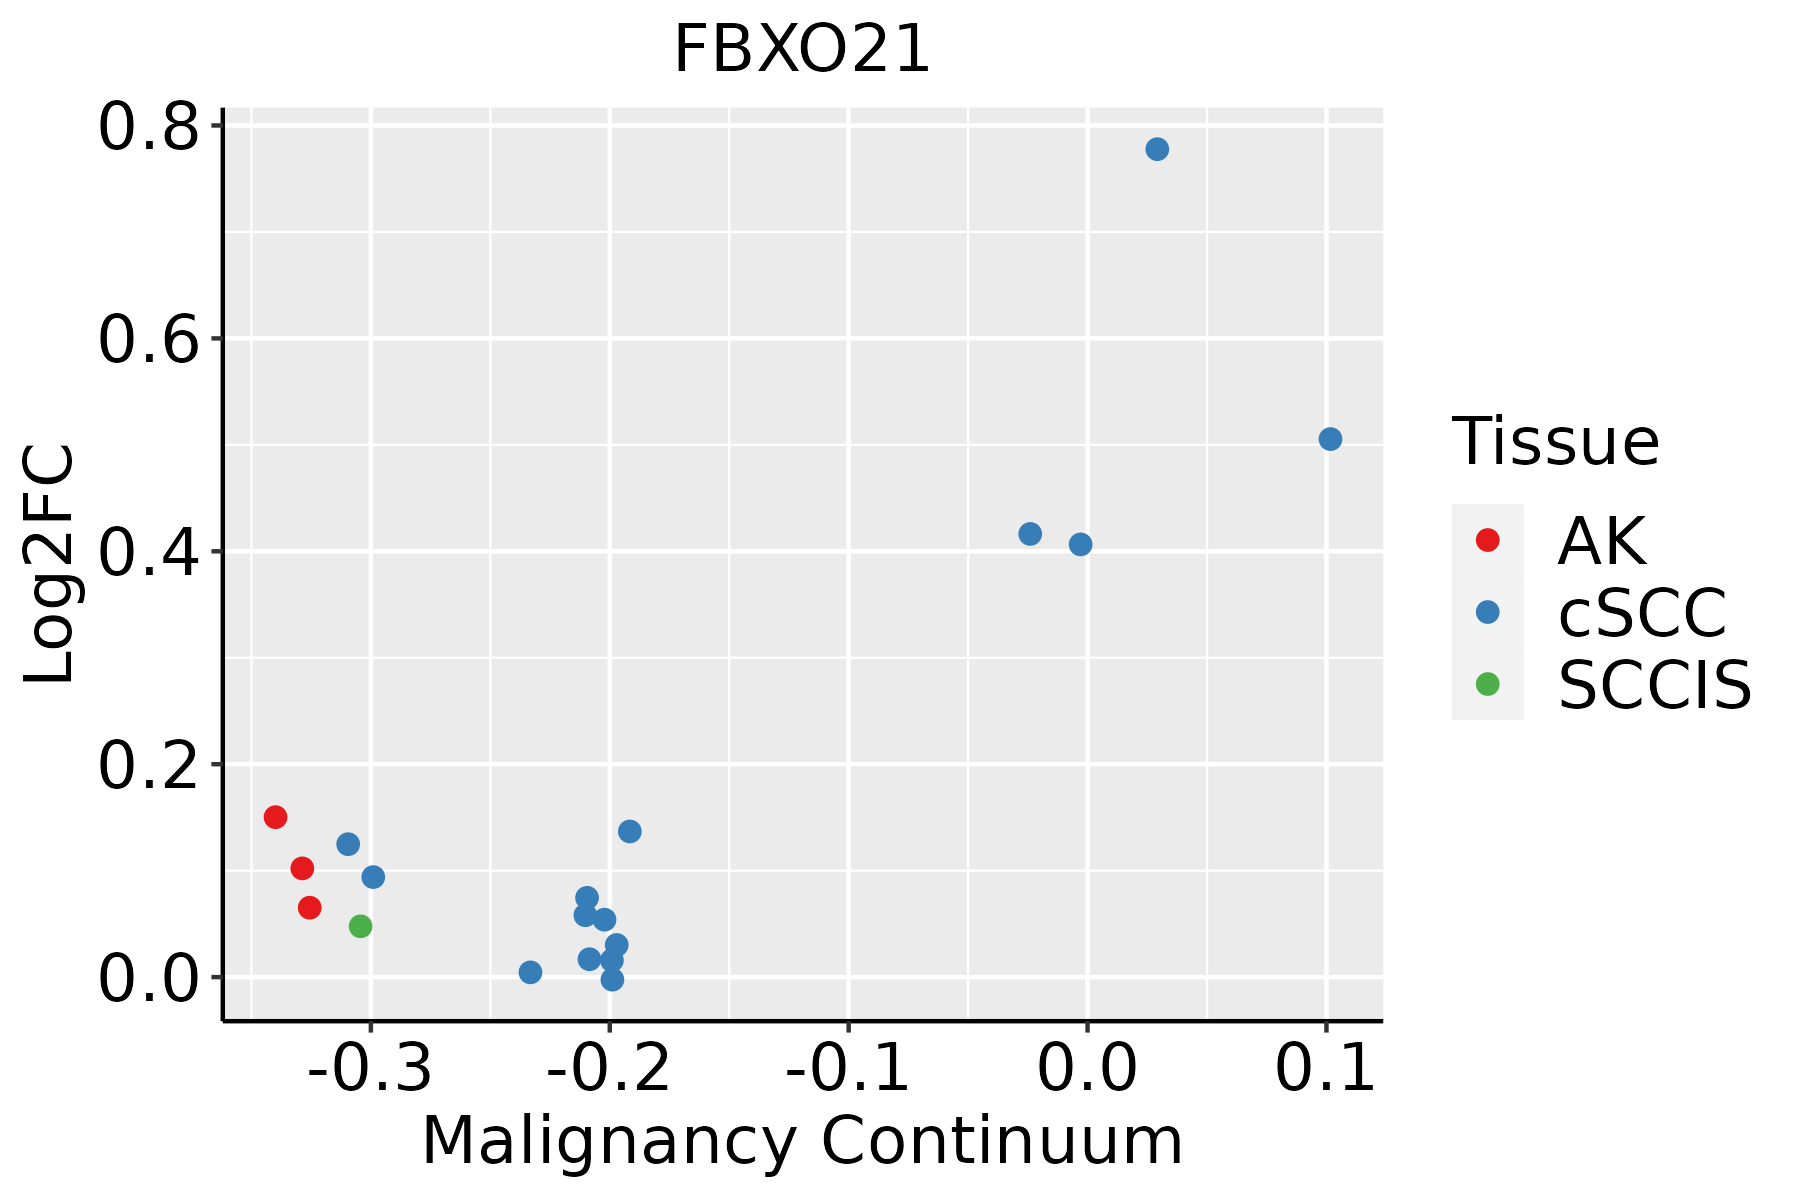 | AK: Actinic keratosis |
| cSCC: Cutaneous squamous cell carcinoma | ||
| SCCIS:squamous cell carcinoma in situ | ||
| Thyroid | 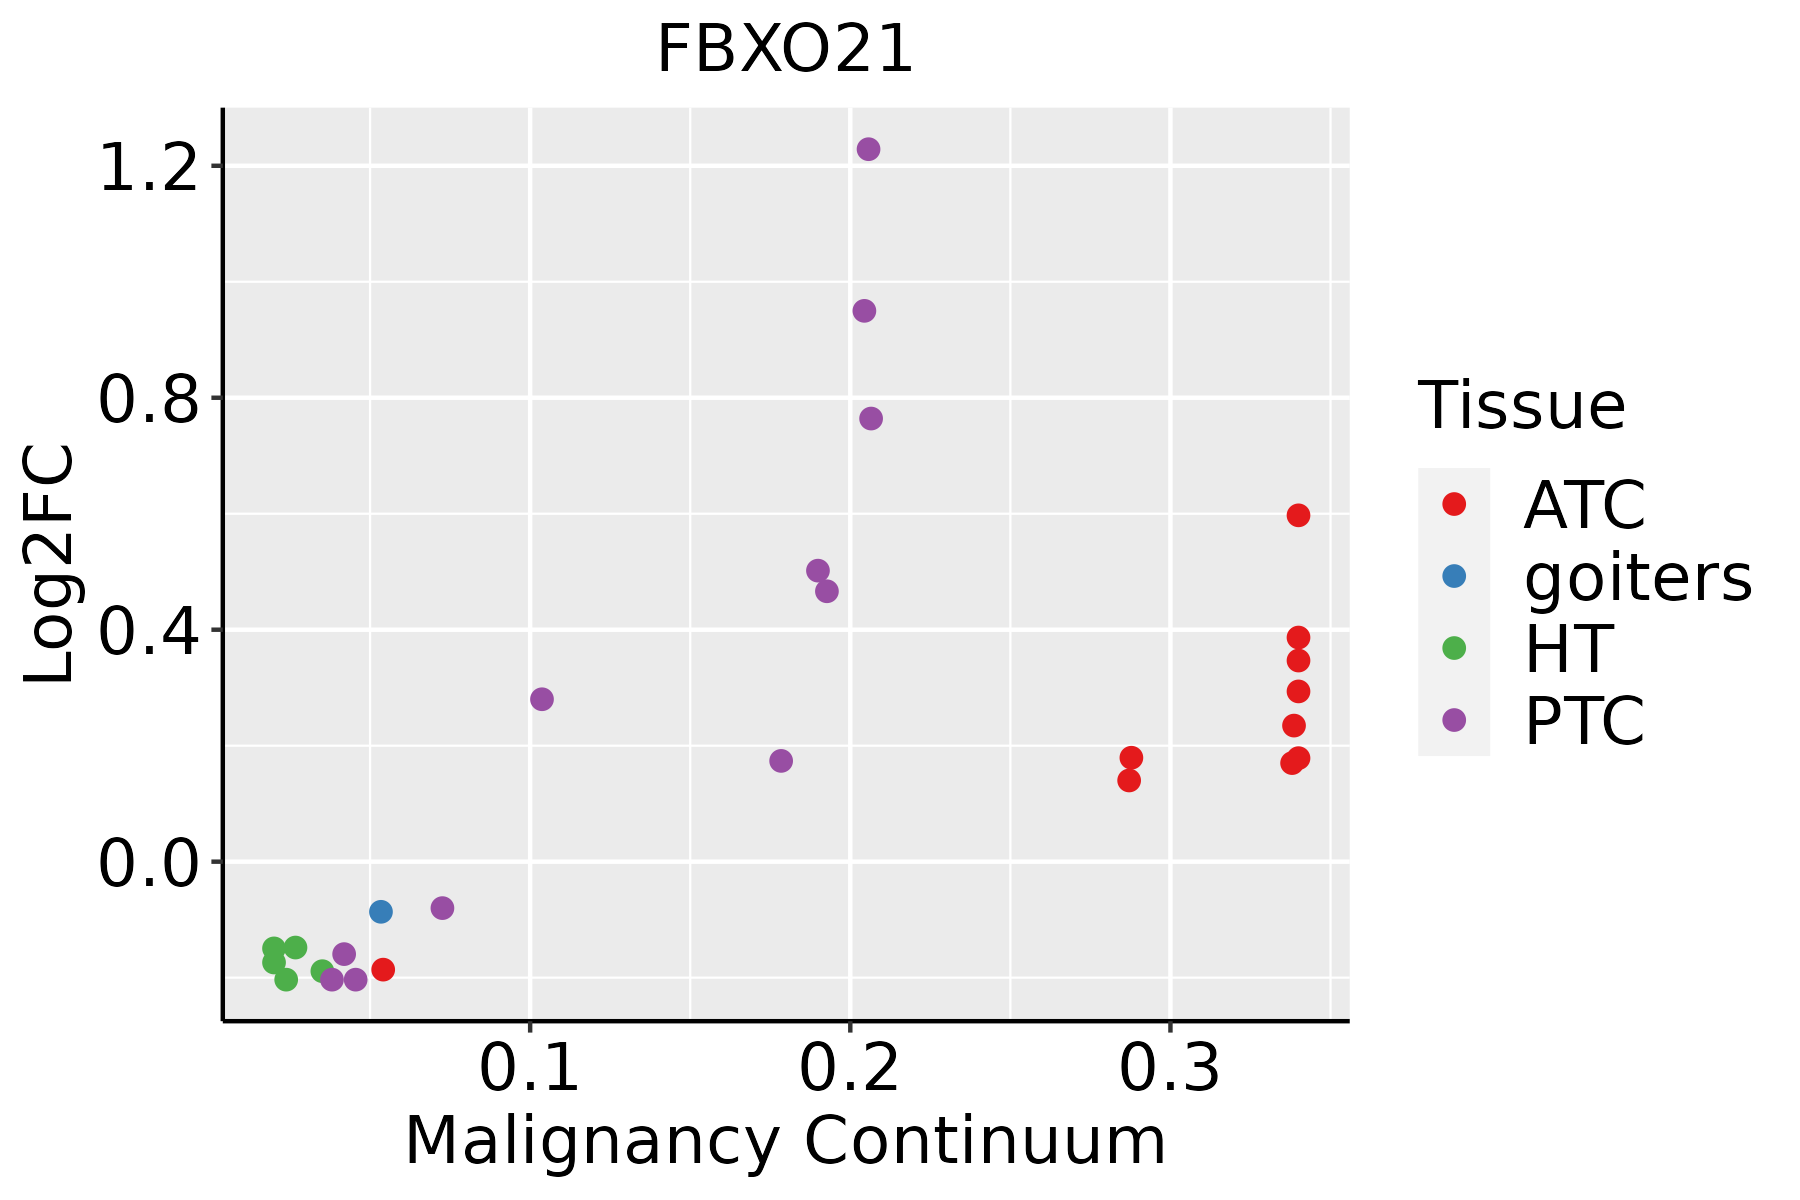 | ATC: Anaplastic thyroid cancer |
| HT: Hashimoto's thyroiditis | ||
| PTC: Papillary thyroid cancer |
| ∗log2FC in expression of this searched gene in stem-like cells from each diseased tissue sample relative to stem-like cells in normal samples in each tissue plotted against the malignancy continuum. Samples are colored based on if they are from different disease stage. |
Top |
Malignant transformation related pathway analysis |
| Find out the enriched GO biological processes and KEGG pathways involved in transition from healthy to precancer to cancer |
| Tissue | Disease Stage | Enriched GO biological Processes |
| Colorectum | AD |  |
| Colorectum | SER |  |
| Colorectum | MSS |  |
| Colorectum | MSI-H |  |
| Colorectum | FAP |  |
| ∗Top 15 enriched GO BP terms are showed in the bar plot of each disease state in each tissue. Each row represents a significant GO biological process which is colored according to the -log10(p.adjust). |
| Page: 1 2 3 4 5 6 7 8 9 |
| GO ID | Tissue | Disease Stage | Description | Gene Ratio | Bg Ratio | pvalue | p.adjust | Count |
| Page: 1 |
| Pathway ID | Tissue | Disease Stage | Description | Gene Ratio | Bg Ratio | pvalue | p.adjust | qvalue | Count |
| Page: 1 |
Top |
Cell-cell communication analysis |
| Identification of potential cell-cell interactions between two cell types and their ligand-receptor pairs for different disease states |
| Ligand | Receptor | LRpair | Pathway | Tissue | Disease Stage |
| Page: 1 |
Top |
Single-cell gene regulatory network inference analysis |
| Find out the significant the regulons (TFs) and the target genes of each regulon across cell types for different disease states |
| TF | Cell Type | Tissue | Disease Stage | Target Gene | RSS | Regulon Activity |
| ∗The dot plots of a searched regulon are shown for all cell subpopulations in each disease state of each tissue based on the regulon specific score inferred using pySCENIC and by calculating the average expression. |
| Page: 1 |
Top |
Somatic mutation of malignant transformation related genes |
| Annotation of somatic variants for genes involved in malignant transformation |
| Hugo Symbol | Variant Class | Variant Classification | dbSNP RS | HGVSc | HGVSp | HGVSp Short | SWISSPROT | BIOTYPE | SIFT | PolyPhen | Tumor Sample Barcode | Tissue | Histology | Sex | Age | Stage | Therapy Types | Drugs | Outcome |
| FBXO21 | SNV | Missense_Mutation | novel | c.886N>T | p.Arg296Cys | p.R296C | O94952 | protein_coding | deleterious(0) | possibly_damaging(0.88) | TCGA-AN-A046-01 | Breast | breast invasive carcinoma | Female | >=65 | I/II | Unknown | Unknown | SD |
| FBXO21 | SNV | Missense_Mutation | c.389N>A | p.Gly130Asp | p.G130D | O94952 | protein_coding | deleterious(0.01) | possibly_damaging(0.792) | TCGA-AN-A04C-01 | Breast | breast invasive carcinoma | Female | <65 | I/II | Unknown | Unknown | SD | |
| FBXO21 | SNV | Missense_Mutation | c.938G>T | p.Arg313Leu | p.R313L | O94952 | protein_coding | deleterious(0.01) | possibly_damaging(0.859) | TCGA-AN-A0AK-01 | Breast | breast invasive carcinoma | Female | >=65 | I/II | Unknown | Unknown | SD | |
| FBXO21 | SNV | Missense_Mutation | c.1163N>C | p.Met388Thr | p.M388T | O94952 | protein_coding | deleterious(0) | probably_damaging(0.968) | TCGA-AO-A0J6-01 | Breast | breast invasive carcinoma | Female | <65 | I/II | Chemotherapy | doxorubicin | SD | |
| FBXO21 | SNV | Missense_Mutation | c.1870N>A | p.Glu624Lys | p.E624K | O94952 | protein_coding | tolerated_low_confidence(0.13) | benign(0) | TCGA-BH-A0HP-01 | Breast | breast invasive carcinoma | Female | >=65 | III/IV | Chemotherapy | doxorubicin | SD | |
| FBXO21 | SNV | Missense_Mutation | c.1438N>C | p.Glu480Gln | p.E480Q | O94952 | protein_coding | tolerated(0.52) | benign(0.07) | TCGA-D8-A27G-01 | Breast | breast invasive carcinoma | Female | >=65 | I/II | Unknown | Unknown | SD | |
| FBXO21 | insertion | Frame_Shift_Ins | novel | c.432_433insT | p.Glu145Ter | p.E145* | O94952 | protein_coding | TCGA-A8-A09Z-01 | Breast | breast invasive carcinoma | Female | >=65 | I/II | Unknown | Unknown | SD | ||
| FBXO21 | deletion | Frame_Shift_Del | novel | c.598_626delNNNNNNNNNNNNNNNNNNNNNNNNNNNNN | p.Val200LeufsTer13 | p.V200Lfs*13 | O94952 | protein_coding | TCGA-AN-A049-01 | Breast | breast invasive carcinoma | Female | <65 | I/II | Unknown | Unknown | SD | ||
| FBXO21 | insertion | Nonsense_Mutation | novel | c.1161_1162insTTTTGACACTGTTTCACTTGAATTTTCTC | p.Met388PhefsTer2 | p.M388Ffs*2 | O94952 | protein_coding | TCGA-BH-A0HF-01 | Breast | breast invasive carcinoma | Female | >=65 | I/II | Hormone Therapy | arimidex | SD | ||
| FBXO21 | SNV | Missense_Mutation | novel | c.1477N>T | p.Arg493Cys | p.R493C | O94952 | protein_coding | deleterious(0) | possibly_damaging(0.719) | TCGA-2W-A8YY-01 | Cervix | cervical & endocervical cancer | Female | <65 | I/II | Chemotherapy | cisplatin | CR |
| Page: 1 2 3 4 5 6 7 8 |
Top |
Related drugs of malignant transformation related genes |
| Identification of chemicals and drugs interact with genes involved in malignant transfromation |
| (DGIdb 4.0) |
| Entrez ID | Symbol | Category | Interaction Types | Drug Claim Name | Drug Name | PMIDs |
| Page: 1 |

Copyright 2023-Present -The University of Texas Health Science Center at Houston |