
|
|||||
|
 | |
| |
| |
| |
| |
| |
|
Gene: FBXO17 |
Gene summary for FBXO17 |
| Gene information | Species | Human | Gene symbol | FBXO17 | Gene ID | 115290 |
| Gene name | F-box protein 17 | |
| Gene Alias | FBG4 | |
| Cytomap | 19q13.2 | |
| Gene Type | protein-coding | GO ID | GO:0006464 | UniProtAcc | Q96EF6 |
Top |
Malignant transformation analysis |
| Identification of the aberrant gene expression in precancerous and cancerous lesions by comparing the gene expression of stem-like cells in diseased tissues with normal stem cells |
| Entrez ID | Symbol | Replicates | Species | Organ | Tissue | Adj P-value | Log2FC | Malignancy |
| 115290 | FBXO17 | P1T-E | Human | Esophagus | ESCC | 8.28e-06 | 7.04e-01 | 0.0875 |
| 115290 | FBXO17 | P2T-E | Human | Esophagus | ESCC | 6.06e-55 | 9.17e-01 | 0.1177 |
| 115290 | FBXO17 | P4T-E | Human | Esophagus | ESCC | 1.22e-23 | 5.24e-01 | 0.1323 |
| 115290 | FBXO17 | P5T-E | Human | Esophagus | ESCC | 3.48e-18 | 3.86e-01 | 0.1327 |
| 115290 | FBXO17 | P8T-E | Human | Esophagus | ESCC | 9.73e-44 | 7.84e-01 | 0.0889 |
| 115290 | FBXO17 | P9T-E | Human | Esophagus | ESCC | 1.74e-13 | 2.39e-01 | 0.1131 |
| 115290 | FBXO17 | P10T-E | Human | Esophagus | ESCC | 3.28e-24 | 4.66e-01 | 0.116 |
| 115290 | FBXO17 | P11T-E | Human | Esophagus | ESCC | 2.25e-17 | 7.47e-01 | 0.1426 |
| 115290 | FBXO17 | P12T-E | Human | Esophagus | ESCC | 4.83e-53 | 9.09e-01 | 0.1122 |
| 115290 | FBXO17 | P16T-E | Human | Esophagus | ESCC | 3.76e-39 | 6.53e-01 | 0.1153 |
| 115290 | FBXO17 | P19T-E | Human | Esophagus | ESCC | 2.30e-07 | 6.53e-01 | 0.1662 |
| 115290 | FBXO17 | P20T-E | Human | Esophagus | ESCC | 2.53e-13 | 2.82e-01 | 0.1124 |
| 115290 | FBXO17 | P21T-E | Human | Esophagus | ESCC | 1.55e-06 | 1.55e-01 | 0.1617 |
| 115290 | FBXO17 | P22T-E | Human | Esophagus | ESCC | 2.67e-20 | 3.76e-01 | 0.1236 |
| 115290 | FBXO17 | P23T-E | Human | Esophagus | ESCC | 5.97e-25 | 6.98e-01 | 0.108 |
| 115290 | FBXO17 | P24T-E | Human | Esophagus | ESCC | 1.08e-11 | 2.52e-01 | 0.1287 |
| 115290 | FBXO17 | P26T-E | Human | Esophagus | ESCC | 3.64e-28 | 4.99e-01 | 0.1276 |
| 115290 | FBXO17 | P27T-E | Human | Esophagus | ESCC | 2.72e-07 | 1.93e-01 | 0.1055 |
| 115290 | FBXO17 | P28T-E | Human | Esophagus | ESCC | 1.05e-10 | 2.03e-01 | 0.1149 |
| 115290 | FBXO17 | P32T-E | Human | Esophagus | ESCC | 1.48e-03 | 9.88e-02 | 0.1666 |
| Page: 1 2 3 4 |
| Tissue | Expression Dynamics | Abbreviation |
| Esophagus | 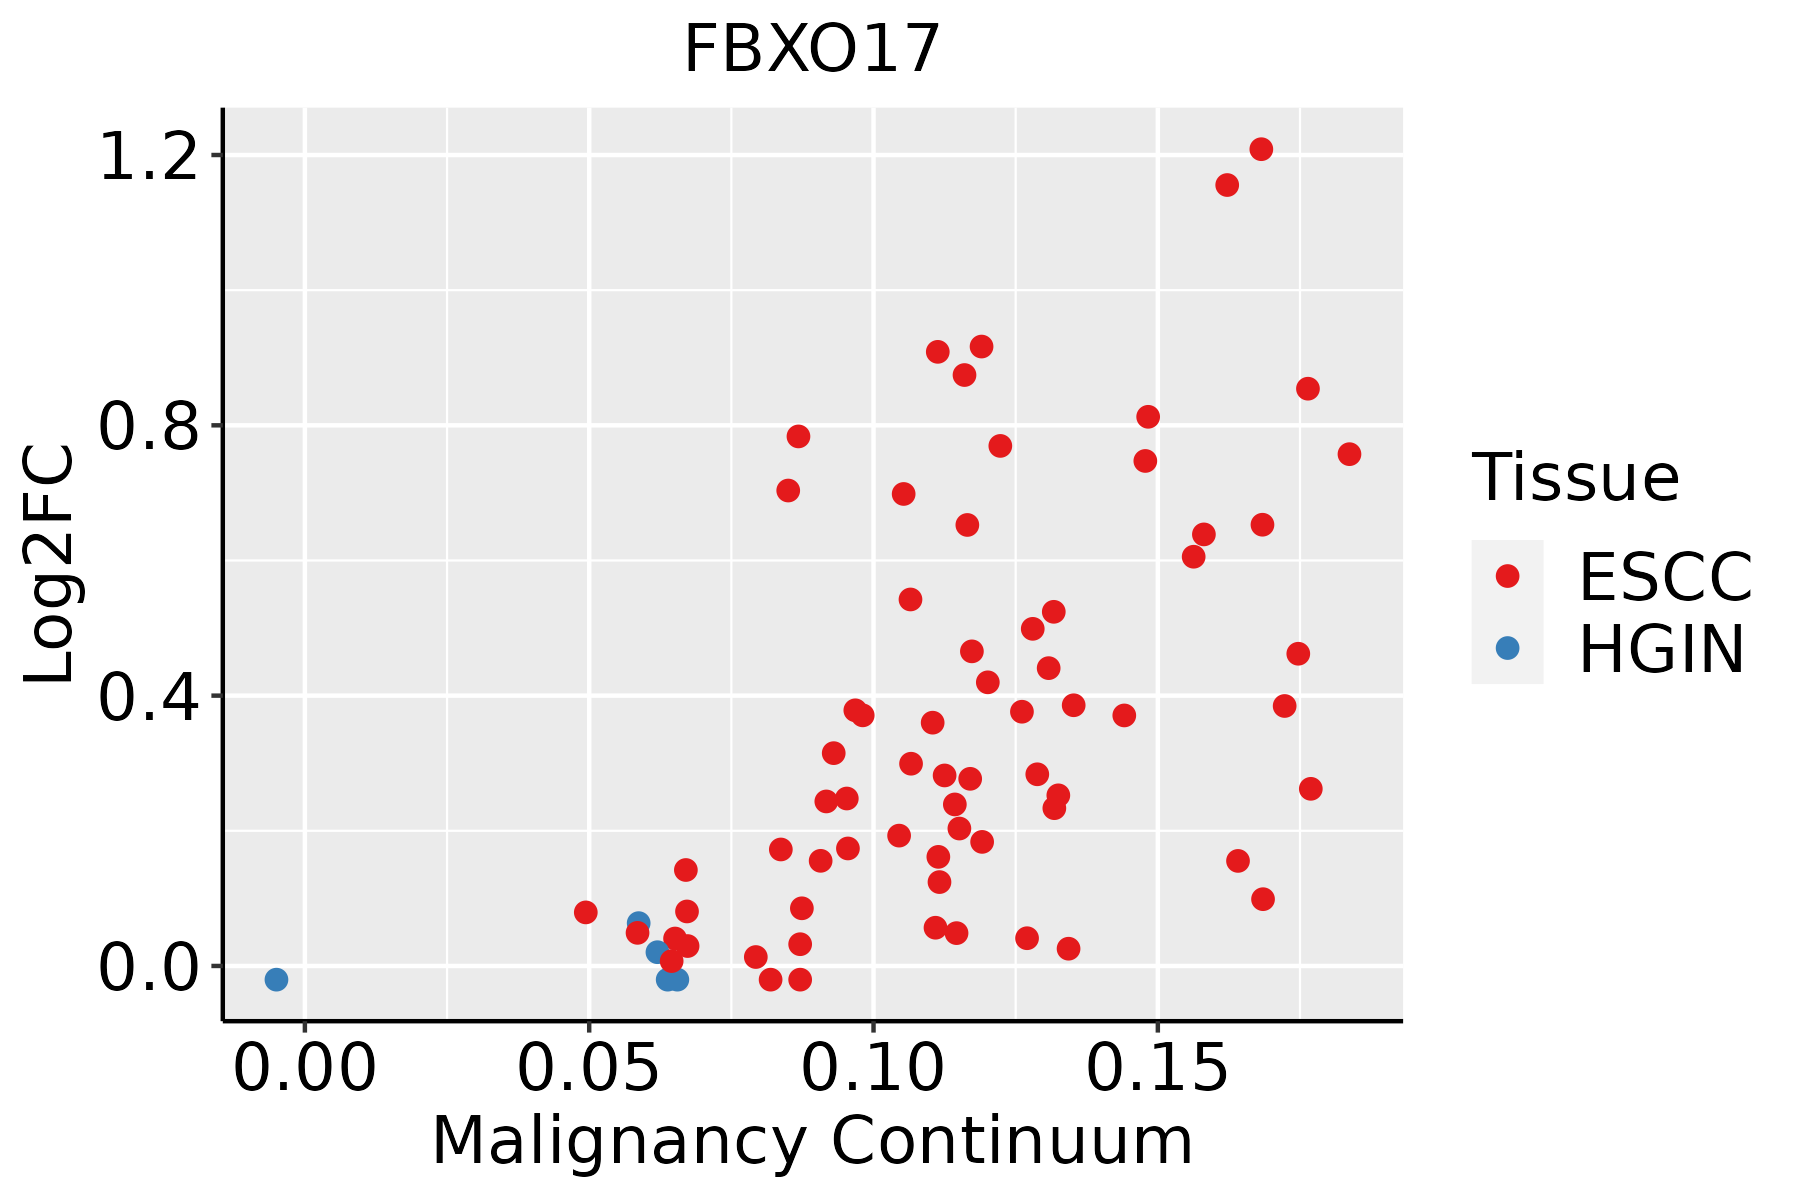 | ESCC: Esophageal squamous cell carcinoma |
| HGIN: High-grade intraepithelial neoplasias | ||
| LGIN: Low-grade intraepithelial neoplasias | ||
| Liver | 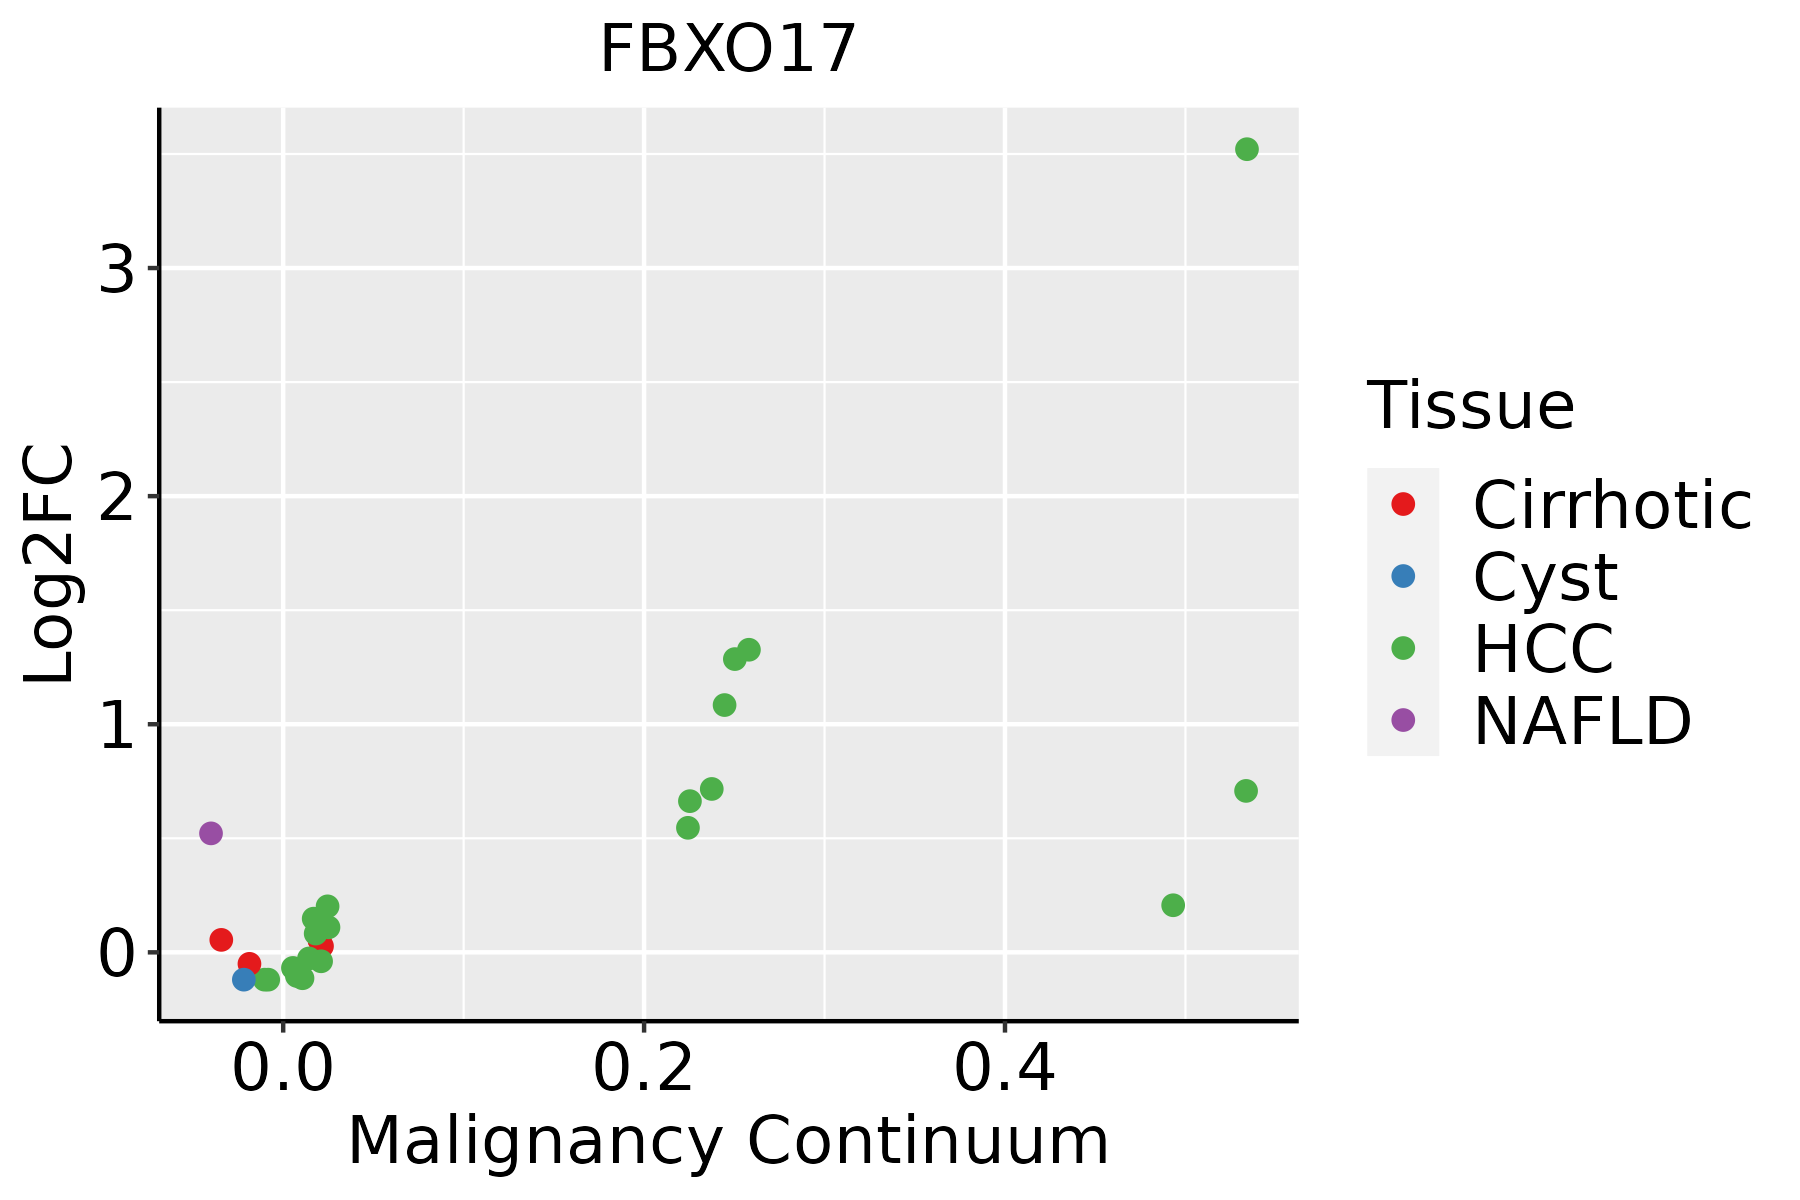 | HCC: Hepatocellular carcinoma |
| NAFLD: Non-alcoholic fatty liver disease | ||
| Oral Cavity | 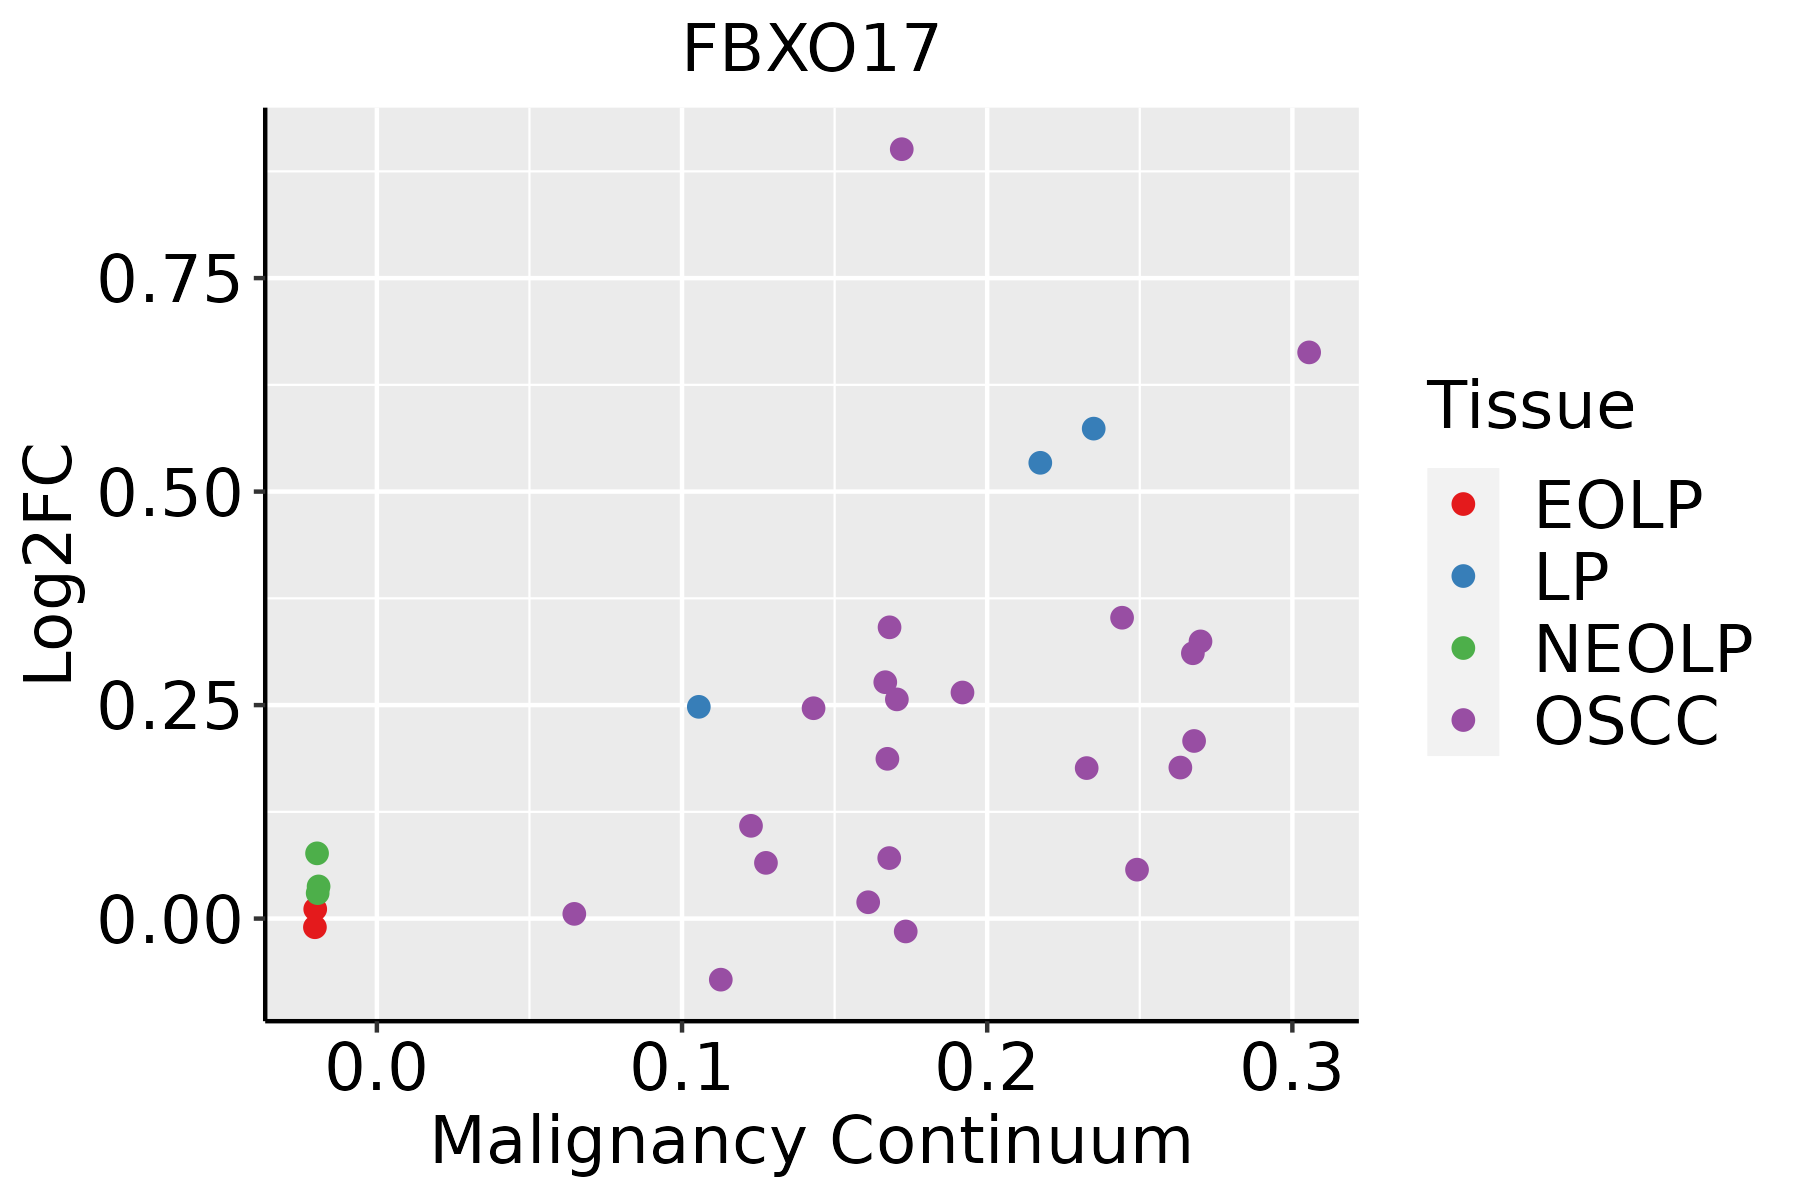 | EOLP: Erosive Oral lichen planus |
| LP: leukoplakia | ||
| NEOLP: Non-erosive oral lichen planus | ||
| OSCC: Oral squamous cell carcinoma | ||
| Thyroid | 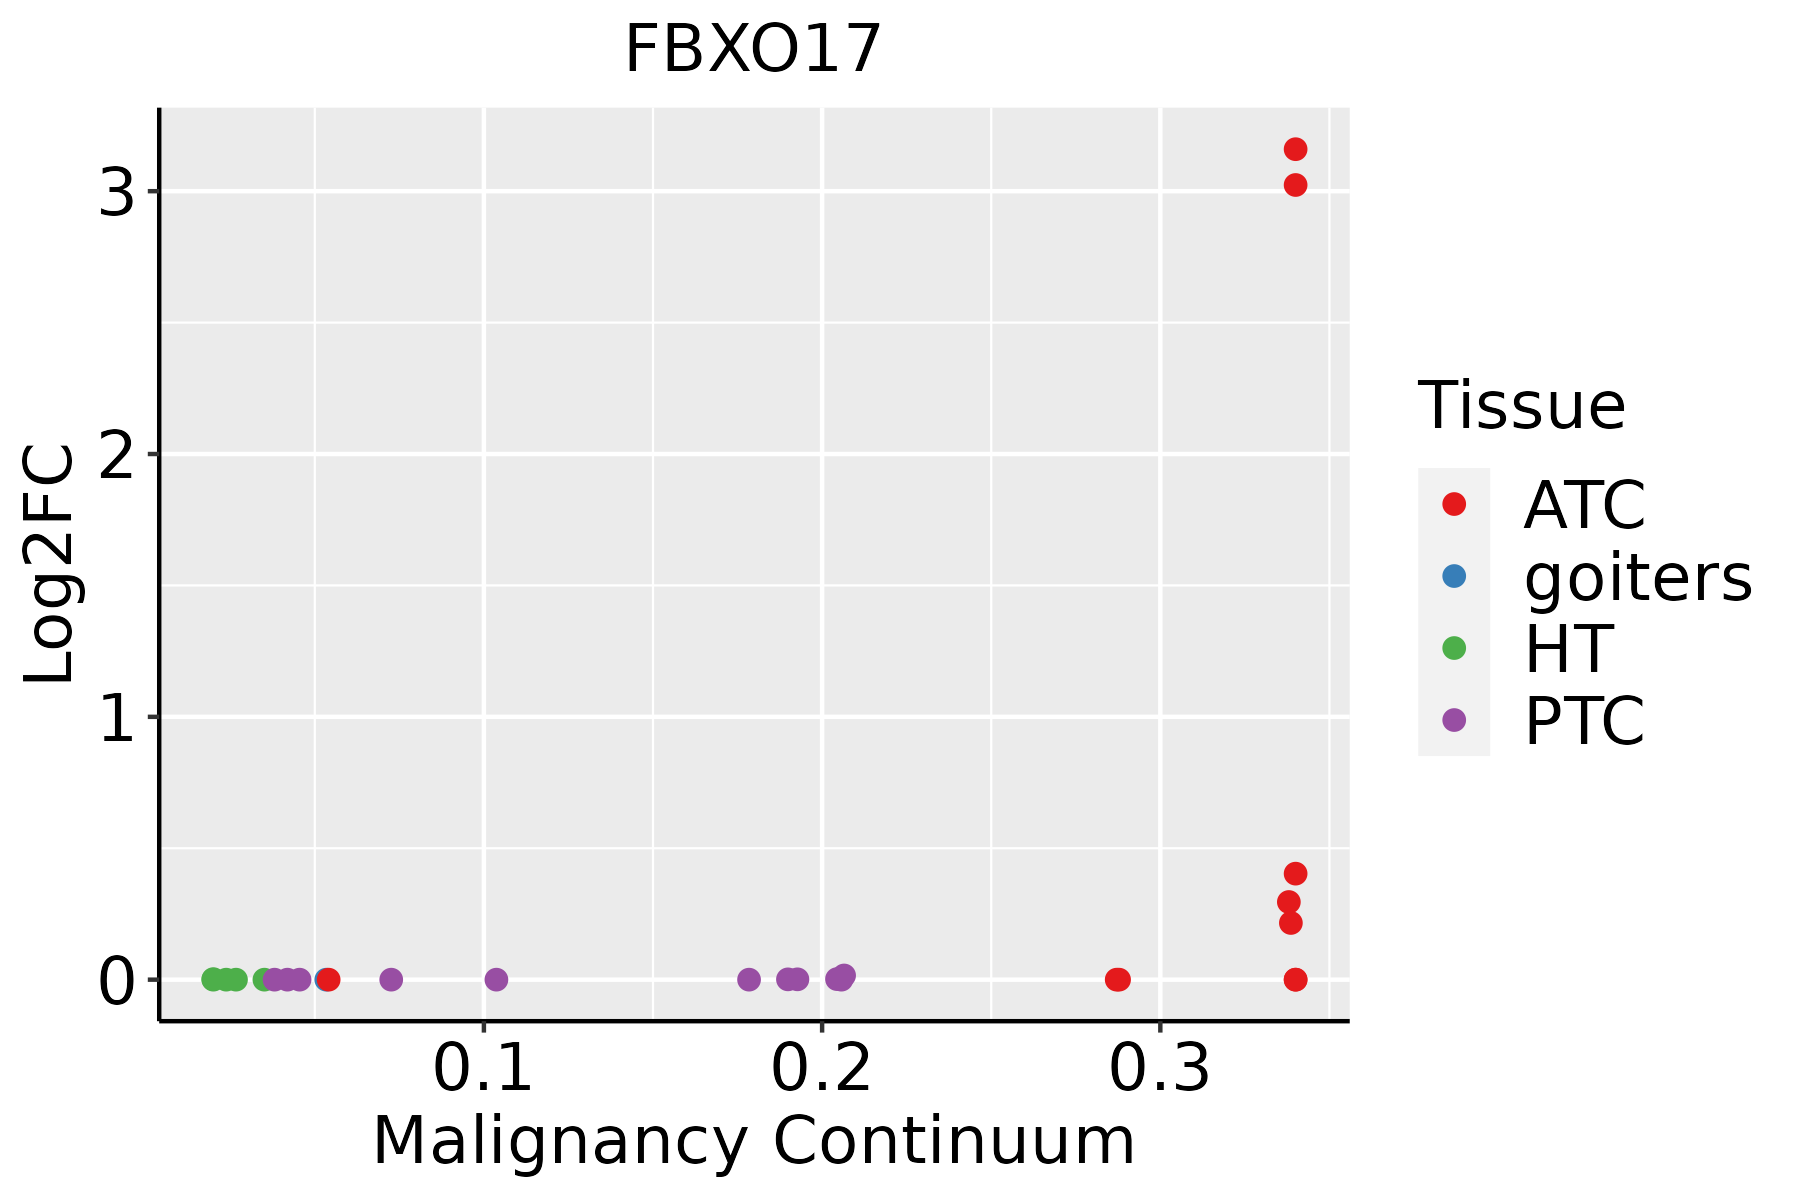 | ATC: Anaplastic thyroid cancer |
| HT: Hashimoto's thyroiditis | ||
| PTC: Papillary thyroid cancer |
| ∗log2FC in expression of this searched gene in stem-like cells from each diseased tissue sample relative to stem-like cells in normal samples in each tissue plotted against the malignancy continuum. Samples are colored based on if they are from different disease stage. |
Top |
Malignant transformation related pathway analysis |
| Find out the enriched GO biological processes and KEGG pathways involved in transition from healthy to precancer to cancer |
| Tissue | Disease Stage | Enriched GO biological Processes |
| Colorectum | AD |  |
| Colorectum | SER |  |
| Colorectum | MSS |  |
| Colorectum | MSI-H |  |
| Colorectum | FAP |  |
| ∗Top 15 enriched GO BP terms are showed in the bar plot of each disease state in each tissue. Each row represents a significant GO biological process which is colored according to the -log10(p.adjust). |
| Page: 1 2 3 4 5 6 7 8 9 |
| GO ID | Tissue | Disease Stage | Description | Gene Ratio | Bg Ratio | pvalue | p.adjust | Count |
| GO:0010498111 | Esophagus | ESCC | proteasomal protein catabolic process | 369/8552 | 490/18723 | 1.13e-41 | 1.80e-38 | 369 |
| GO:0043161111 | Esophagus | ESCC | proteasome-mediated ubiquitin-dependent protein catabolic process | 312/8552 | 412/18723 | 3.53e-36 | 4.48e-33 | 312 |
| GO:0034976111 | Esophagus | ESCC | response to endoplasmic reticulum stress | 192/8552 | 256/18723 | 7.15e-22 | 1.30e-19 | 192 |
| GO:003650315 | Esophagus | ESCC | ERAD pathway | 82/8552 | 107/18723 | 5.80e-11 | 1.84e-09 | 82 |
| GO:003043314 | Esophagus | ESCC | ubiquitin-dependent ERAD pathway | 66/8552 | 85/18723 | 1.64e-09 | 3.78e-08 | 66 |
| GO:00091002 | Esophagus | ESCC | glycoprotein metabolic process | 226/8552 | 387/18723 | 2.64e-07 | 3.94e-06 | 226 |
| GO:19011362 | Esophagus | ESCC | carbohydrate derivative catabolic process | 99/8552 | 172/18723 | 1.11e-03 | 5.54e-03 | 99 |
| GO:00311461 | Esophagus | ESCC | SCF-dependent proteasomal ubiquitin-dependent protein catabolic process | 33/8552 | 49/18723 | 1.80e-03 | 8.26e-03 | 33 |
| GO:0006516 | Esophagus | ESCC | glycoprotein catabolic process | 19/8552 | 28/18723 | 1.49e-02 | 4.84e-02 | 19 |
| GO:00431617 | Liver | NAFLD | proteasome-mediated ubiquitin-dependent protein catabolic process | 91/1882 | 412/18723 | 3.00e-13 | 1.75e-10 | 91 |
| GO:00104987 | Liver | NAFLD | proteasomal protein catabolic process | 101/1882 | 490/18723 | 1.35e-12 | 6.09e-10 | 101 |
| GO:001049822 | Liver | HCC | proteasomal protein catabolic process | 351/7958 | 490/18723 | 6.92e-40 | 1.46e-36 | 351 |
| GO:004316122 | Liver | HCC | proteasome-mediated ubiquitin-dependent protein catabolic process | 299/7958 | 412/18723 | 7.82e-36 | 8.27e-33 | 299 |
| GO:003497612 | Liver | HCC | response to endoplasmic reticulum stress | 189/7958 | 256/18723 | 1.43e-24 | 4.06e-22 | 189 |
| GO:003650311 | Liver | HCC | ERAD pathway | 88/7958 | 107/18723 | 2.87e-17 | 2.85e-15 | 88 |
| GO:00304331 | Liver | HCC | ubiquitin-dependent ERAD pathway | 72/7958 | 85/18723 | 9.78e-16 | 7.47e-14 | 72 |
| GO:1901136 | Liver | HCC | carbohydrate derivative catabolic process | 98/7958 | 172/18723 | 8.71e-05 | 7.62e-04 | 98 |
| GO:0009100 | Liver | HCC | glycoprotein metabolic process | 193/7958 | 387/18723 | 1.89e-03 | 9.62e-03 | 193 |
| GO:0031146 | Liver | HCC | SCF-dependent proteasomal ubiquitin-dependent protein catabolic process | 30/7958 | 49/18723 | 6.31e-03 | 2.57e-02 | 30 |
| GO:001049820 | Oral cavity | OSCC | proteasomal protein catabolic process | 336/7305 | 490/18723 | 5.45e-41 | 8.63e-38 | 336 |
| Page: 1 2 |
| Pathway ID | Tissue | Disease Stage | Description | Gene Ratio | Bg Ratio | pvalue | p.adjust | qvalue | Count |
| Page: 1 |
Top |
Cell-cell communication analysis |
| Identification of potential cell-cell interactions between two cell types and their ligand-receptor pairs for different disease states |
| Ligand | Receptor | LRpair | Pathway | Tissue | Disease Stage |
| Page: 1 |
Top |
Single-cell gene regulatory network inference analysis |
| Find out the significant the regulons (TFs) and the target genes of each regulon across cell types for different disease states |
| TF | Cell Type | Tissue | Disease Stage | Target Gene | RSS | Regulon Activity |
| ∗The dot plots of a searched regulon are shown for all cell subpopulations in each disease state of each tissue based on the regulon specific score inferred using pySCENIC and by calculating the average expression. |
| Page: 1 |
Top |
Somatic mutation of malignant transformation related genes |
| Annotation of somatic variants for genes involved in malignant transformation |
| Hugo Symbol | Variant Class | Variant Classification | dbSNP RS | HGVSc | HGVSp | HGVSp Short | SWISSPROT | BIOTYPE | SIFT | PolyPhen | Tumor Sample Barcode | Tissue | Histology | Sex | Age | Stage | Therapy Types | Drugs | Outcome |
| FBXO17 | SNV | Missense_Mutation | novel | c.538N>A | p.Glu180Lys | p.E180K | Q96EF6 | protein_coding | deleterious(0) | probably_damaging(0.989) | TCGA-AC-A3BB-01 | Breast | breast invasive carcinoma | Female | <65 | III/IV | Chemotherapy | cytoxan | CR |
| FBXO17 | SNV | Missense_Mutation | novel | c.644C>T | p.Ser215Leu | p.S215L | Q96EF6 | protein_coding | deleterious(0.01) | possibly_damaging(0.766) | TCGA-C5-A2LZ-01 | Cervix | cervical & endocervical cancer | Female | >=65 | III/IV | Unknown | Unknown | PD |
| FBXO17 | SNV | Missense_Mutation | c.642N>A | p.Phe214Leu | p.F214L | Q96EF6 | protein_coding | deleterious(0.03) | probably_damaging(0.928) | TCGA-AA-3510-01 | Colorectum | colon adenocarcinoma | Male | >=65 | I/II | Unknown | Unknown | SD | |
| FBXO17 | SNV | Missense_Mutation | c.470C>T | p.Ser157Phe | p.S157F | Q96EF6 | protein_coding | tolerated(0.73) | benign(0) | TCGA-AP-A0LM-01 | Endometrium | uterine corpus endometrioid carcinoma | Female | <65 | III/IV | Chemotherapy | cisplatin | SD | |
| FBXO17 | SNV | Missense_Mutation | rs760219167 | c.703N>A | p.Val235Ile | p.V235I | Q96EF6 | protein_coding | tolerated(0.07) | benign(0.085) | TCGA-AX-A2H5-01 | Endometrium | uterine corpus endometrioid carcinoma | Female | >=65 | III/IV | Chemotherapy | carboplatin | CR |
| FBXO17 | SNV | Missense_Mutation | c.407N>G | p.Asn136Ser | p.N136S | Q96EF6 | protein_coding | tolerated(0.07) | probably_damaging(0.983) | TCGA-BS-A0TC-01 | Endometrium | uterine corpus endometrioid carcinoma | Female | >=65 | I/II | Unknown | Unknown | SD | |
| FBXO17 | SNV | Missense_Mutation | novel | c.448N>C | p.Val150Leu | p.V150L | Q96EF6 | protein_coding | tolerated(0.26) | benign(0.239) | TCGA-FI-A2CY-01 | Endometrium | uterine corpus endometrioid carcinoma | Female | <65 | I/II | Chemotherapy | carboplatinum | CR |
| FBXO17 | SNV | Missense_Mutation | novel | c.505N>C | p.Val169Leu | p.V169L | Q96EF6 | protein_coding | tolerated(1) | benign(0.001) | TCGA-ZP-A9D4-01 | Liver | liver hepatocellular carcinoma | Female | <65 | I/II | Unknown | Unknown | SD |
| FBXO17 | SNV | Missense_Mutation | c.758G>C | p.Arg253Thr | p.R253T | Q96EF6 | protein_coding | tolerated(0.12) | possibly_damaging(0.863) | TCGA-75-6214-01 | Lung | lung adenocarcinoma | Female | Unknown | III/IV | Unknown | Unknown | PD | |
| FBXO17 | SNV | Missense_Mutation | c.106N>A | p.Arg36Ser | p.R36S | Q96EF6 | protein_coding | tolerated(0.12) | benign(0.15) | TCGA-86-8358-01 | Lung | lung adenocarcinoma | Male | <65 | I/II | Unknown | Unknown | SD |
| Page: 1 2 |
Top |
Related drugs of malignant transformation related genes |
| Identification of chemicals and drugs interact with genes involved in malignant transfromation |
| (DGIdb 4.0) |
| Entrez ID | Symbol | Category | Interaction Types | Drug Claim Name | Drug Name | PMIDs |
| Page: 1 |

Copyright 2023-Present -The University of Texas Health Science Center at Houston |