
|
|||||
|
 | |
| |
| |
| |
| |
| |
|
Gene: FBXO11 |
Gene summary for FBXO11 |
| Gene information | Species | Human | Gene symbol | FBXO11 | Gene ID | 80204 |
| Gene name | F-box protein 11 | |
| Gene Alias | FBX11 | |
| Cytomap | 2p16.3 | |
| Gene Type | protein-coding | GO ID | GO:0003008 | UniProtAcc | Q86XK2 |
Top |
Malignant transformation analysis |
| Identification of the aberrant gene expression in precancerous and cancerous lesions by comparing the gene expression of stem-like cells in diseased tissues with normal stem cells |
| Entrez ID | Symbol | Replicates | Species | Organ | Tissue | Adj P-value | Log2FC | Malignancy |
| 80204 | FBXO11 | CCI_1 | Human | Cervix | CC | 1.66e-05 | 1.00e+00 | 0.528 |
| 80204 | FBXO11 | CCI_2 | Human | Cervix | CC | 1.03e-16 | 1.68e+00 | 0.5249 |
| 80204 | FBXO11 | CCI_3 | Human | Cervix | CC | 8.58e-12 | 9.65e-01 | 0.516 |
| 80204 | FBXO11 | HTA11_3410_2000001011 | Human | Colorectum | AD | 8.11e-22 | -5.82e-01 | 0.0155 |
| 80204 | FBXO11 | HTA11_3361_2000001011 | Human | Colorectum | AD | 8.15e-07 | -4.99e-01 | -0.1207 |
| 80204 | FBXO11 | HTA11_7862_2000001011 | Human | Colorectum | AD | 1.91e-03 | -5.66e-01 | -0.0179 |
| 80204 | FBXO11 | HTA11_866_3004761011 | Human | Colorectum | AD | 1.07e-07 | -4.58e-01 | 0.096 |
| 80204 | FBXO11 | HTA11_99999970781_79442 | Human | Colorectum | MSS | 2.27e-12 | -4.81e-01 | 0.294 |
| 80204 | FBXO11 | HTA11_99999971662_82457 | Human | Colorectum | MSS | 1.03e-02 | -3.23e-01 | 0.3859 |
| 80204 | FBXO11 | HTA11_99999974143_84620 | Human | Colorectum | MSS | 2.44e-07 | -4.25e-01 | 0.3005 |
| 80204 | FBXO11 | A001-C-207 | Human | Colorectum | FAP | 4.16e-07 | -3.91e-01 | 0.1278 |
| 80204 | FBXO11 | A015-C-203 | Human | Colorectum | FAP | 1.92e-28 | -4.93e-01 | -0.1294 |
| 80204 | FBXO11 | A015-C-204 | Human | Colorectum | FAP | 4.82e-10 | -4.27e-01 | -0.0228 |
| 80204 | FBXO11 | A014-C-040 | Human | Colorectum | FAP | 9.50e-05 | -4.19e-01 | -0.1184 |
| 80204 | FBXO11 | A002-C-201 | Human | Colorectum | FAP | 1.79e-19 | -4.89e-01 | 0.0324 |
| 80204 | FBXO11 | A002-C-203 | Human | Colorectum | FAP | 1.06e-02 | -2.71e-01 | 0.2786 |
| 80204 | FBXO11 | A001-C-119 | Human | Colorectum | FAP | 2.76e-09 | -5.30e-01 | -0.1557 |
| 80204 | FBXO11 | A001-C-108 | Human | Colorectum | FAP | 4.20e-19 | -3.95e-01 | -0.0272 |
| 80204 | FBXO11 | A002-C-205 | Human | Colorectum | FAP | 4.68e-27 | -4.91e-01 | -0.1236 |
| 80204 | FBXO11 | A001-C-104 | Human | Colorectum | FAP | 1.04e-03 | -2.98e-01 | 0.0184 |
| Page: 1 2 3 4 5 6 7 8 9 10 11 |
| Tissue | Expression Dynamics | Abbreviation |
| Cervix | 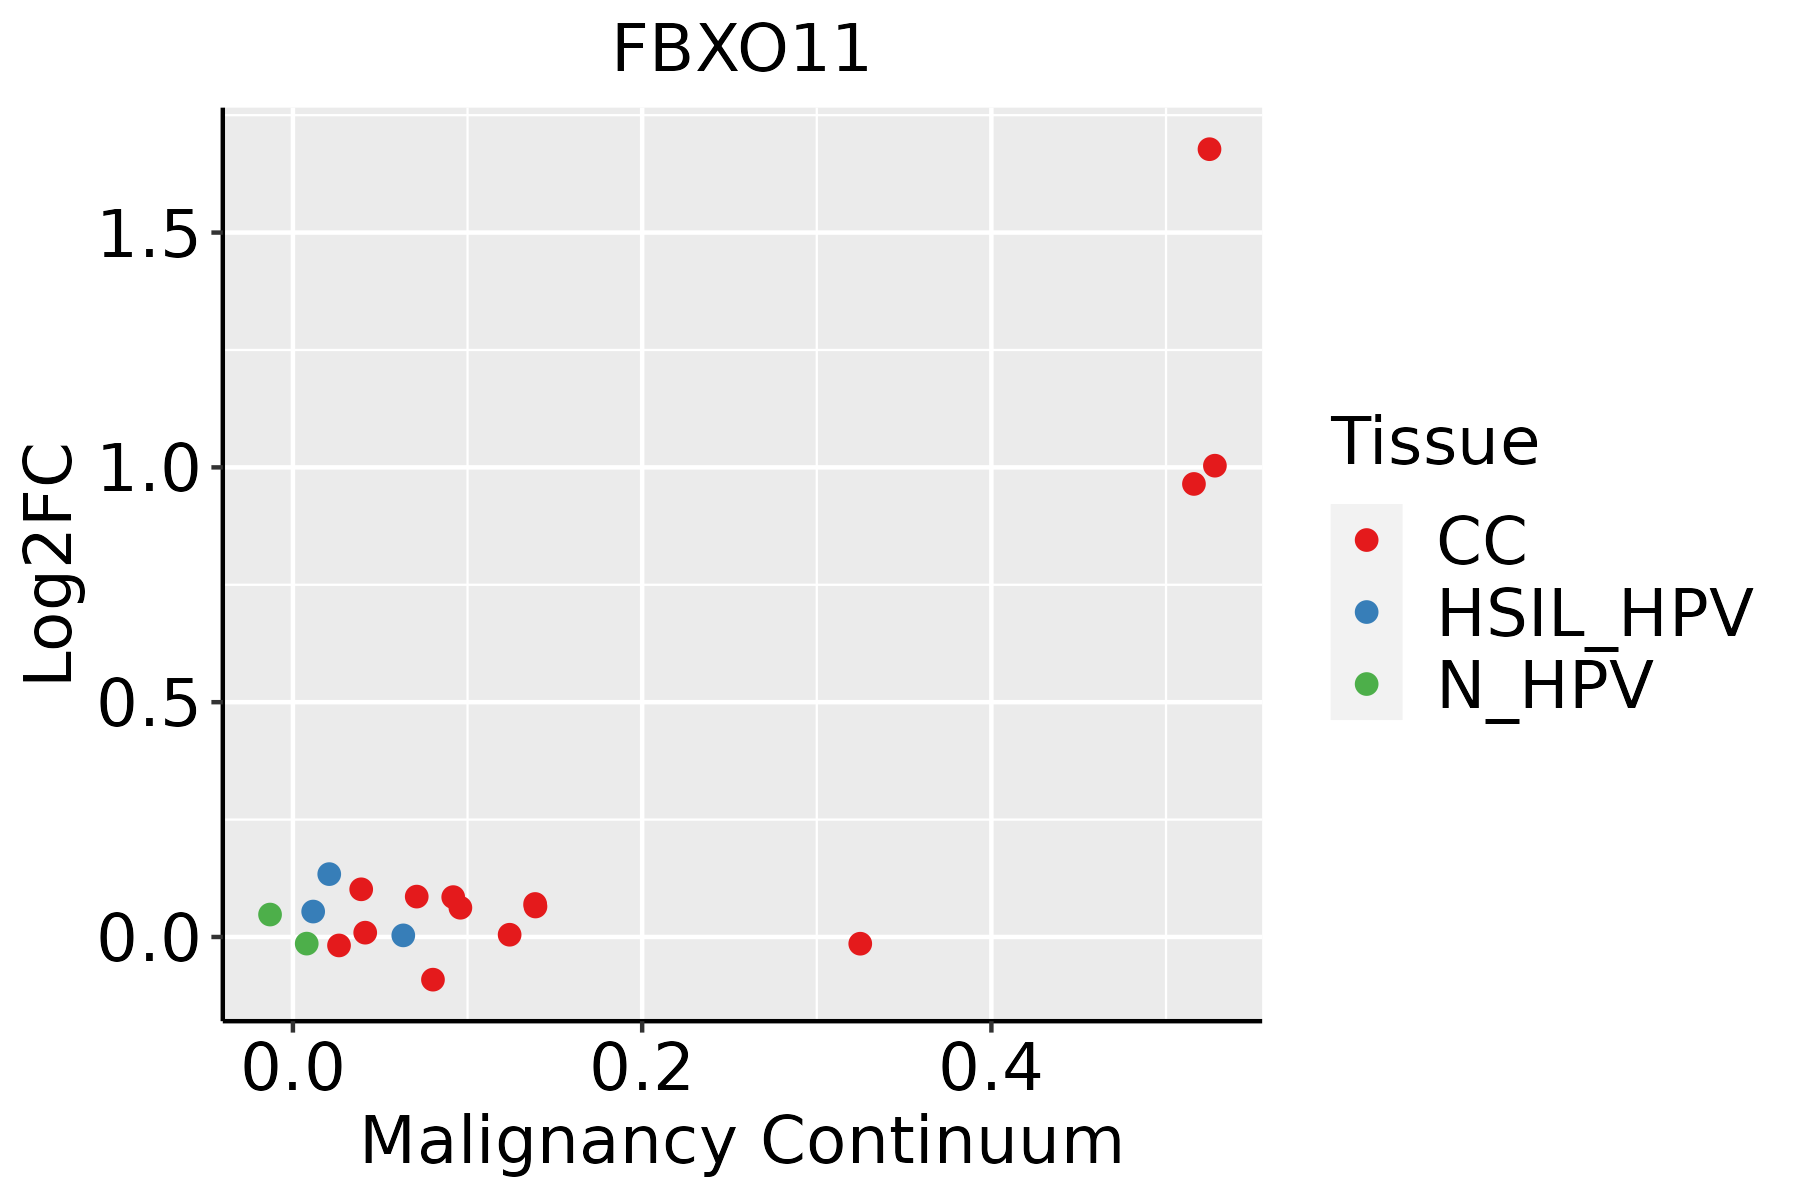 | CC: Cervix cancer |
| HSIL_HPV: HPV-infected high-grade squamous intraepithelial lesions | ||
| N_HPV: HPV-infected normal cervix | ||
| Colorectum (GSE201348) |  | FAP: Familial adenomatous polyposis |
| CRC: Colorectal cancer | ||
| Colorectum (HTA11) |  | AD: Adenomas |
| SER: Sessile serrated lesions | ||
| MSI-H: Microsatellite-high colorectal cancer | ||
| MSS: Microsatellite stable colorectal cancer | ||
| Endometrium |  | AEH: Atypical endometrial hyperplasia |
| EEC: Endometrioid Cancer | ||
| Esophagus | 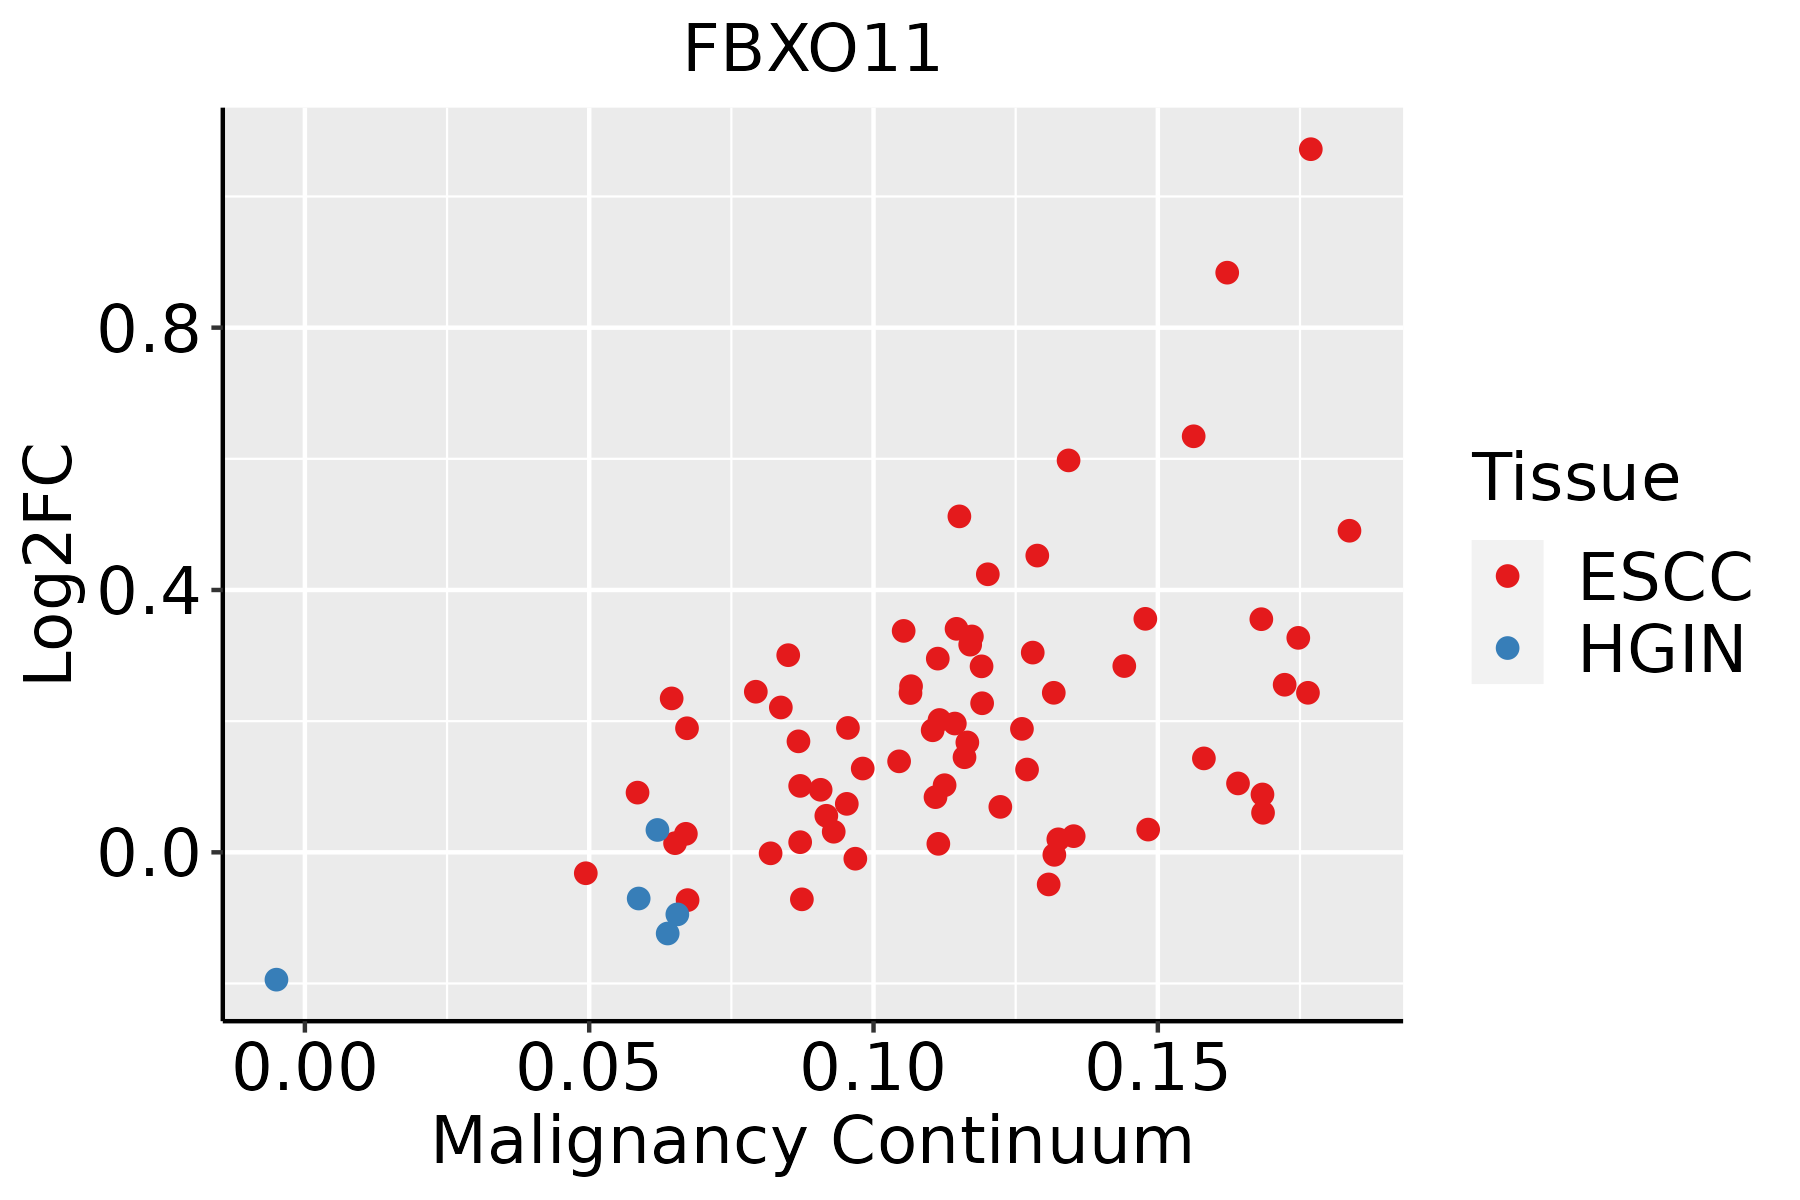 | ESCC: Esophageal squamous cell carcinoma |
| HGIN: High-grade intraepithelial neoplasias | ||
| LGIN: Low-grade intraepithelial neoplasias | ||
| Liver | 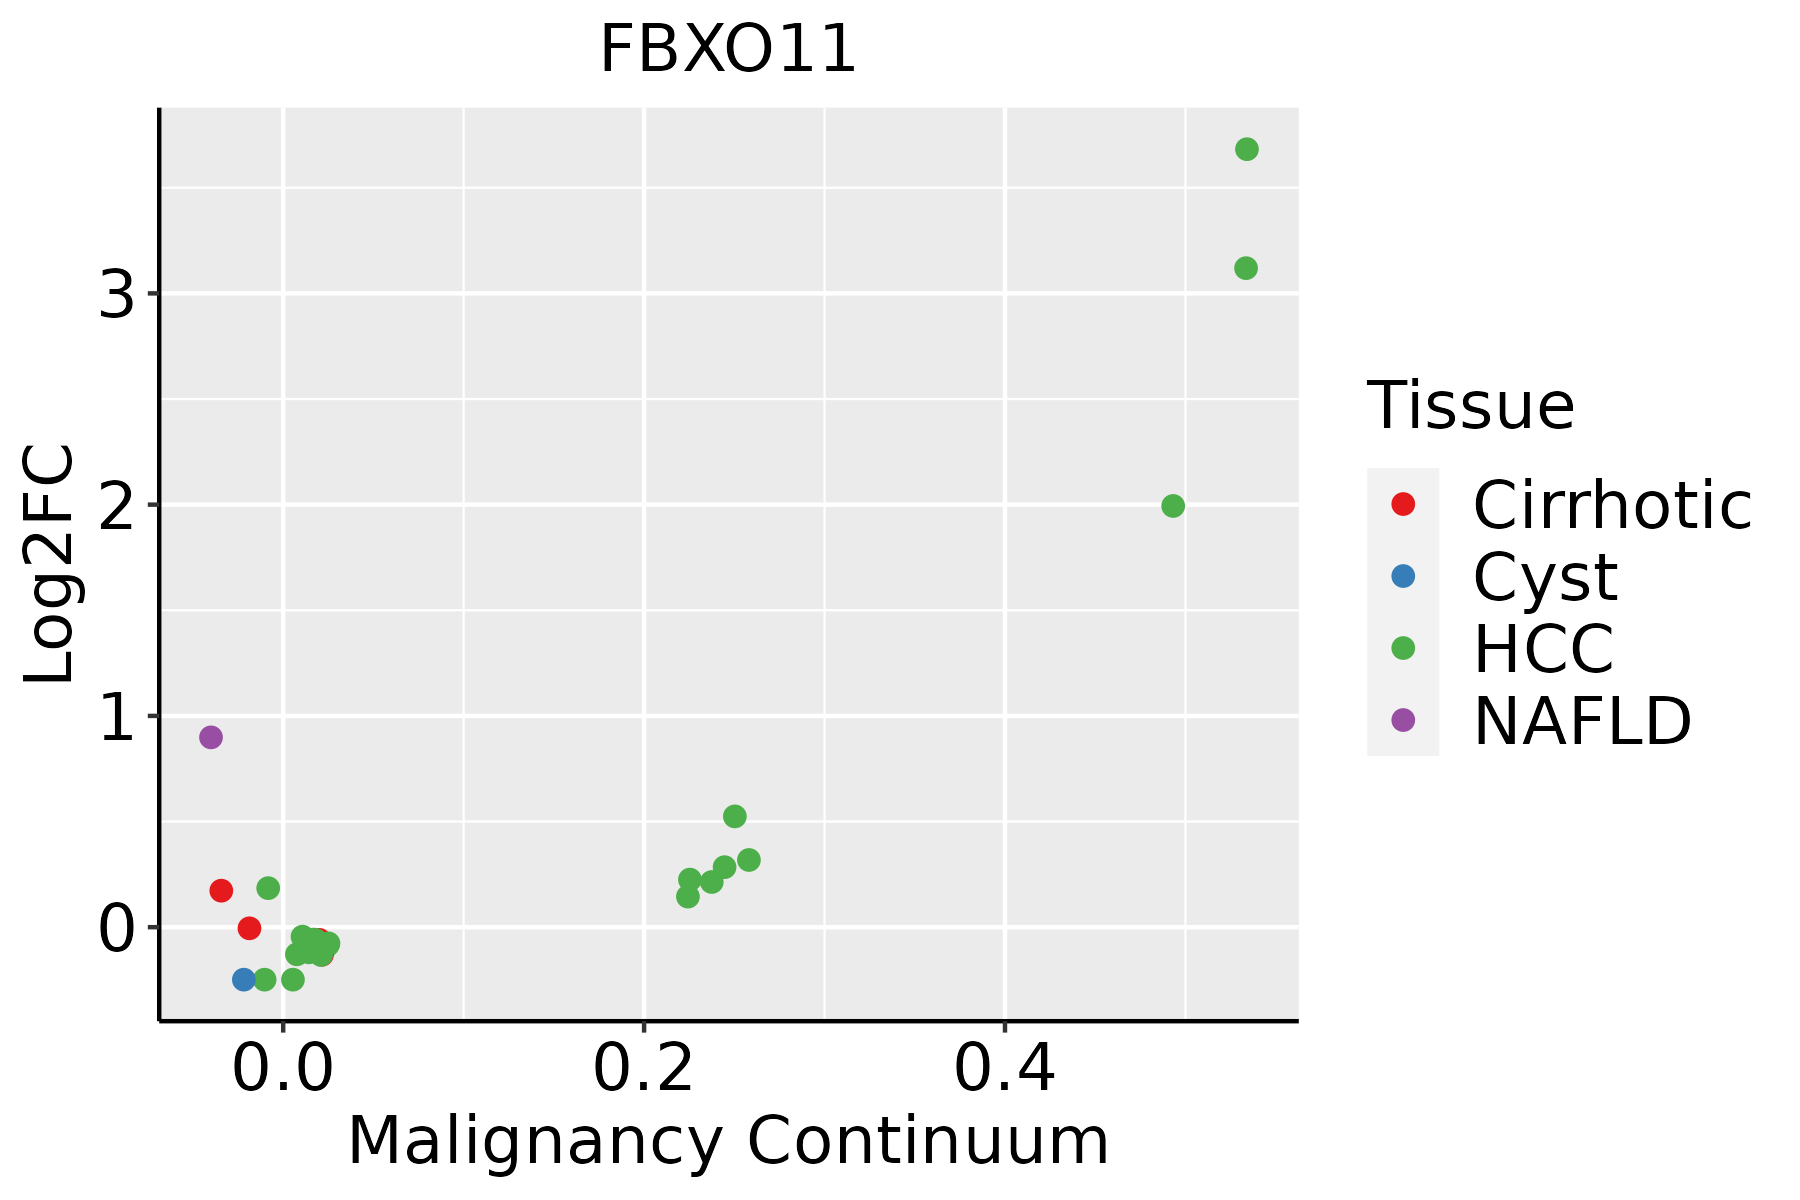 | HCC: Hepatocellular carcinoma |
| NAFLD: Non-alcoholic fatty liver disease | ||
| Lung |  | AAH: Atypical adenomatous hyperplasia |
| AIS: Adenocarcinoma in situ | ||
| IAC: Invasive lung adenocarcinoma | ||
| MIA: Minimally invasive adenocarcinoma | ||
| Oral Cavity | 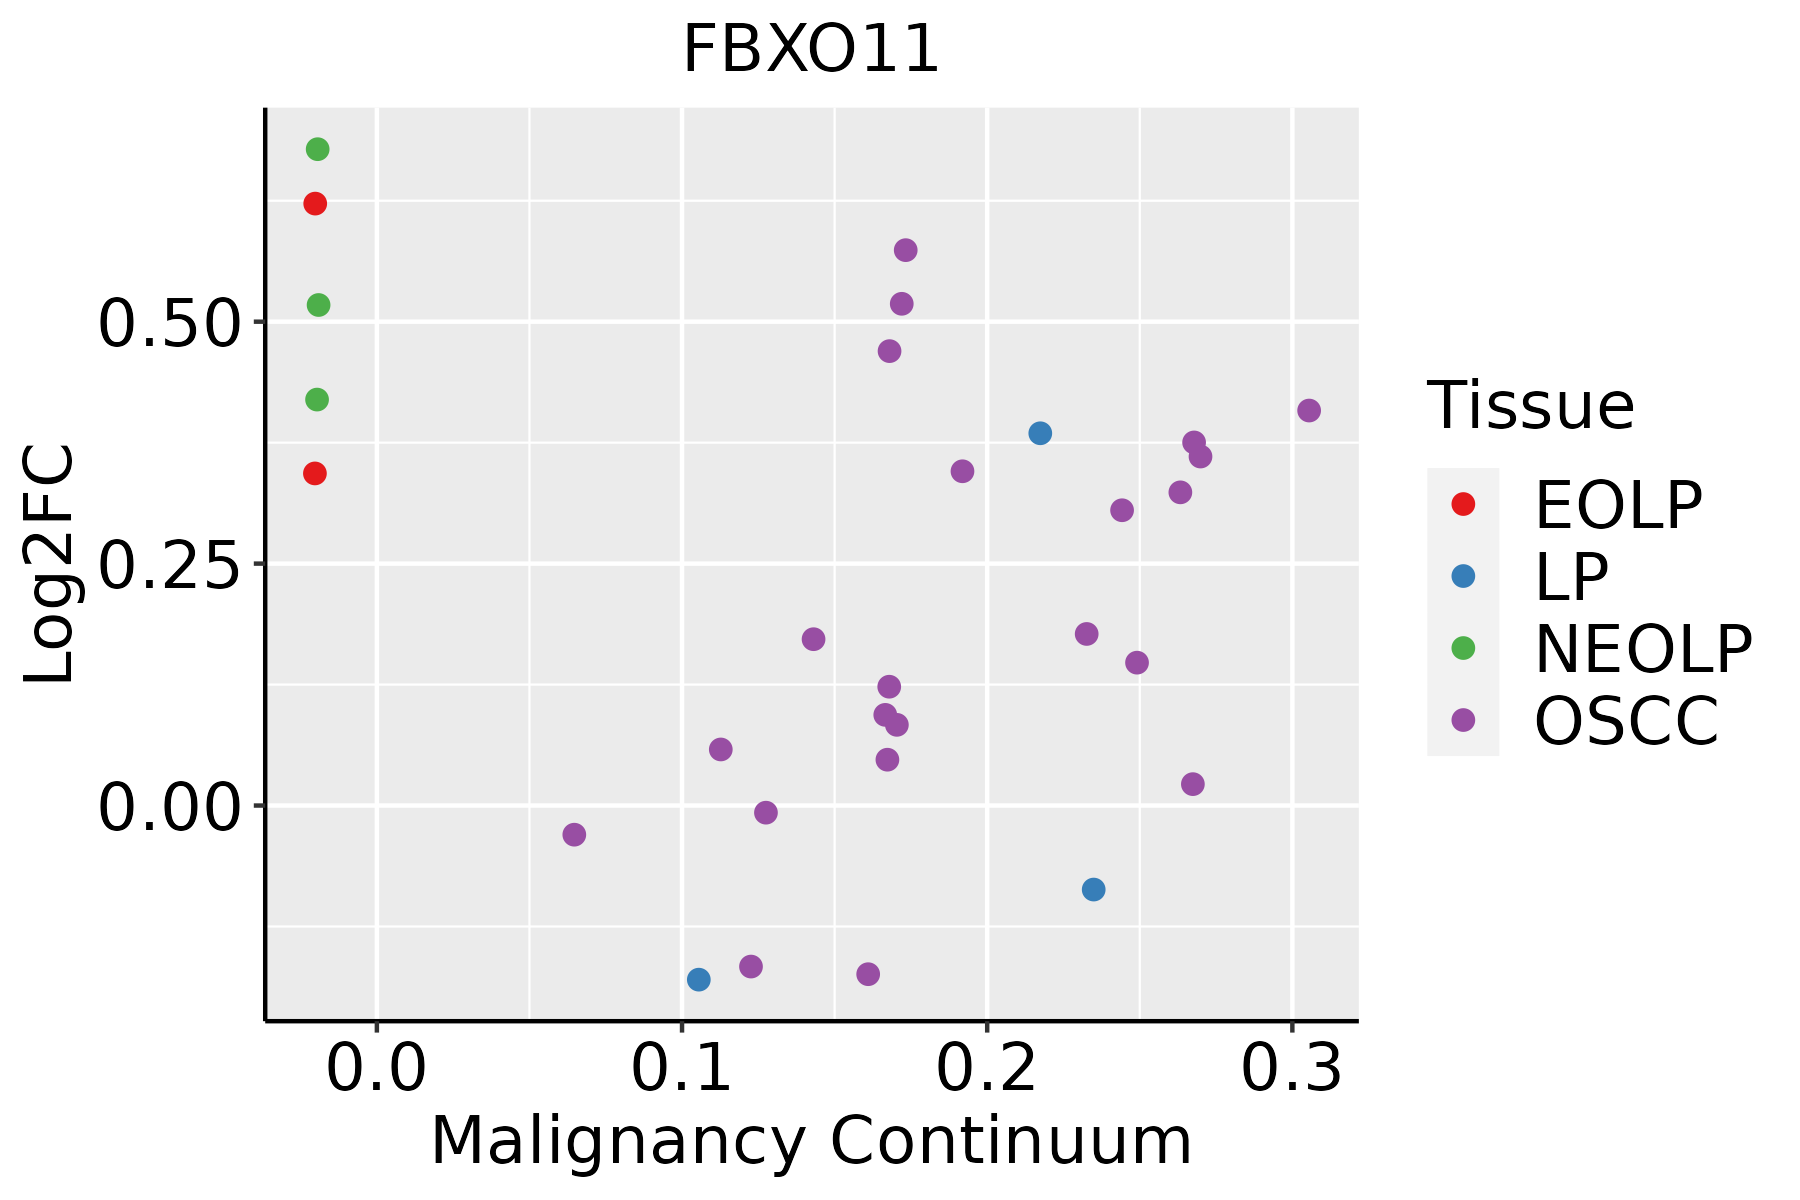 | EOLP: Erosive Oral lichen planus |
| LP: leukoplakia | ||
| NEOLP: Non-erosive oral lichen planus | ||
| OSCC: Oral squamous cell carcinoma | ||
| Prostate | 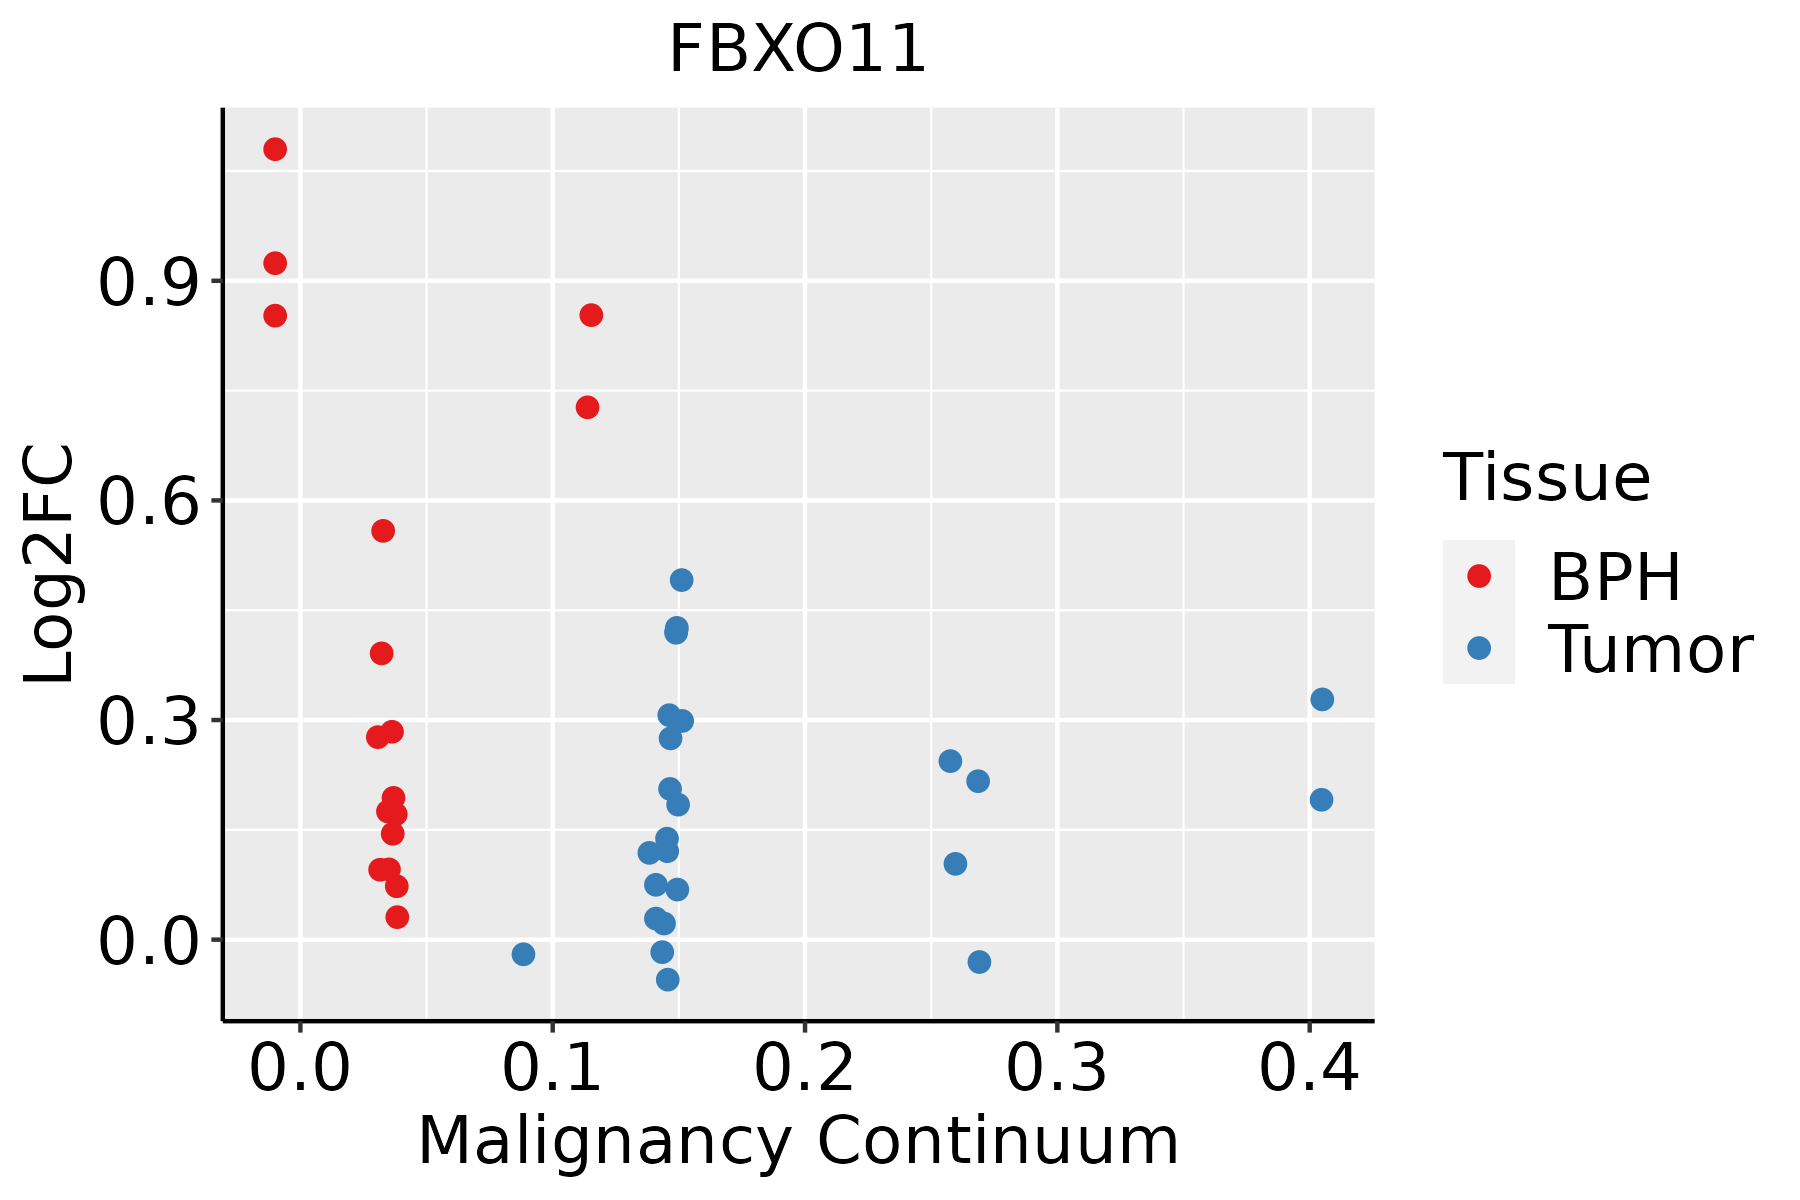 | BPH: Benign Prostatic Hyperplasia |
| Skin |  | AK: Actinic keratosis |
| cSCC: Cutaneous squamous cell carcinoma | ||
| SCCIS:squamous cell carcinoma in situ | ||
| Thyroid | 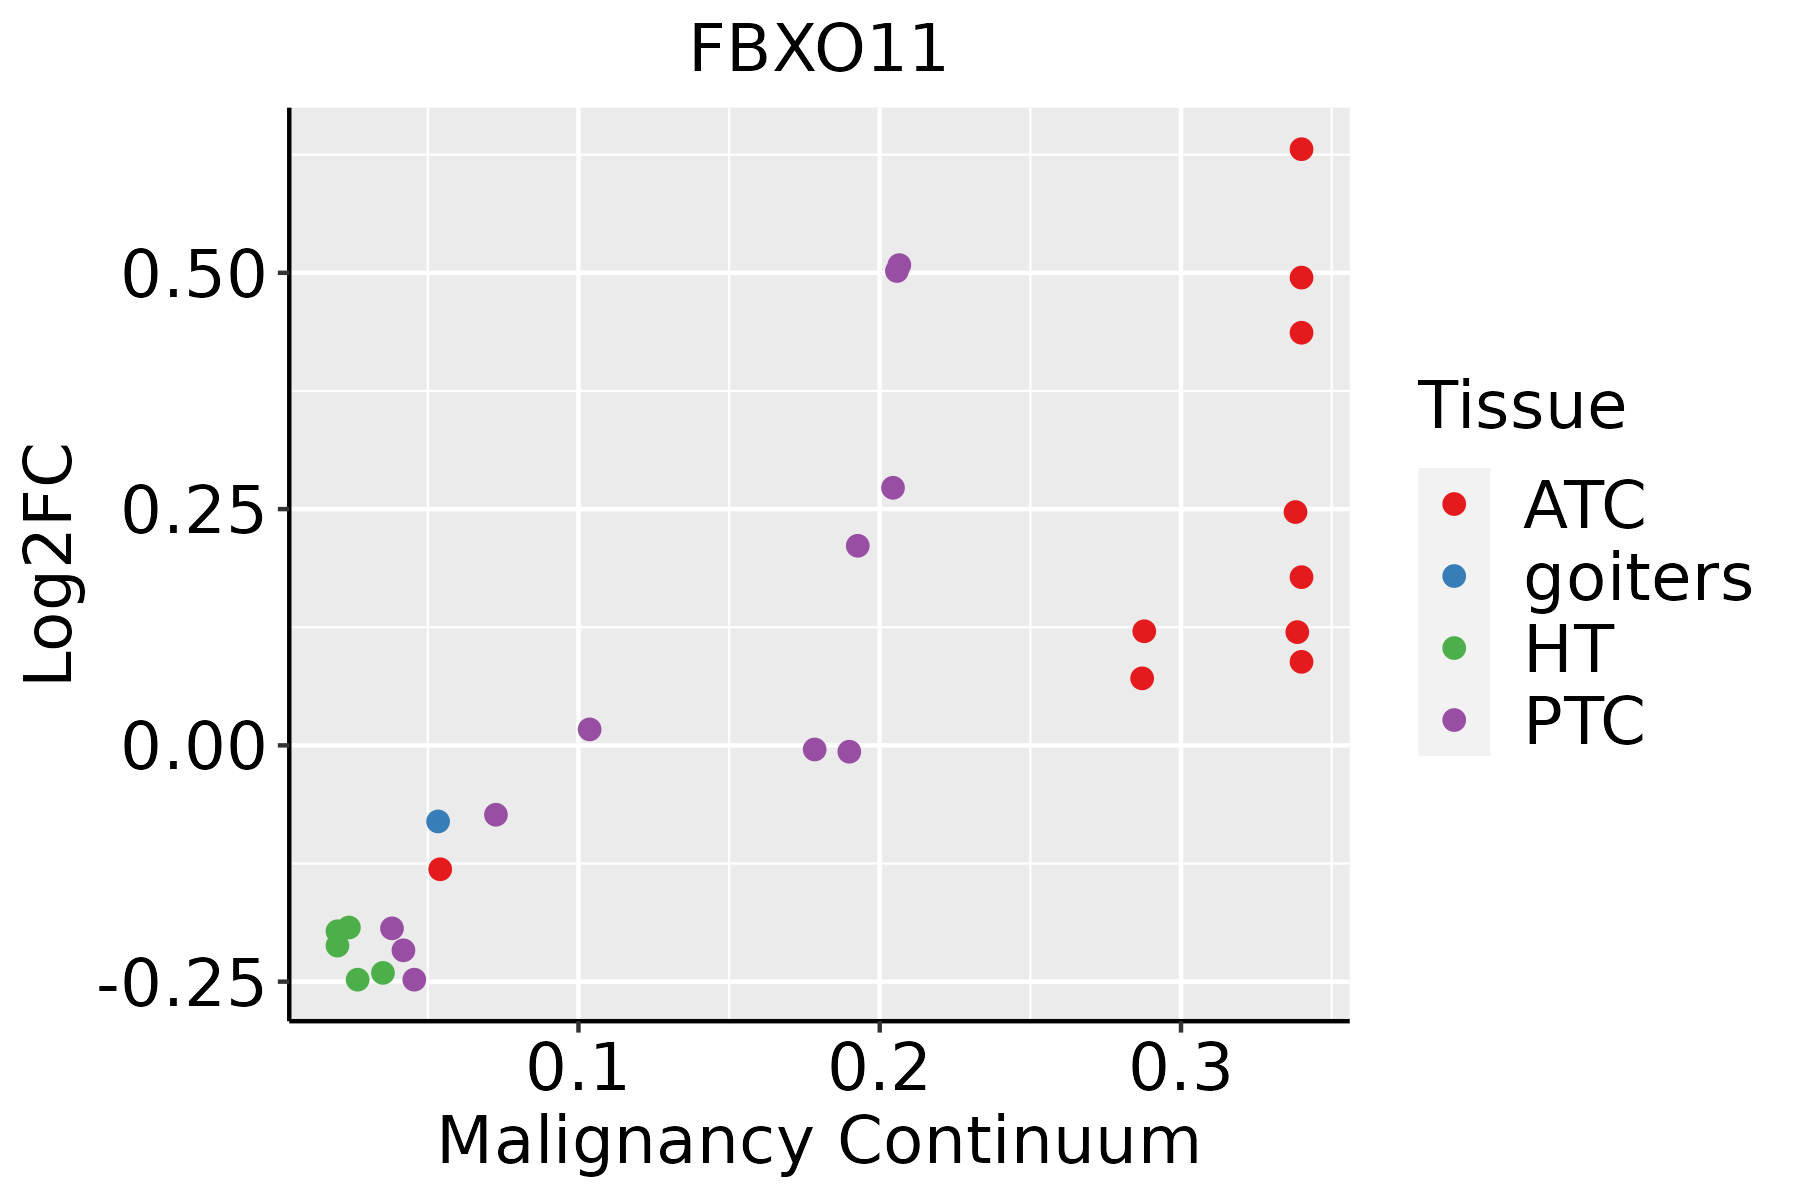 | ATC: Anaplastic thyroid cancer |
| HT: Hashimoto's thyroiditis | ||
| PTC: Papillary thyroid cancer |
| ∗log2FC in expression of this searched gene in stem-like cells from each diseased tissue sample relative to stem-like cells in normal samples in each tissue plotted against the malignancy continuum. Samples are colored based on if they are from different disease stage. |
Top |
Malignant transformation related pathway analysis |
| Find out the enriched GO biological processes and KEGG pathways involved in transition from healthy to precancer to cancer |
| Tissue | Disease Stage | Enriched GO biological Processes |
| Colorectum | AD |  |
| Colorectum | SER |  |
| Colorectum | MSS |  |
| Colorectum | MSI-H |  |
| Colorectum | FAP |  |
| ∗Top 15 enriched GO BP terms are showed in the bar plot of each disease state in each tissue. Each row represents a significant GO biological process which is colored according to the -log10(p.adjust). |
| Page: 1 2 3 4 5 6 7 8 9 |
| GO ID | Tissue | Disease Stage | Description | Gene Ratio | Bg Ratio | pvalue | p.adjust | Count |
| GO:00064795 | Cervix | CC | protein methylation | 36/2311 | 181/18723 | 2.46e-03 | 1.71e-02 | 36 |
| GO:00082135 | Cervix | CC | protein alkylation | 36/2311 | 181/18723 | 2.46e-03 | 1.71e-02 | 36 |
| GO:0006479 | Colorectum | FAP | protein methylation | 39/2622 | 181/18723 | 3.60e-03 | 2.58e-02 | 39 |
| GO:0008213 | Colorectum | FAP | protein alkylation | 39/2622 | 181/18723 | 3.60e-03 | 2.58e-02 | 39 |
| GO:00434143 | Esophagus | ESCC | macromolecule methylation | 199/8552 | 316/18723 | 3.44e-10 | 9.57e-09 | 199 |
| GO:00322592 | Esophagus | ESCC | methylation | 222/8552 | 364/18723 | 2.26e-09 | 5.09e-08 | 222 |
| GO:000647914 | Esophagus | ESCC | protein methylation | 115/8552 | 181/18723 | 9.07e-07 | 1.16e-05 | 115 |
| GO:000821314 | Esophagus | ESCC | protein alkylation | 115/8552 | 181/18723 | 9.07e-07 | 1.16e-05 | 115 |
| GO:00064793 | Liver | NAFLD | protein methylation | 33/1882 | 181/18723 | 5.36e-04 | 7.35e-03 | 33 |
| GO:00082133 | Liver | NAFLD | protein alkylation | 33/1882 | 181/18723 | 5.36e-04 | 7.35e-03 | 33 |
| GO:0043414 | Liver | NAFLD | macromolecule methylation | 47/1882 | 316/18723 | 4.08e-03 | 3.41e-02 | 47 |
| GO:00064791 | Liver | Cirrhotic | protein methylation | 61/4634 | 181/18723 | 4.13e-03 | 2.21e-02 | 61 |
| GO:00082131 | Liver | Cirrhotic | protein alkylation | 61/4634 | 181/18723 | 4.13e-03 | 2.21e-02 | 61 |
| GO:00434141 | Liver | HCC | macromolecule methylation | 183/7958 | 316/18723 | 2.00e-08 | 4.72e-07 | 183 |
| GO:0032259 | Liver | HCC | methylation | 206/7958 | 364/18723 | 3.35e-08 | 7.53e-07 | 206 |
| GO:00064792 | Liver | HCC | protein methylation | 111/7958 | 181/18723 | 2.36e-07 | 4.18e-06 | 111 |
| GO:00082132 | Liver | HCC | protein alkylation | 111/7958 | 181/18723 | 2.36e-07 | 4.18e-06 | 111 |
| GO:00064794 | Lung | IAC | protein methylation | 34/2061 | 181/18723 | 1.28e-03 | 1.45e-02 | 34 |
| GO:00082134 | Lung | IAC | protein alkylation | 34/2061 | 181/18723 | 1.28e-03 | 1.45e-02 | 34 |
| GO:000647911 | Lung | AIS | protein methylation | 29/1849 | 181/18723 | 6.16e-03 | 4.98e-02 | 29 |
| Page: 1 2 3 |
| Pathway ID | Tissue | Disease Stage | Description | Gene Ratio | Bg Ratio | pvalue | p.adjust | qvalue | Count |
| Page: 1 |
Top |
Cell-cell communication analysis |
| Identification of potential cell-cell interactions between two cell types and their ligand-receptor pairs for different disease states |
| Ligand | Receptor | LRpair | Pathway | Tissue | Disease Stage |
| Page: 1 |
Top |
Single-cell gene regulatory network inference analysis |
| Find out the significant the regulons (TFs) and the target genes of each regulon across cell types for different disease states |
| TF | Cell Type | Tissue | Disease Stage | Target Gene | RSS | Regulon Activity |
| ∗The dot plots of a searched regulon are shown for all cell subpopulations in each disease state of each tissue based on the regulon specific score inferred using pySCENIC and by calculating the average expression. |
| Page: 1 |
Top |
Somatic mutation of malignant transformation related genes |
| Annotation of somatic variants for genes involved in malignant transformation |
| Hugo Symbol | Variant Class | Variant Classification | dbSNP RS | HGVSc | HGVSp | HGVSp Short | SWISSPROT | BIOTYPE | SIFT | PolyPhen | Tumor Sample Barcode | Tissue | Histology | Sex | Age | Stage | Therapy Types | Drugs | Outcome |
| FBXO11 | SNV | Missense_Mutation | novel | c.1892G>C | p.Arg631Thr | p.R631T | Q86XK2 | protein_coding | deleterious(0) | possibly_damaging(0.708) | TCGA-5L-AAT1-01 | Breast | breast invasive carcinoma | Female | <65 | III/IV | Hormone Therapy | letrozol | SD |
| FBXO11 | SNV | Missense_Mutation | c.1771N>A | p.Asp591Asn | p.D591N | Q86XK2 | protein_coding | tolerated(0.4) | benign(0.249) | TCGA-A2-A04X-01 | Breast | breast invasive carcinoma | Female | <65 | I/II | Chemotherapy | adriamycin | SD | |
| FBXO11 | SNV | Missense_Mutation | novel | c.244N>A | p.Pro82Thr | p.P82T | Q86XK2 | protein_coding | tolerated_low_confidence(0.23) | benign(0.005) | TCGA-A2-A25A-01 | Breast | breast invasive carcinoma | Female | <65 | I/II | Unspecific | Cytoxan | SD |
| FBXO11 | SNV | Missense_Mutation | c.1691N>G | p.Asn564Ser | p.N564S | Q86XK2 | protein_coding | deleterious(0.04) | benign(0.156) | TCGA-D8-A27P-01 | Breast | breast invasive carcinoma | Female | <65 | I/II | Unknown | Unknown | SD | |
| FBXO11 | SNV | Missense_Mutation | c.2590N>C | p.Ile864Leu | p.I864L | Q86XK2 | protein_coding | deleterious(0) | probably_damaging(0.998) | TCGA-E2-A150-01 | Breast | breast invasive carcinoma | Female | <65 | I/II | Chemotherapy | doxorubicin | SD | |
| FBXO11 | SNV | Missense_Mutation | novel | c.1076N>C | p.Asn359Thr | p.N359T | Q86XK2 | protein_coding | tolerated(0.21) | benign(0.014) | TCGA-C5-A3HD-01 | Cervix | cervical & endocervical cancer | Female | <65 | I/II | Chemotherapy | cisplatin | SD |
| FBXO11 | SNV | Missense_Mutation | novel | c.2359N>A | p.Ala787Thr | p.A787T | Q86XK2 | protein_coding | deleterious(0) | probably_damaging(0.955) | TCGA-EA-A3HU-01 | Cervix | cervical & endocervical cancer | Female | <65 | I/II | Unknown | Unknown | SD |
| FBXO11 | SNV | Missense_Mutation | c.2192N>C | p.Arg731Thr | p.R731T | Q86XK2 | protein_coding | deleterious(0.03) | probably_damaging(0.914) | TCGA-EK-A2RJ-01 | Cervix | cervical & endocervical cancer | Female | <65 | I/II | Unknown | Unknown | SD | |
| FBXO11 | SNV | Missense_Mutation | c.2192G>C | p.Arg731Thr | p.R731T | Q86XK2 | protein_coding | deleterious(0.03) | probably_damaging(0.914) | TCGA-EK-A3GK-01 | Cervix | cervical & endocervical cancer | Female | <65 | I/II | Unknown | Unknown | SD | |
| FBXO11 | SNV | Missense_Mutation | novel | c.1098N>G | p.Ile366Met | p.I366M | Q86XK2 | protein_coding | tolerated(0.12) | possibly_damaging(0.9) | TCGA-FU-A3HZ-01 | Cervix | cervical & endocervical cancer | Female | <65 | I/II | Chemotherapy | cisplatin | CR |
| Page: 1 2 3 4 5 6 7 8 9 |
Top |
Related drugs of malignant transformation related genes |
| Identification of chemicals and drugs interact with genes involved in malignant transfromation |
| (DGIdb 4.0) |
| Entrez ID | Symbol | Category | Interaction Types | Drug Claim Name | Drug Name | PMIDs |
| Page: 1 |

Copyright 2023-Present -The University of Texas Health Science Center at Houston |