
|
|||||
|
 | |
| |
| |
| |
| |
| |
|
Gene: FBXL7 |
Gene summary for FBXL7 |
| Gene information | Species | Human | Gene symbol | FBXL7 | Gene ID | 23194 |
| Gene name | F-box and leucine rich repeat protein 7 | |
| Gene Alias | FBL6 | |
| Cytomap | 5p15.1 | |
| Gene Type | protein-coding | GO ID | GO:0000086 | UniProtAcc | Q9UJT9 |
Top |
Malignant transformation analysis |
| Identification of the aberrant gene expression in precancerous and cancerous lesions by comparing the gene expression of stem-like cells in diseased tissues with normal stem cells |
| Entrez ID | Symbol | Replicates | Species | Organ | Tissue | Adj P-value | Log2FC | Malignancy |
| 23194 | FBXL7 | AEH-subject1 | Human | Endometrium | AEH | 2.94e-20 | 5.68e-01 | -0.3059 |
| 23194 | FBXL7 | AEH-subject2 | Human | Endometrium | AEH | 4.97e-09 | 3.97e-01 | -0.2525 |
| 23194 | FBXL7 | AEH-subject3 | Human | Endometrium | AEH | 5.95e-23 | 6.31e-01 | -0.2576 |
| 23194 | FBXL7 | AEH-subject4 | Human | Endometrium | AEH | 6.44e-17 | 6.06e-01 | -0.2657 |
| 23194 | FBXL7 | AEH-subject5 | Human | Endometrium | AEH | 7.36e-08 | 4.47e-01 | -0.2953 |
| 23194 | FBXL7 | EEC-subject1 | Human | Endometrium | EEC | 2.21e-06 | 4.36e-01 | -0.2682 |
| 23194 | FBXL7 | EEC-subject2 | Human | Endometrium | EEC | 2.49e-04 | 3.45e-01 | -0.2607 |
| 23194 | FBXL7 | EEC-subject3 | Human | Endometrium | EEC | 3.85e-07 | 4.23e-01 | -0.2525 |
| 23194 | FBXL7 | EEC-subject4 | Human | Endometrium | EEC | 2.20e-03 | 2.24e-01 | -0.2571 |
| 23194 | FBXL7 | EEC-subject5 | Human | Endometrium | EEC | 2.64e-02 | 2.51e-01 | -0.249 |
| 23194 | FBXL7 | GSM5276934 | Human | Endometrium | EEC | 7.71e-03 | -7.74e-02 | -0.0913 |
| 23194 | FBXL7 | GSM6177622_NYU_UCEC3_lib1_lib1 | Human | Endometrium | EEC | 8.23e-05 | -8.90e-02 | -0.1917 |
| 23194 | FBXL7 | RNA-P25T1-P25T1-1 | Human | Lung | AIS | 1.60e-12 | 6.66e-01 | -0.2116 |
| 23194 | FBXL7 | RNA-P25T1-P25T1-2 | Human | Lung | AIS | 1.36e-03 | 5.04e-01 | -0.1941 |
| 23194 | FBXL7 | RNA-P25T1-P25T1-3 | Human | Lung | AIS | 4.20e-06 | 5.70e-01 | -0.2107 |
| 23194 | FBXL7 | RNA-P25T1-P25T1-4 | Human | Lung | AIS | 3.10e-17 | 8.08e-01 | -0.2119 |
| 23194 | FBXL7 | RNA-P6T2-P6T2-1 | Human | Lung | IAC | 9.94e-07 | 2.81e-01 | -0.0166 |
| 23194 | FBXL7 | RNA-P6T2-P6T2-2 | Human | Lung | IAC | 9.57e-10 | 3.66e-01 | -0.0132 |
| 23194 | FBXL7 | RNA-P6T2-P6T2-3 | Human | Lung | IAC | 1.85e-09 | 3.24e-01 | -0.013 |
| 23194 | FBXL7 | RNA-P6T2-P6T2-4 | Human | Lung | IAC | 4.89e-07 | 3.08e-01 | -0.0121 |
| Page: 1 2 |
| Tissue | Expression Dynamics | Abbreviation |
| Endometrium | 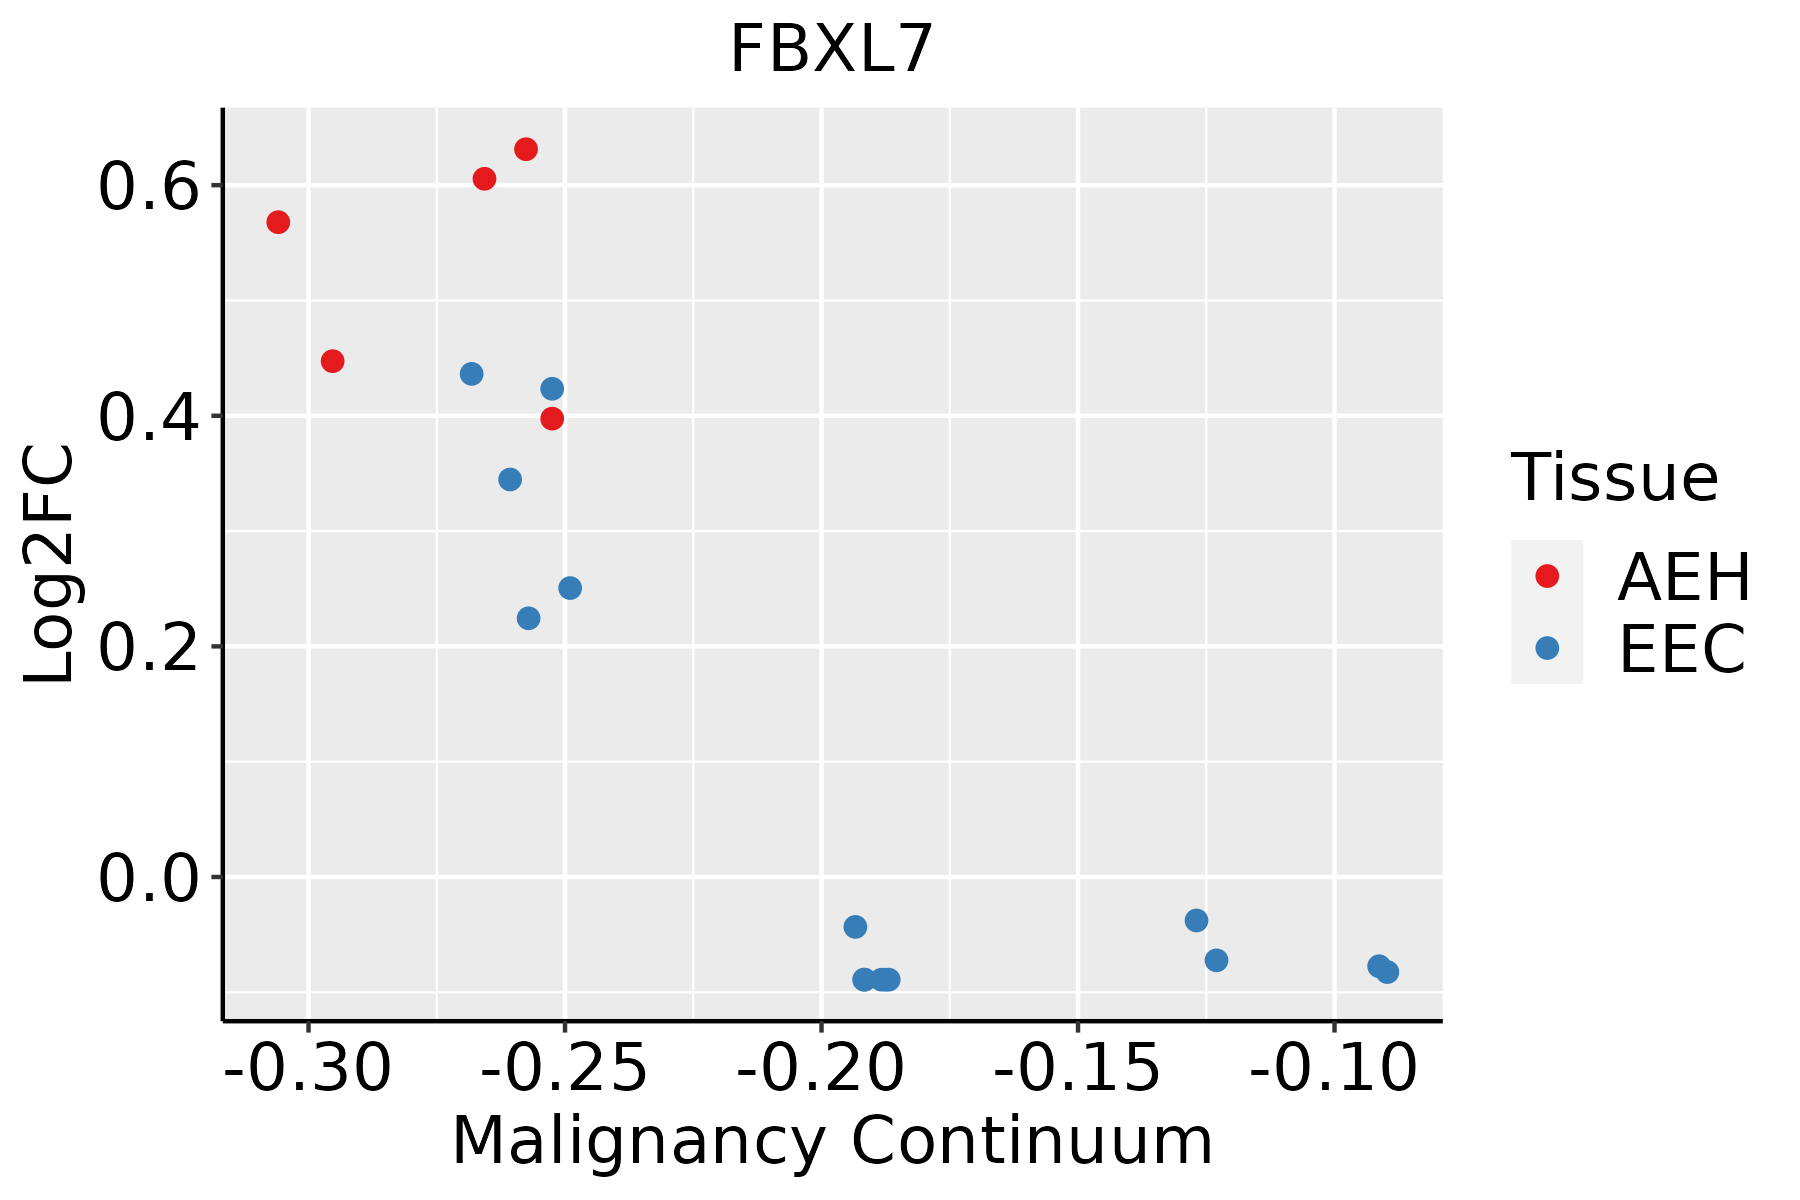 | AEH: Atypical endometrial hyperplasia |
| EEC: Endometrioid Cancer | ||
| Lung | 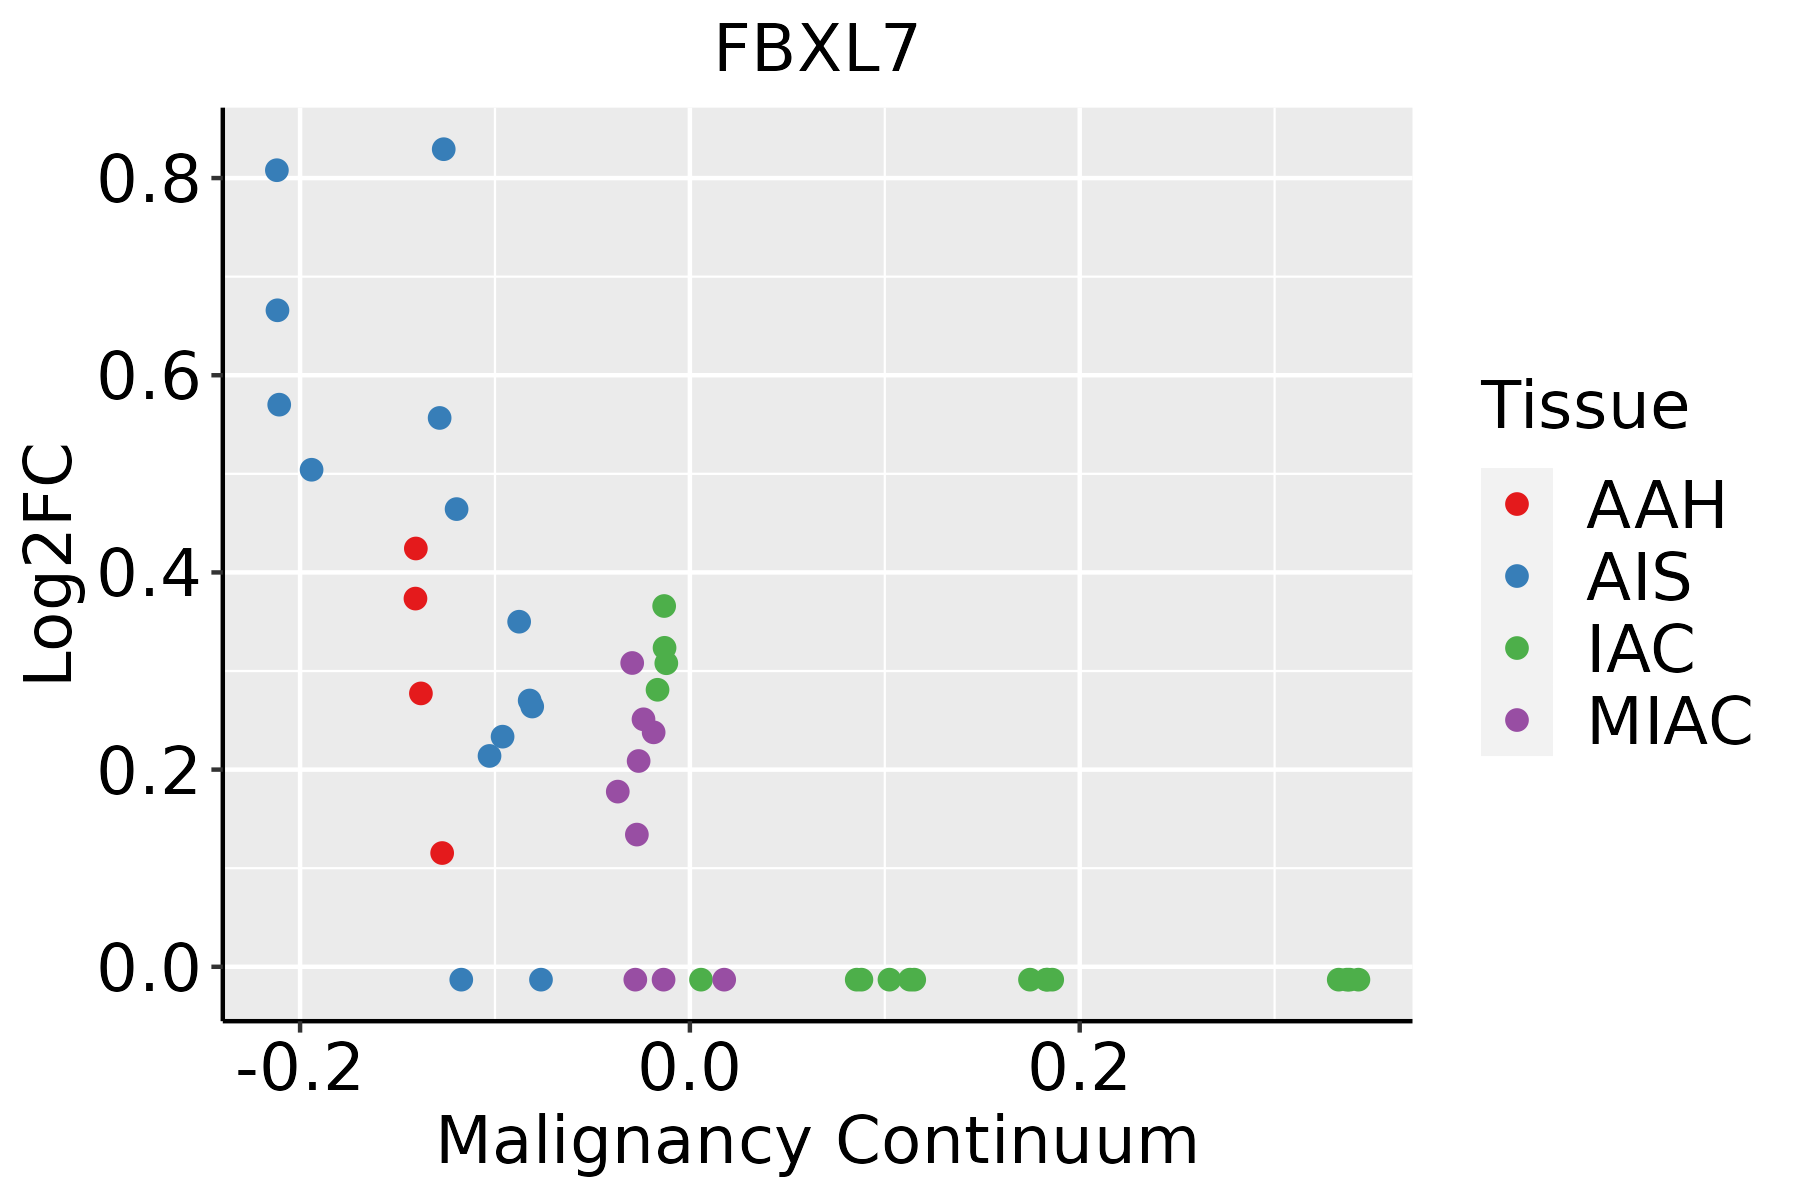 | AAH: Atypical adenomatous hyperplasia |
| AIS: Adenocarcinoma in situ | ||
| IAC: Invasive lung adenocarcinoma | ||
| MIA: Minimally invasive adenocarcinoma | ||
| Prostate | 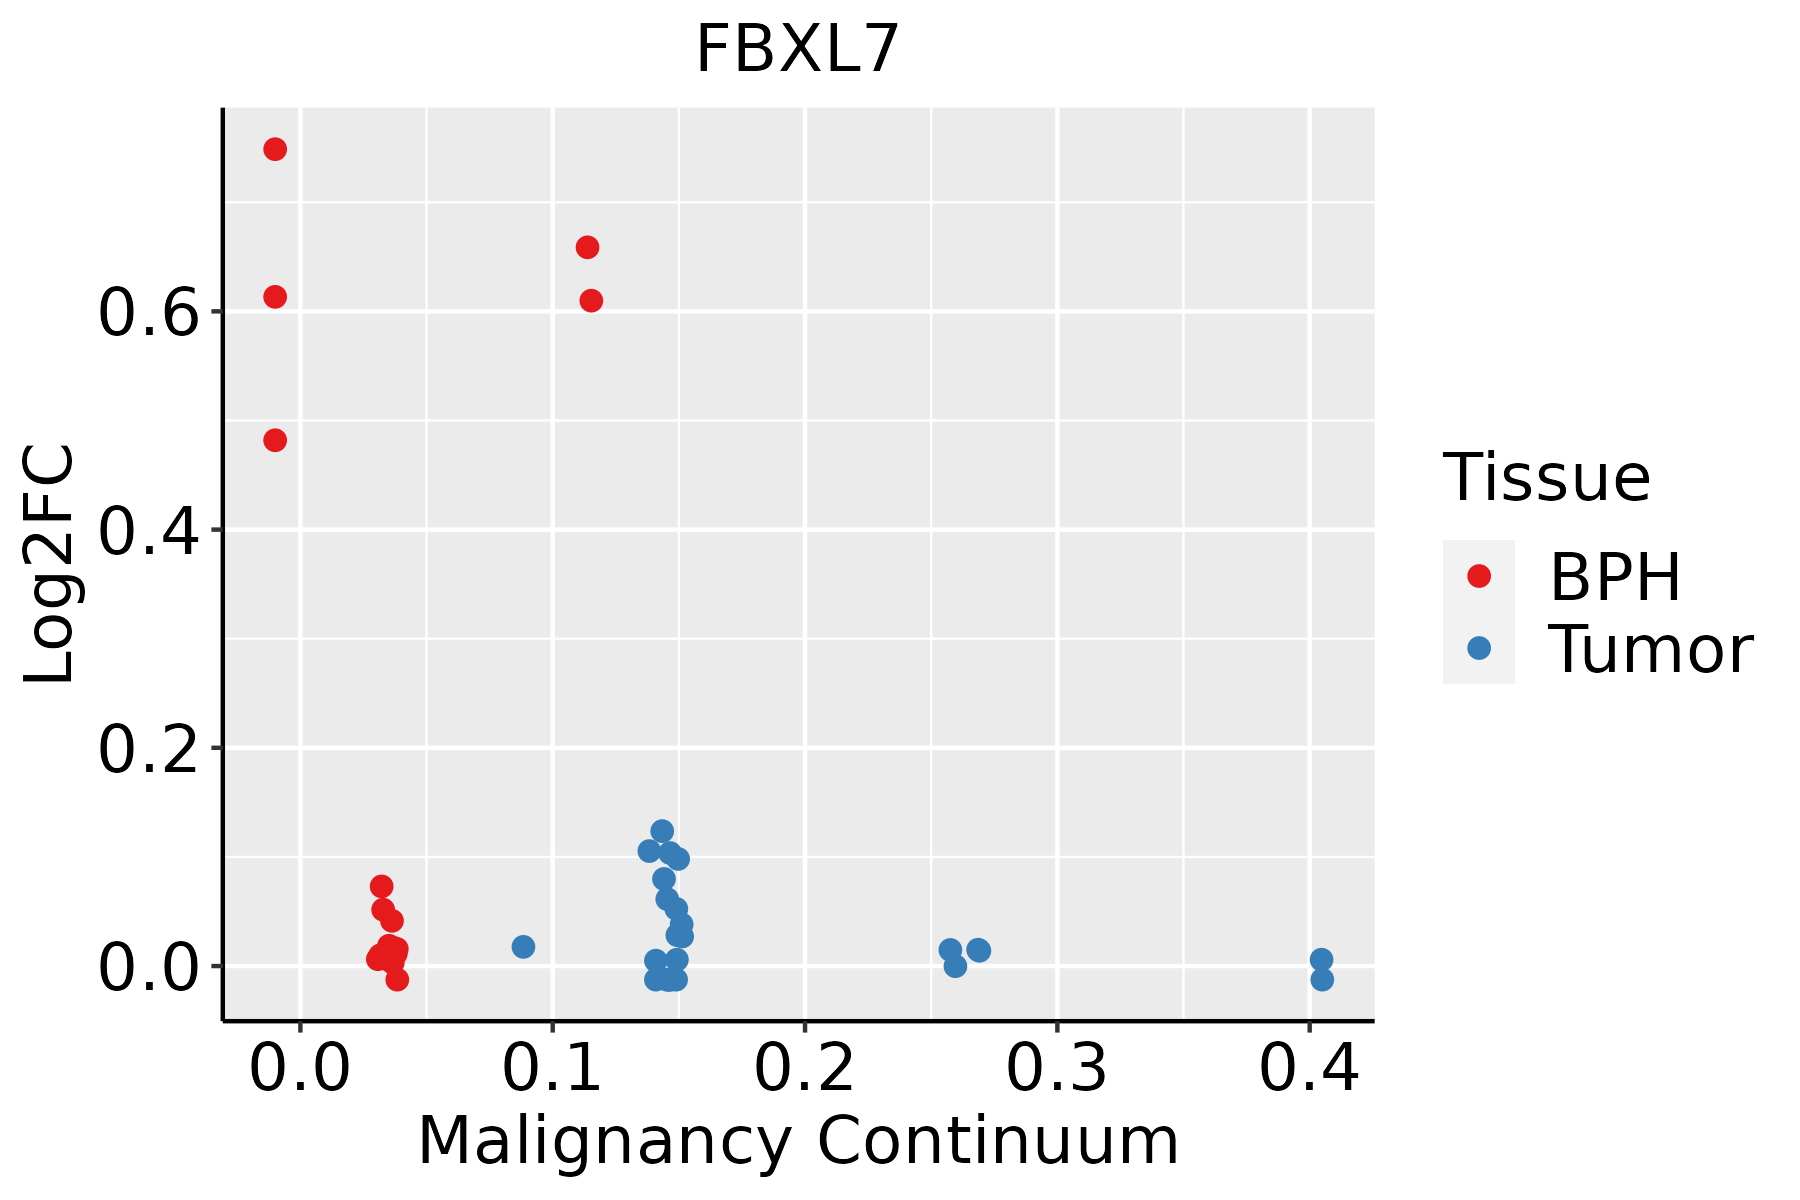 | BPH: Benign Prostatic Hyperplasia |
| Thyroid | 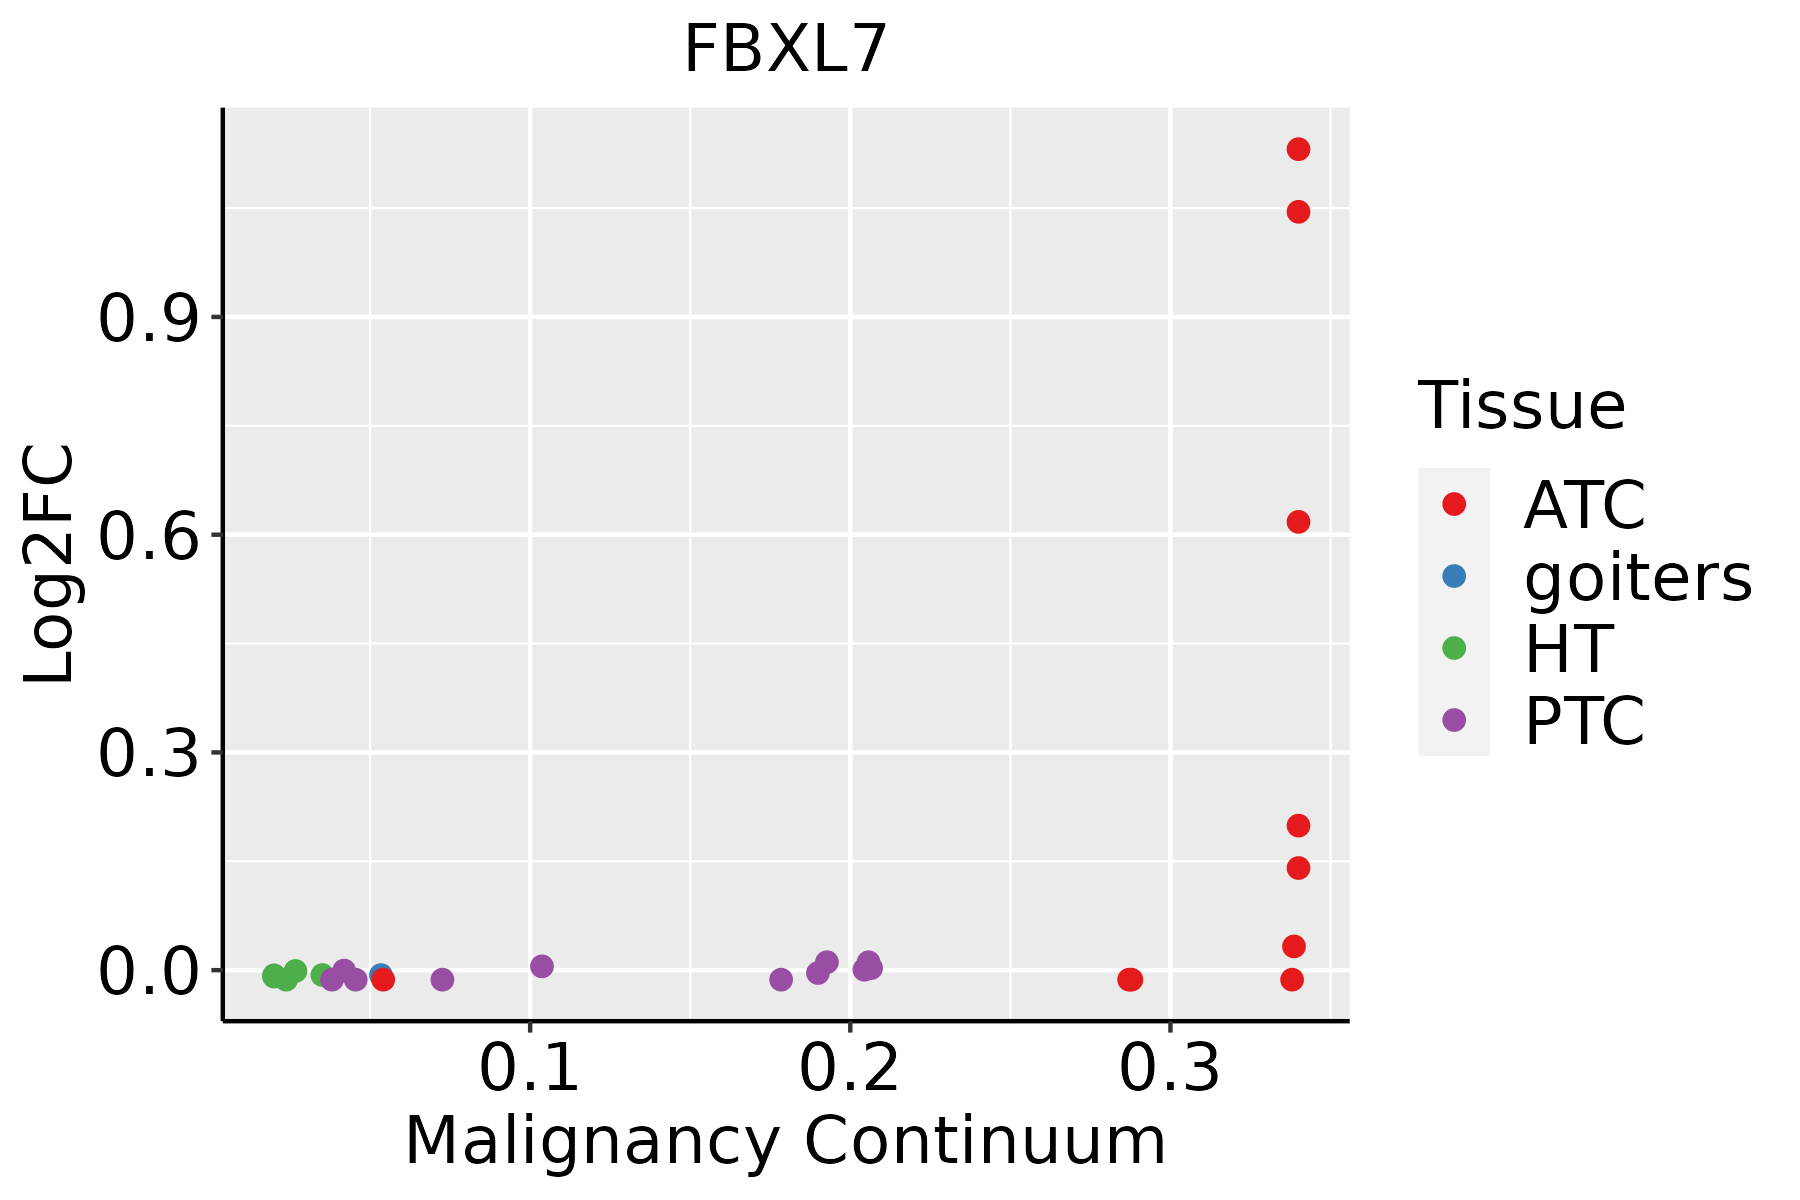 | ATC: Anaplastic thyroid cancer |
| HT: Hashimoto's thyroiditis | ||
| PTC: Papillary thyroid cancer |
| ∗log2FC in expression of this searched gene in stem-like cells from each diseased tissue sample relative to stem-like cells in normal samples in each tissue plotted against the malignancy continuum. Samples are colored based on if they are from different disease stage. |
Top |
Malignant transformation related pathway analysis |
| Find out the enriched GO biological processes and KEGG pathways involved in transition from healthy to precancer to cancer |
| Tissue | Disease Stage | Enriched GO biological Processes |
| Colorectum | AD |  |
| Colorectum | SER |  |
| Colorectum | MSS |  |
| Colorectum | MSI-H |  |
| Colorectum | FAP |  |
| ∗Top 15 enriched GO BP terms are showed in the bar plot of each disease state in each tissue. Each row represents a significant GO biological process which is colored according to the -log10(p.adjust). |
| Page: 1 2 3 4 5 6 7 8 9 |
| GO ID | Tissue | Disease Stage | Description | Gene Ratio | Bg Ratio | pvalue | p.adjust | Count |
| GO:001049816 | Endometrium | AEH | proteasomal protein catabolic process | 108/2100 | 490/18723 | 2.73e-12 | 4.67e-10 | 108 |
| GO:004316116 | Endometrium | AEH | proteasome-mediated ubiquitin-dependent protein catabolic process | 88/2100 | 412/18723 | 1.54e-09 | 1.36e-07 | 88 |
| GO:00002098 | Endometrium | AEH | protein polyubiquitination | 44/2100 | 236/18723 | 4.83e-04 | 4.97e-03 | 44 |
| GO:00447726 | Endometrium | AEH | mitotic cell cycle phase transition | 67/2100 | 424/18723 | 2.37e-03 | 1.78e-02 | 67 |
| GO:001049817 | Endometrium | EEC | proteasomal protein catabolic process | 112/2168 | 490/18723 | 6.99e-13 | 1.40e-10 | 112 |
| GO:004316117 | Endometrium | EEC | proteasome-mediated ubiquitin-dependent protein catabolic process | 92/2168 | 412/18723 | 3.01e-10 | 3.23e-08 | 92 |
| GO:000020913 | Endometrium | EEC | protein polyubiquitination | 46/2168 | 236/18723 | 2.65e-04 | 3.04e-03 | 46 |
| GO:004477213 | Endometrium | EEC | mitotic cell cycle phase transition | 71/2168 | 424/18723 | 8.68e-04 | 7.97e-03 | 71 |
| GO:00447723 | Lung | IAC | mitotic cell cycle phase transition | 85/2061 | 424/18723 | 2.69e-08 | 3.20e-06 | 85 |
| GO:00104988 | Lung | IAC | proteasomal protein catabolic process | 90/2061 | 490/18723 | 6.69e-07 | 3.89e-05 | 90 |
| GO:00431618 | Lung | IAC | proteasome-mediated ubiquitin-dependent protein catabolic process | 78/2061 | 412/18723 | 1.10e-06 | 6.02e-05 | 78 |
| GO:00002096 | Lung | IAC | protein polyubiquitination | 49/2061 | 236/18723 | 8.51e-06 | 2.89e-04 | 49 |
| GO:00448391 | Lung | IAC | cell cycle G2/M phase transition | 29/2061 | 148/18723 | 1.44e-03 | 1.55e-02 | 29 |
| GO:00000861 | Lung | IAC | G2/M transition of mitotic cell cycle | 27/2061 | 137/18723 | 1.88e-03 | 1.92e-02 | 27 |
| GO:004316113 | Lung | AIS | proteasome-mediated ubiquitin-dependent protein catabolic process | 77/1849 | 412/18723 | 2.74e-08 | 3.47e-06 | 77 |
| GO:001049813 | Lung | AIS | proteasomal protein catabolic process | 87/1849 | 490/18723 | 4.15e-08 | 5.03e-06 | 87 |
| GO:000020912 | Lung | AIS | protein polyubiquitination | 49/1849 | 236/18723 | 3.85e-07 | 3.16e-05 | 49 |
| GO:004477211 | Lung | AIS | mitotic cell cycle phase transition | 69/1849 | 424/18723 | 2.23e-05 | 7.42e-04 | 69 |
| GO:001049818 | Prostate | BPH | proteasomal protein catabolic process | 153/3107 | 490/18723 | 4.13e-16 | 7.51e-14 | 153 |
| GO:004316118 | Prostate | BPH | proteasome-mediated ubiquitin-dependent protein catabolic process | 127/3107 | 412/18723 | 3.84e-13 | 3.60e-11 | 127 |
| Page: 1 2 |
| Pathway ID | Tissue | Disease Stage | Description | Gene Ratio | Bg Ratio | pvalue | p.adjust | qvalue | Count |
| Page: 1 |
Top |
Cell-cell communication analysis |
| Identification of potential cell-cell interactions between two cell types and their ligand-receptor pairs for different disease states |
| Ligand | Receptor | LRpair | Pathway | Tissue | Disease Stage |
| Page: 1 |
Top |
Single-cell gene regulatory network inference analysis |
| Find out the significant the regulons (TFs) and the target genes of each regulon across cell types for different disease states |
| TF | Cell Type | Tissue | Disease Stage | Target Gene | RSS | Regulon Activity |
| ∗The dot plots of a searched regulon are shown for all cell subpopulations in each disease state of each tissue based on the regulon specific score inferred using pySCENIC and by calculating the average expression. |
| Page: 1 |
Top |
Somatic mutation of malignant transformation related genes |
| Annotation of somatic variants for genes involved in malignant transformation |
| Hugo Symbol | Variant Class | Variant Classification | dbSNP RS | HGVSc | HGVSp | HGVSp Short | SWISSPROT | BIOTYPE | SIFT | PolyPhen | Tumor Sample Barcode | Tissue | Histology | Sex | Age | Stage | Therapy Types | Drugs | Outcome |
| FBXL7 | SNV | Missense_Mutation | rs532860622 | c.1051N>T | p.Arg351Cys | p.R351C | Q9UJT9 | protein_coding | tolerated(0.2) | benign(0.006) | TCGA-AN-A0FJ-01 | Breast | breast invasive carcinoma | Female | <65 | III/IV | Unknown | Unknown | SD |
| FBXL7 | SNV | Missense_Mutation | c.1148N>T | p.Ala383Val | p.A383V | Q9UJT9 | protein_coding | tolerated(0.49) | benign(0.194) | TCGA-BH-A1EN-01 | Breast | breast invasive carcinoma | Female | >=65 | I/II | Unknown | Unknown | SD | |
| FBXL7 | SNV | Missense_Mutation | c.347N>A | p.Arg116Gln | p.R116Q | Q9UJT9 | protein_coding | tolerated(0.47) | benign(0.037) | TCGA-BH-A1F2-01 | Breast | breast invasive carcinoma | Female | <65 | III/IV | Unknown | Unknown | SD | |
| FBXL7 | SNV | Missense_Mutation | rs766340086 | c.1228N>A | p.Gly410Ser | p.G410S | Q9UJT9 | protein_coding | deleterious(0) | probably_damaging(0.998) | TCGA-C8-A1HM-01 | Breast | breast invasive carcinoma | Female | >=65 | I/II | Chemotherapy | doxorubicin | CR |
| FBXL7 | insertion | Nonsense_Mutation | novel | c.1091_1092insTTTGGGAGGCCAGGGTGGGCAGATCACCTGAGGTCAGGAGTT | p.Thr364_Asp365insLeuGlyGlyGlnGlyGlyGlnIleThrTerGlyGlnGluPhe | p.T364_D365insLGGQGGQIT*GQEF | Q9UJT9 | protein_coding | TCGA-AN-A0AL-01 | Breast | breast invasive carcinoma | Female | <65 | III/IV | Unknown | Unknown | SD | ||
| FBXL7 | SNV | Missense_Mutation | rs201326066 | c.688G>A | p.Val230Ile | p.V230I | Q9UJT9 | protein_coding | tolerated(0.57) | benign(0) | TCGA-2W-A8YY-01 | Cervix | cervical & endocervical cancer | Female | <65 | I/II | Chemotherapy | cisplatin | CR |
| FBXL7 | SNV | Missense_Mutation | novel | c.733N>A | p.Val245Met | p.V245M | Q9UJT9 | protein_coding | deleterious(0.02) | possibly_damaging(0.851) | TCGA-EA-A3HS-01 | Cervix | cervical & endocervical cancer | Female | <65 | I/II | Unknown | Unknown | SD |
| FBXL7 | SNV | Missense_Mutation | novel | c.706N>A | p.Leu236Ile | p.L236I | Q9UJT9 | protein_coding | tolerated(0.11) | benign(0.058) | TCGA-ZJ-AAXU-01 | Cervix | cervical & endocervical cancer | Female | <65 | I/II | Unknown | Unknown | SD |
| FBXL7 | SNV | Missense_Mutation | c.1235N>T | p.Cys412Phe | p.C412F | Q9UJT9 | protein_coding | deleterious(0) | probably_damaging(1) | TCGA-A6-3809-01 | Colorectum | colon adenocarcinoma | Female | >=65 | I/II | Unknown | Unknown | SD | |
| FBXL7 | SNV | Missense_Mutation | rs767178690 | c.1439G>A | p.Arg480His | p.R480H | Q9UJT9 | protein_coding | deleterious(0) | probably_damaging(0.932) | TCGA-A6-A567-01 | Colorectum | colon adenocarcinoma | Male | <65 | III/IV | Unknown | Unknown | PD |
| Page: 1 2 3 4 5 6 7 8 9 10 11 12 13 14 15 16 17 18 |
Top |
Related drugs of malignant transformation related genes |
| Identification of chemicals and drugs interact with genes involved in malignant transfromation |
| (DGIdb 4.0) |
| Entrez ID | Symbol | Category | Interaction Types | Drug Claim Name | Drug Name | PMIDs |
| Page: 1 |

Copyright 2023-Present -The University of Texas Health Science Center at Houston |