
|
|||||
|
 | |
| |
| |
| |
| |
| |
|
Gene: FBXL5 |
Gene summary for FBXL5 |
| Gene information | Species | Human | Gene symbol | FBXL5 | Gene ID | 26234 |
| Gene name | F-box and leucine rich repeat protein 5 | |
| Gene Alias | FBL4 | |
| Cytomap | 4p15.32 | |
| Gene Type | protein-coding | GO ID | GO:0006464 | UniProtAcc | Q9UKA1 |
Top |
Malignant transformation analysis |
| Identification of the aberrant gene expression in precancerous and cancerous lesions by comparing the gene expression of stem-like cells in diseased tissues with normal stem cells |
| Entrez ID | Symbol | Replicates | Species | Organ | Tissue | Adj P-value | Log2FC | Malignancy |
| 26234 | FBXL5 | CCI_1 | Human | Cervix | CC | 4.13e-04 | 7.02e-01 | 0.528 |
| 26234 | FBXL5 | CCI_2 | Human | Cervix | CC | 1.54e-03 | 5.94e-01 | 0.5249 |
| 26234 | FBXL5 | LZE2T | Human | Esophagus | ESCC | 1.02e-05 | 4.01e-01 | 0.082 |
| 26234 | FBXL5 | LZE4T | Human | Esophagus | ESCC | 1.65e-17 | 3.13e-01 | 0.0811 |
| 26234 | FBXL5 | LZE5T | Human | Esophagus | ESCC | 4.39e-02 | 1.19e-01 | 0.0514 |
| 26234 | FBXL5 | LZE7T | Human | Esophagus | ESCC | 6.29e-11 | 7.31e-01 | 0.0667 |
| 26234 | FBXL5 | LZE8T | Human | Esophagus | ESCC | 7.33e-11 | 5.38e-01 | 0.067 |
| 26234 | FBXL5 | LZE20T | Human | Esophagus | ESCC | 1.19e-11 | 2.48e-01 | 0.0662 |
| 26234 | FBXL5 | LZE24T | Human | Esophagus | ESCC | 6.06e-13 | 3.62e-01 | 0.0596 |
| 26234 | FBXL5 | LZE6T | Human | Esophagus | ESCC | 7.95e-08 | 4.66e-01 | 0.0845 |
| 26234 | FBXL5 | P1T-E | Human | Esophagus | ESCC | 2.99e-11 | 5.23e-01 | 0.0875 |
| 26234 | FBXL5 | P2T-E | Human | Esophagus | ESCC | 7.25e-34 | 7.64e-01 | 0.1177 |
| 26234 | FBXL5 | P4T-E | Human | Esophagus | ESCC | 7.67e-22 | 5.12e-01 | 0.1323 |
| 26234 | FBXL5 | P5T-E | Human | Esophagus | ESCC | 2.48e-11 | 1.47e-01 | 0.1327 |
| 26234 | FBXL5 | P8T-E | Human | Esophagus | ESCC | 2.09e-27 | 5.84e-01 | 0.0889 |
| 26234 | FBXL5 | P9T-E | Human | Esophagus | ESCC | 8.02e-16 | 4.80e-01 | 0.1131 |
| 26234 | FBXL5 | P10T-E | Human | Esophagus | ESCC | 2.34e-31 | 6.10e-01 | 0.116 |
| 26234 | FBXL5 | P11T-E | Human | Esophagus | ESCC | 7.80e-25 | 8.98e-01 | 0.1426 |
| 26234 | FBXL5 | P12T-E | Human | Esophagus | ESCC | 5.15e-30 | 6.59e-01 | 0.1122 |
| 26234 | FBXL5 | P15T-E | Human | Esophagus | ESCC | 1.50e-16 | 3.38e-01 | 0.1149 |
| Page: 1 2 3 4 5 6 |
| Tissue | Expression Dynamics | Abbreviation |
| Cervix | 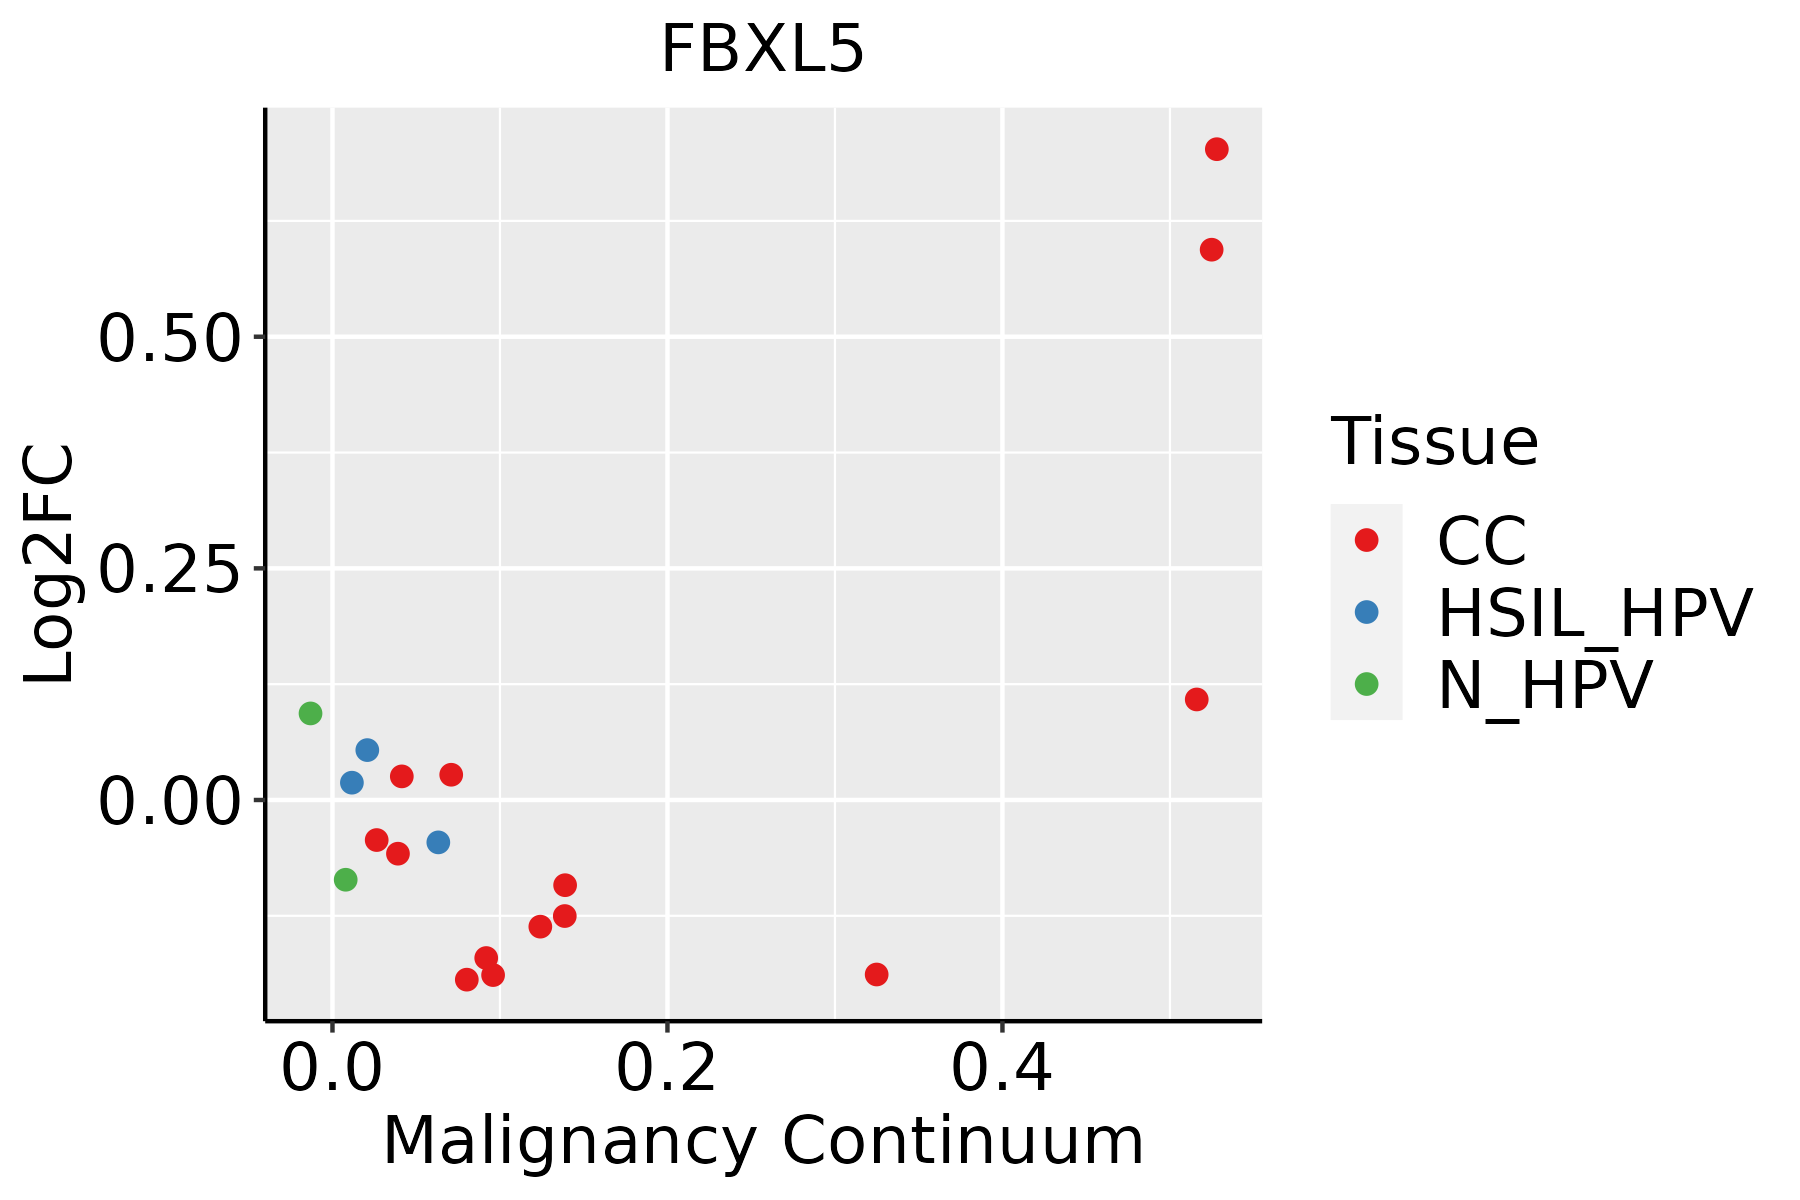 | CC: Cervix cancer |
| HSIL_HPV: HPV-infected high-grade squamous intraepithelial lesions | ||
| N_HPV: HPV-infected normal cervix | ||
| Esophagus |  | ESCC: Esophageal squamous cell carcinoma |
| HGIN: High-grade intraepithelial neoplasias | ||
| LGIN: Low-grade intraepithelial neoplasias | ||
| Liver | 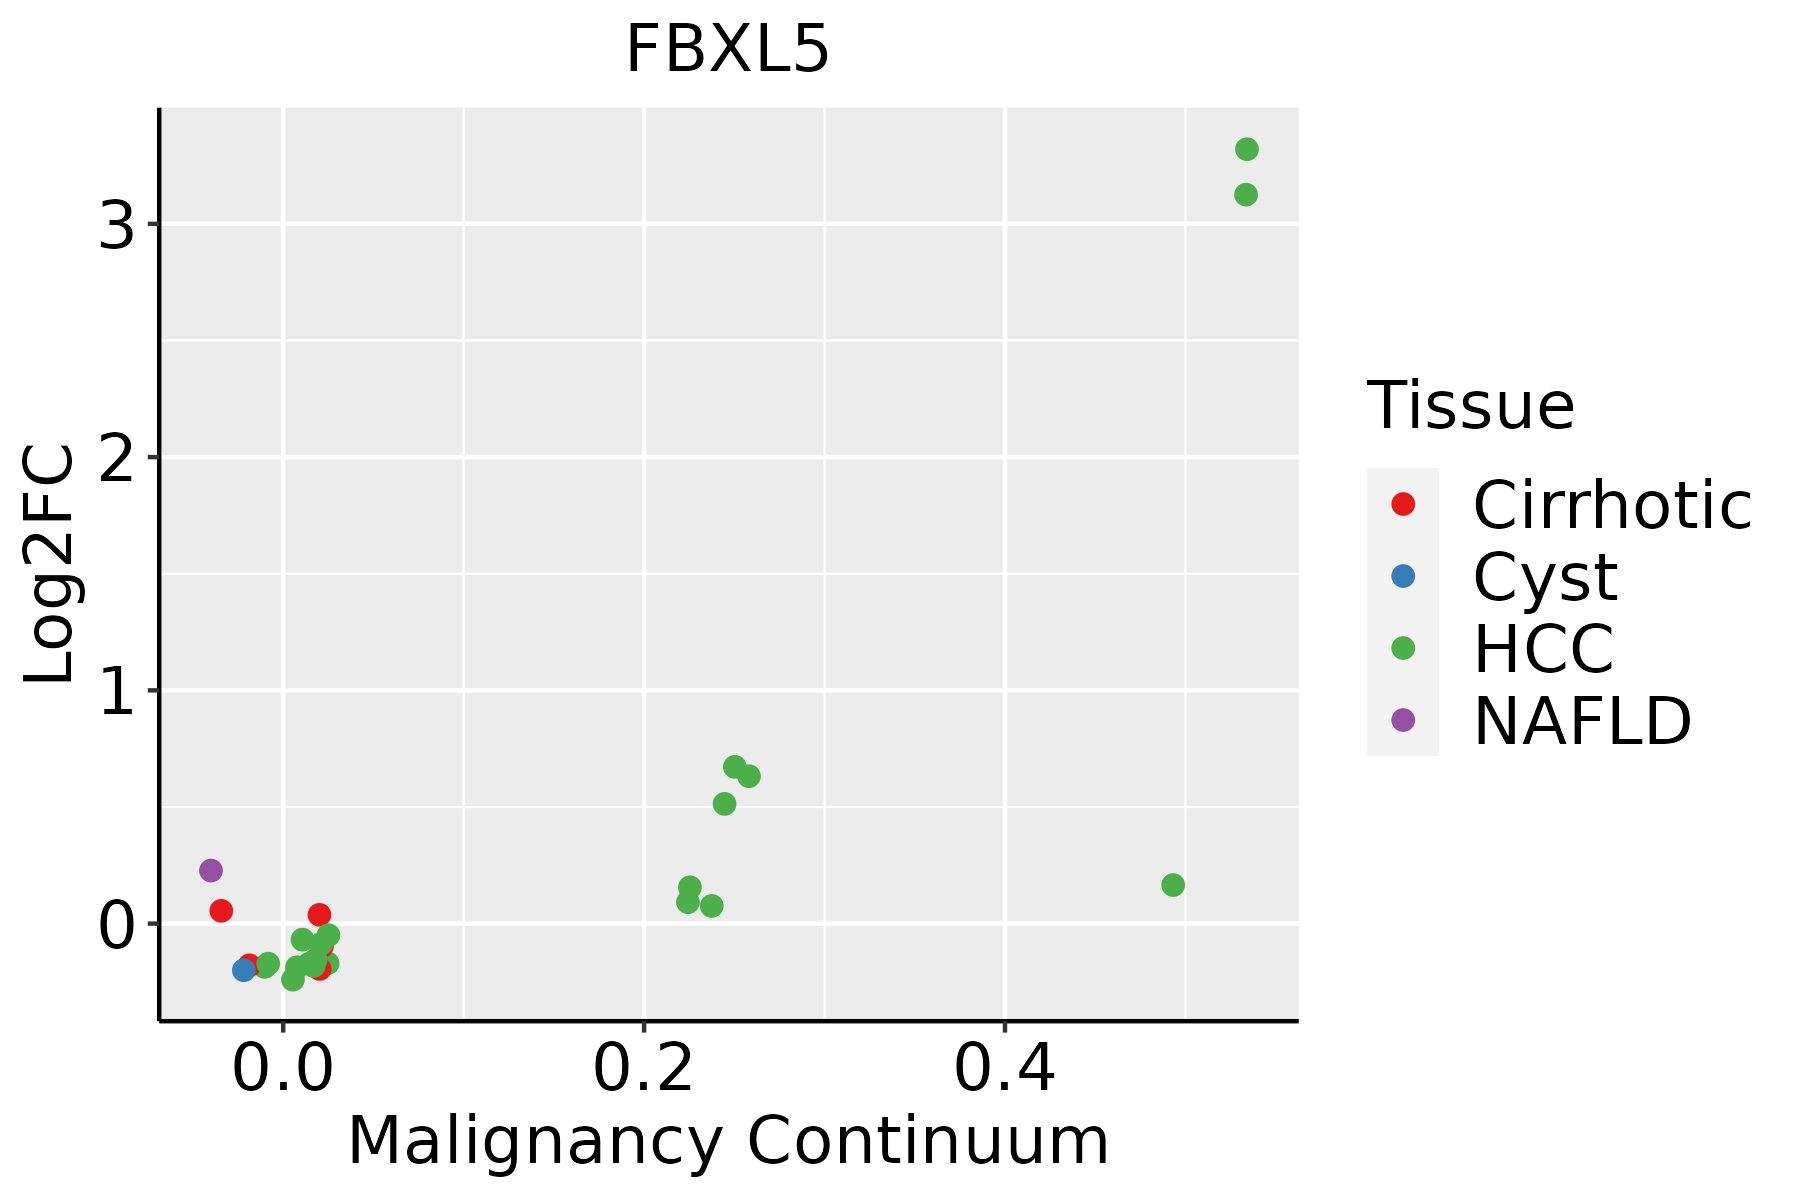 | HCC: Hepatocellular carcinoma |
| NAFLD: Non-alcoholic fatty liver disease | ||
| Oral Cavity |  | EOLP: Erosive Oral lichen planus |
| LP: leukoplakia | ||
| NEOLP: Non-erosive oral lichen planus | ||
| OSCC: Oral squamous cell carcinoma | ||
| Skin | 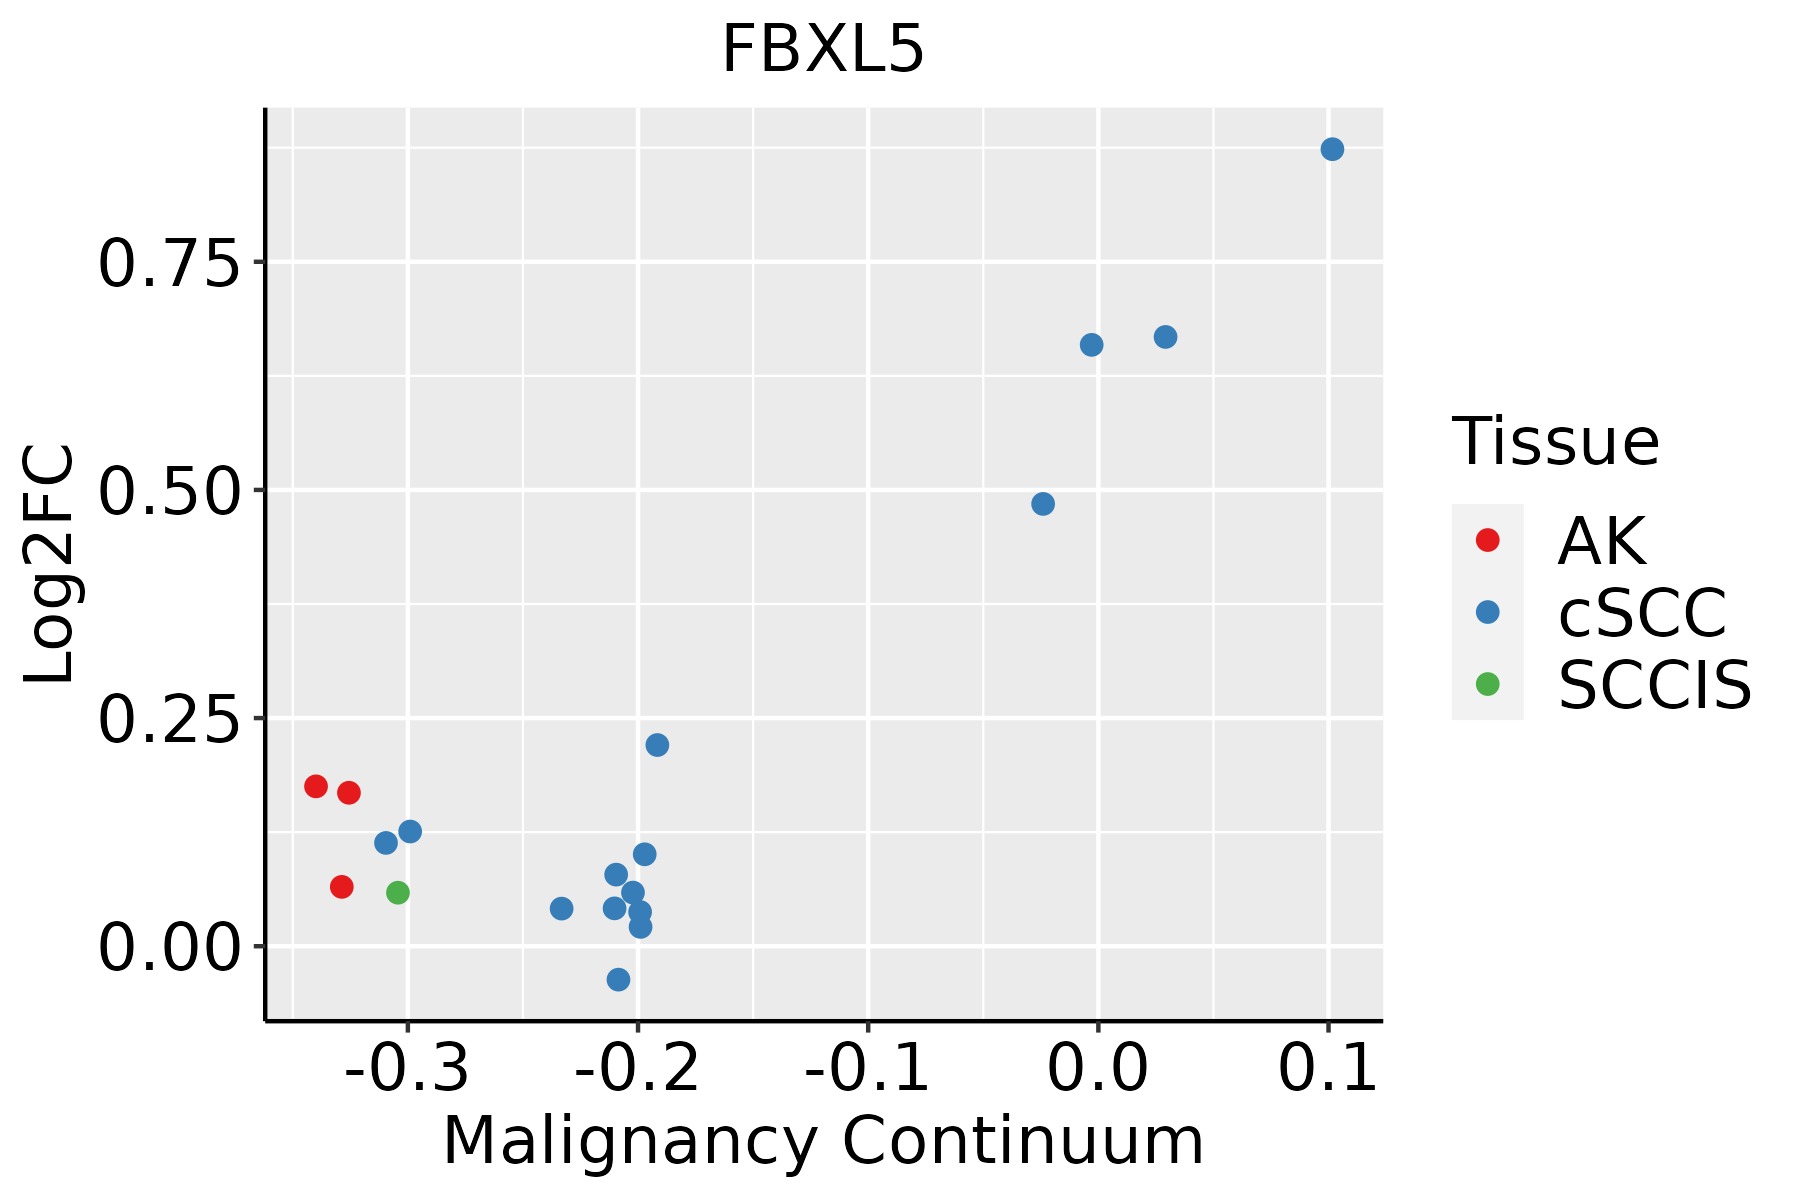 | AK: Actinic keratosis |
| cSCC: Cutaneous squamous cell carcinoma | ||
| SCCIS:squamous cell carcinoma in situ | ||
| Thyroid |  | ATC: Anaplastic thyroid cancer |
| HT: Hashimoto's thyroiditis | ||
| PTC: Papillary thyroid cancer |
| ∗log2FC in expression of this searched gene in stem-like cells from each diseased tissue sample relative to stem-like cells in normal samples in each tissue plotted against the malignancy continuum. Samples are colored based on if they are from different disease stage. |
Top |
Malignant transformation related pathway analysis |
| Find out the enriched GO biological processes and KEGG pathways involved in transition from healthy to precancer to cancer |
| Tissue | Disease Stage | Enriched GO biological Processes |
| Colorectum | AD |  |
| Colorectum | SER |  |
| Colorectum | MSS |  |
| Colorectum | MSI-H |  |
| Colorectum | FAP |  |
| ∗Top 15 enriched GO BP terms are showed in the bar plot of each disease state in each tissue. Each row represents a significant GO biological process which is colored according to the -log10(p.adjust). |
| Page: 1 2 3 4 5 6 7 8 9 |
| GO ID | Tissue | Disease Stage | Description | Gene Ratio | Bg Ratio | pvalue | p.adjust | Count |
| GO:004217610 | Cervix | CC | regulation of protein catabolic process | 104/2311 | 391/18723 | 9.39e-15 | 9.36e-12 | 104 |
| GO:190336210 | Cervix | CC | regulation of cellular protein catabolic process | 72/2311 | 255/18723 | 5.98e-12 | 2.10e-09 | 72 |
| GO:004573210 | Cervix | CC | positive regulation of protein catabolic process | 65/2311 | 231/18723 | 7.44e-11 | 1.39e-08 | 65 |
| GO:001049810 | Cervix | CC | proteasomal protein catabolic process | 111/2311 | 490/18723 | 8.98e-11 | 1.58e-08 | 111 |
| GO:000989610 | Cervix | CC | positive regulation of catabolic process | 109/2311 | 492/18723 | 5.26e-10 | 6.99e-08 | 109 |
| GO:004316110 | Cervix | CC | proteasome-mediated ubiquitin-dependent protein catabolic process | 91/2311 | 412/18723 | 1.65e-08 | 1.25e-06 | 91 |
| GO:003133110 | Cervix | CC | positive regulation of cellular catabolic process | 91/2311 | 427/18723 | 9.64e-08 | 5.25e-06 | 91 |
| GO:190336410 | Cervix | CC | positive regulation of cellular protein catabolic process | 43/2311 | 155/18723 | 1.80e-07 | 8.28e-06 | 43 |
| GO:00550726 | Cervix | CC | iron ion homeostasis | 19/2311 | 85/18723 | 6.88e-03 | 3.74e-02 | 19 |
| GO:00550768 | Cervix | CC | transition metal ion homeostasis | 27/2311 | 138/18723 | 9.89e-03 | 4.85e-02 | 27 |
| GO:0010498111 | Esophagus | ESCC | proteasomal protein catabolic process | 369/8552 | 490/18723 | 1.13e-41 | 1.80e-38 | 369 |
| GO:0043161111 | Esophagus | ESCC | proteasome-mediated ubiquitin-dependent protein catabolic process | 312/8552 | 412/18723 | 3.53e-36 | 4.48e-33 | 312 |
| GO:0042176111 | Esophagus | ESCC | regulation of protein catabolic process | 280/8552 | 391/18723 | 8.65e-26 | 2.39e-23 | 280 |
| GO:0009896111 | Esophagus | ESCC | positive regulation of catabolic process | 332/8552 | 492/18723 | 4.36e-23 | 9.22e-21 | 332 |
| GO:0031331111 | Esophagus | ESCC | positive regulation of cellular catabolic process | 292/8552 | 427/18723 | 8.67e-22 | 1.53e-19 | 292 |
| GO:1903362111 | Esophagus | ESCC | regulation of cellular protein catabolic process | 188/8552 | 255/18723 | 5.12e-20 | 6.62e-18 | 188 |
| GO:0045732111 | Esophagus | ESCC | positive regulation of protein catabolic process | 167/8552 | 231/18723 | 1.47e-16 | 1.14e-14 | 167 |
| GO:1903364111 | Esophagus | ESCC | positive regulation of cellular protein catabolic process | 117/8552 | 155/18723 | 3.25e-14 | 1.66e-12 | 117 |
| GO:005507617 | Esophagus | ESCC | transition metal ion homeostasis | 87/8552 | 138/18723 | 2.85e-05 | 2.37e-04 | 87 |
| GO:00311461 | Esophagus | ESCC | SCF-dependent proteasomal ubiquitin-dependent protein catabolic process | 33/8552 | 49/18723 | 1.80e-03 | 8.26e-03 | 33 |
| Page: 1 2 3 4 5 |
| Pathway ID | Tissue | Disease Stage | Description | Gene Ratio | Bg Ratio | pvalue | p.adjust | qvalue | Count |
| Page: 1 |
Top |
Cell-cell communication analysis |
| Identification of potential cell-cell interactions between two cell types and their ligand-receptor pairs for different disease states |
| Ligand | Receptor | LRpair | Pathway | Tissue | Disease Stage |
| Page: 1 |
Top |
Single-cell gene regulatory network inference analysis |
| Find out the significant the regulons (TFs) and the target genes of each regulon across cell types for different disease states |
| TF | Cell Type | Tissue | Disease Stage | Target Gene | RSS | Regulon Activity |
| ∗The dot plots of a searched regulon are shown for all cell subpopulations in each disease state of each tissue based on the regulon specific score inferred using pySCENIC and by calculating the average expression. |
| Page: 1 |
Top |
Somatic mutation of malignant transformation related genes |
| Annotation of somatic variants for genes involved in malignant transformation |
| Hugo Symbol | Variant Class | Variant Classification | dbSNP RS | HGVSc | HGVSp | HGVSp Short | SWISSPROT | BIOTYPE | SIFT | PolyPhen | Tumor Sample Barcode | Tissue | Histology | Sex | Age | Stage | Therapy Types | Drugs | Outcome |
| FBXL5 | SNV | Missense_Mutation | novel | c.365A>C | p.Asp122Ala | p.D122A | Q9UKA1 | protein_coding | deleterious(0.01) | possibly_damaging(0.871) | TCGA-AN-A046-01 | Breast | breast invasive carcinoma | Female | >=65 | I/II | Unknown | Unknown | SD |
| FBXL5 | SNV | Missense_Mutation | c.1430C>A | p.Pro477His | p.P477H | Q9UKA1 | protein_coding | deleterious_low_confidence(0) | benign(0.41) | TCGA-C8-A133-01 | Breast | breast invasive carcinoma | Female | >=65 | III/IV | Unknown | Unknown | SD | |
| FBXL5 | SNV | Missense_Mutation | c.481N>G | p.Gln161Glu | p.Q161E | Q9UKA1 | protein_coding | tolerated(0.09) | benign(0.022) | TCGA-C8-A274-01 | Breast | breast invasive carcinoma | Female | <65 | I/II | Hormone Therapy | tamoxiphen | SD | |
| FBXL5 | SNV | Missense_Mutation | c.911C>T | p.Ser304Leu | p.S304L | Q9UKA1 | protein_coding | deleterious(0.02) | benign(0.272) | TCGA-E9-A1RD-01 | Breast | breast invasive carcinoma | Female | >=65 | I/II | Hormone Therapy | tamoxiphen | SD | |
| FBXL5 | SNV | Missense_Mutation | c.2066N>G | p.Ser689Cys | p.S689C | Q9UKA1 | protein_coding | deleterious(0) | probably_damaging(0.996) | TCGA-EX-A1H6-01 | Cervix | cervical & endocervical cancer | Female | <65 | I/II | Unknown | Unknown | SD | |
| FBXL5 | SNV | Missense_Mutation | c.899N>A | p.Ser300Tyr | p.S300Y | Q9UKA1 | protein_coding | deleterious(0) | benign(0.172) | TCGA-AA-3833-01 | Colorectum | colon adenocarcinoma | Female | <65 | I/II | Unknown | Unknown | SD | |
| FBXL5 | SNV | Missense_Mutation | c.552N>A | p.Phe184Leu | p.F184L | Q9UKA1 | protein_coding | tolerated(0.82) | benign(0) | TCGA-AD-A5EJ-01 | Colorectum | colon adenocarcinoma | Female | >=65 | I/II | Unknown | Unknown | SD | |
| FBXL5 | SNV | Missense_Mutation | c.122N>A | p.Arg41His | p.R41H | Q9UKA1 | protein_coding | deleterious(0.02) | benign(0.029) | TCGA-AZ-4313-01 | Colorectum | colon adenocarcinoma | Female | <65 | I/II | Unknown | Unknown | SD | |
| FBXL5 | SNV | Missense_Mutation | novel | c.1990N>T | p.Asn664Tyr | p.N664Y | Q9UKA1 | protein_coding | tolerated(0.1) | probably_damaging(0.922) | TCGA-CA-6717-01 | Colorectum | colon adenocarcinoma | Male | <65 | I/II | Chemotherapy | oxaliplatin | CR |
| FBXL5 | SNV | Missense_Mutation | c.417N>T | p.Met139Ile | p.M139I | Q9UKA1 | protein_coding | tolerated(0.13) | possibly_damaging(0.885) | TCGA-CA-6717-01 | Colorectum | colon adenocarcinoma | Male | <65 | I/II | Chemotherapy | oxaliplatin | CR |
| Page: 1 2 3 4 5 6 7 |
Top |
Related drugs of malignant transformation related genes |
| Identification of chemicals and drugs interact with genes involved in malignant transfromation |
| (DGIdb 4.0) |
| Entrez ID | Symbol | Category | Interaction Types | Drug Claim Name | Drug Name | PMIDs |
| Page: 1 |

Copyright 2023-Present -The University of Texas Health Science Center at Houston |