
|
|||||
|
 | |
| |
| |
| |
| |
| |
|
Gene: FBXL3 |
Gene summary for FBXL3 |
| Gene information | Species | Human | Gene symbol | FBXL3 | Gene ID | 26224 |
| Gene name | F-box and leucine rich repeat protein 3 | |
| Gene Alias | FBL3 | |
| Cytomap | 13q22.3 | |
| Gene Type | protein-coding | GO ID | GO:0000086 | UniProtAcc | Q9UKT7 |
Top |
Malignant transformation analysis |
| Identification of the aberrant gene expression in precancerous and cancerous lesions by comparing the gene expression of stem-like cells in diseased tissues with normal stem cells |
| Entrez ID | Symbol | Replicates | Species | Organ | Tissue | Adj P-value | Log2FC | Malignancy |
| 26224 | FBXL3 | LZE2T | Human | Esophagus | ESCC | 4.07e-02 | 4.41e-01 | 0.082 |
| 26224 | FBXL3 | LZE4T | Human | Esophagus | ESCC | 2.31e-03 | 8.49e-02 | 0.0811 |
| 26224 | FBXL3 | LZE7T | Human | Esophagus | ESCC | 1.76e-06 | 8.24e-02 | 0.0667 |
| 26224 | FBXL3 | LZE24T | Human | Esophagus | ESCC | 1.02e-09 | 1.82e-01 | 0.0596 |
| 26224 | FBXL3 | LZE21T | Human | Esophagus | ESCC | 2.27e-07 | 1.99e-01 | 0.0655 |
| 26224 | FBXL3 | P1T-E | Human | Esophagus | ESCC | 4.99e-03 | 2.81e-01 | 0.0875 |
| 26224 | FBXL3 | P2T-E | Human | Esophagus | ESCC | 1.72e-18 | 3.55e-01 | 0.1177 |
| 26224 | FBXL3 | P4T-E | Human | Esophagus | ESCC | 1.16e-22 | 4.82e-01 | 0.1323 |
| 26224 | FBXL3 | P5T-E | Human | Esophagus | ESCC | 8.74e-07 | 4.60e-02 | 0.1327 |
| 26224 | FBXL3 | P8T-E | Human | Esophagus | ESCC | 2.13e-20 | 2.54e-01 | 0.0889 |
| 26224 | FBXL3 | P9T-E | Human | Esophagus | ESCC | 1.97e-14 | 3.49e-01 | 0.1131 |
| 26224 | FBXL3 | P10T-E | Human | Esophagus | ESCC | 1.01e-19 | 3.23e-01 | 0.116 |
| 26224 | FBXL3 | P11T-E | Human | Esophagus | ESCC | 1.07e-10 | 3.36e-01 | 0.1426 |
| 26224 | FBXL3 | P12T-E | Human | Esophagus | ESCC | 1.94e-17 | 2.83e-01 | 0.1122 |
| 26224 | FBXL3 | P15T-E | Human | Esophagus | ESCC | 1.26e-12 | 3.46e-01 | 0.1149 |
| 26224 | FBXL3 | P16T-E | Human | Esophagus | ESCC | 1.15e-10 | 1.63e-01 | 0.1153 |
| 26224 | FBXL3 | P20T-E | Human | Esophagus | ESCC | 9.65e-06 | 1.18e-01 | 0.1124 |
| 26224 | FBXL3 | P21T-E | Human | Esophagus | ESCC | 6.62e-14 | 1.26e-01 | 0.1617 |
| 26224 | FBXL3 | P22T-E | Human | Esophagus | ESCC | 1.17e-08 | 2.31e-02 | 0.1236 |
| 26224 | FBXL3 | P23T-E | Human | Esophagus | ESCC | 1.27e-09 | 4.27e-01 | 0.108 |
| Page: 1 2 3 4 |
| Tissue | Expression Dynamics | Abbreviation |
| Esophagus | 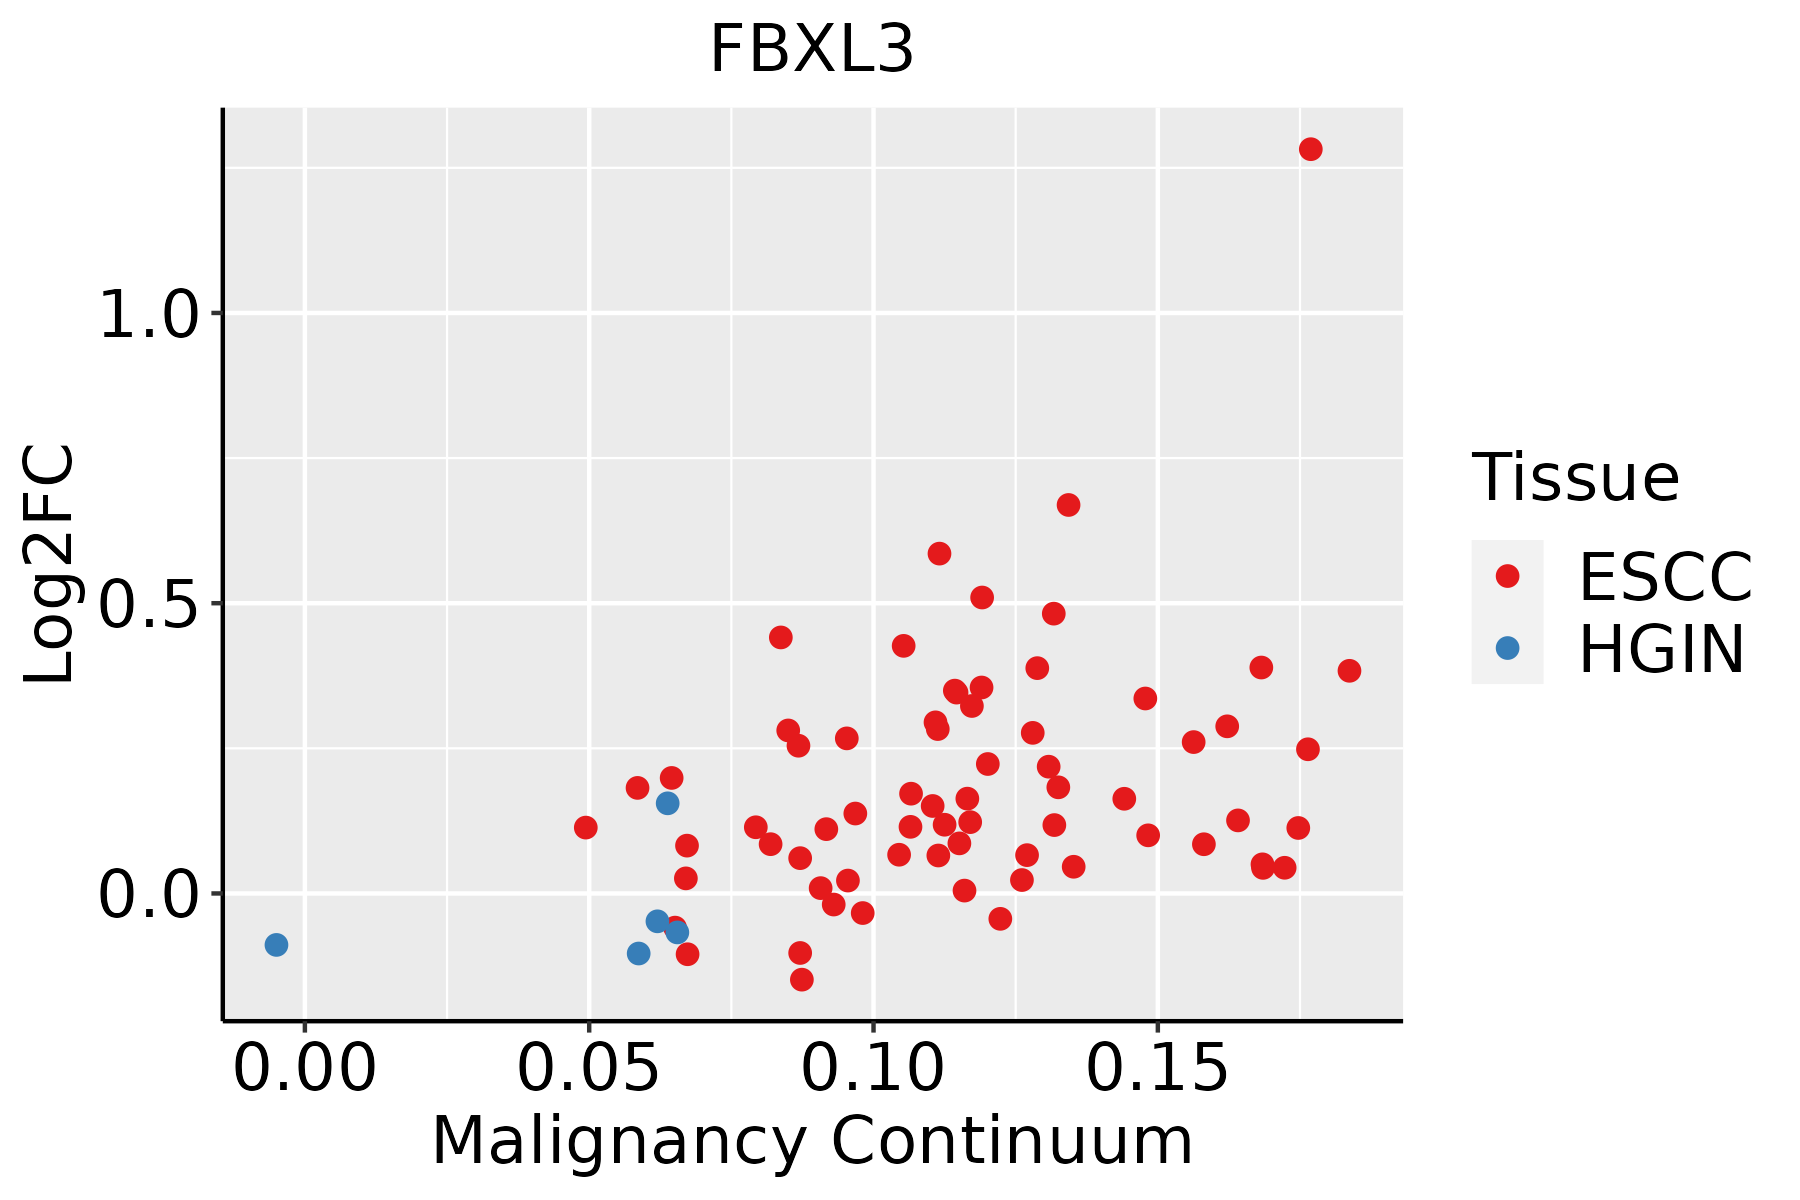 | ESCC: Esophageal squamous cell carcinoma |
| HGIN: High-grade intraepithelial neoplasias | ||
| LGIN: Low-grade intraepithelial neoplasias | ||
| Oral Cavity |  | EOLP: Erosive Oral lichen planus |
| LP: leukoplakia | ||
| NEOLP: Non-erosive oral lichen planus | ||
| OSCC: Oral squamous cell carcinoma |
| ∗log2FC in expression of this searched gene in stem-like cells from each diseased tissue sample relative to stem-like cells in normal samples in each tissue plotted against the malignancy continuum. Samples are colored based on if they are from different disease stage. |
Top |
Malignant transformation related pathway analysis |
| Find out the enriched GO biological processes and KEGG pathways involved in transition from healthy to precancer to cancer |
| Tissue | Disease Stage | Enriched GO biological Processes |
| Colorectum | AD |  |
| Colorectum | SER |  |
| Colorectum | MSS |  |
| Colorectum | MSI-H |  |
| Colorectum | FAP |  |
| ∗Top 15 enriched GO BP terms are showed in the bar plot of each disease state in each tissue. Each row represents a significant GO biological process which is colored according to the -log10(p.adjust). |
| Page: 1 2 3 4 5 6 7 8 9 |
| GO ID | Tissue | Disease Stage | Description | Gene Ratio | Bg Ratio | pvalue | p.adjust | Count |
| GO:0010498111 | Esophagus | ESCC | proteasomal protein catabolic process | 369/8552 | 490/18723 | 1.13e-41 | 1.80e-38 | 369 |
| GO:0043161111 | Esophagus | ESCC | proteasome-mediated ubiquitin-dependent protein catabolic process | 312/8552 | 412/18723 | 3.53e-36 | 4.48e-33 | 312 |
| GO:0031647111 | Esophagus | ESCC | regulation of protein stability | 223/8552 | 298/18723 | 5.76e-25 | 1.52e-22 | 223 |
| GO:004477216 | Esophagus | ESCC | mitotic cell cycle phase transition | 281/8552 | 424/18723 | 4.63e-18 | 4.45e-16 | 281 |
| GO:000931419 | Esophagus | ESCC | response to radiation | 277/8552 | 456/18723 | 4.42e-11 | 1.43e-09 | 277 |
| GO:00448394 | Esophagus | ESCC | cell cycle G2/M phase transition | 103/8552 | 148/18723 | 3.09e-09 | 6.67e-08 | 103 |
| GO:00000864 | Esophagus | ESCC | G2/M transition of mitotic cell cycle | 96/8552 | 137/18723 | 6.00e-09 | 1.23e-07 | 96 |
| GO:000941611 | Esophagus | ESCC | response to light stimulus | 183/8552 | 320/18723 | 2.03e-05 | 1.76e-04 | 183 |
| GO:00316486 | Esophagus | ESCC | protein destabilization | 33/8552 | 46/18723 | 3.06e-04 | 1.83e-03 | 33 |
| GO:004851118 | Esophagus | ESCC | rhythmic process | 164/8552 | 298/18723 | 6.80e-04 | 3.57e-03 | 164 |
| GO:000762319 | Esophagus | ESCC | circadian rhythm | 119/8552 | 210/18723 | 8.47e-04 | 4.36e-03 | 119 |
| GO:00311461 | Esophagus | ESCC | SCF-dependent proteasomal ubiquitin-dependent protein catabolic process | 33/8552 | 49/18723 | 1.80e-03 | 8.26e-03 | 33 |
| GO:00427529 | Esophagus | ESCC | regulation of circadian rhythm | 68/8552 | 121/18723 | 1.27e-02 | 4.21e-02 | 68 |
| GO:001049820 | Oral cavity | OSCC | proteasomal protein catabolic process | 336/7305 | 490/18723 | 5.45e-41 | 8.63e-38 | 336 |
| GO:004316120 | Oral cavity | OSCC | proteasome-mediated ubiquitin-dependent protein catabolic process | 285/7305 | 412/18723 | 5.68e-36 | 5.99e-33 | 285 |
| GO:003164720 | Oral cavity | OSCC | regulation of protein stability | 193/7305 | 298/18723 | 1.30e-19 | 1.95e-17 | 193 |
| GO:00447728 | Oral cavity | OSCC | mitotic cell cycle phase transition | 255/7305 | 424/18723 | 5.29e-19 | 6.98e-17 | 255 |
| GO:000931416 | Oral cavity | OSCC | response to radiation | 241/7305 | 456/18723 | 9.76e-10 | 2.40e-08 | 241 |
| GO:00000863 | Oral cavity | OSCC | G2/M transition of mitotic cell cycle | 84/7305 | 137/18723 | 9.99e-08 | 1.70e-06 | 84 |
| GO:00448393 | Oral cavity | OSCC | cell cycle G2/M phase transition | 89/7305 | 148/18723 | 1.51e-07 | 2.51e-06 | 89 |
| Page: 1 2 |
| Pathway ID | Tissue | Disease Stage | Description | Gene Ratio | Bg Ratio | pvalue | p.adjust | qvalue | Count |
| hsa047105 | Esophagus | ESCC | Circadian rhythm | 24/4205 | 34/8465 | 1.09e-02 | 2.51e-02 | 1.29e-02 | 24 |
| hsa0471012 | Esophagus | ESCC | Circadian rhythm | 24/4205 | 34/8465 | 1.09e-02 | 2.51e-02 | 1.29e-02 | 24 |
| Page: 1 |
Top |
Cell-cell communication analysis |
| Identification of potential cell-cell interactions between two cell types and their ligand-receptor pairs for different disease states |
| Ligand | Receptor | LRpair | Pathway | Tissue | Disease Stage |
| Page: 1 |
Top |
Single-cell gene regulatory network inference analysis |
| Find out the significant the regulons (TFs) and the target genes of each regulon across cell types for different disease states |
| TF | Cell Type | Tissue | Disease Stage | Target Gene | RSS | Regulon Activity |
| ∗The dot plots of a searched regulon are shown for all cell subpopulations in each disease state of each tissue based on the regulon specific score inferred using pySCENIC and by calculating the average expression. |
| Page: 1 |
Top |
Somatic mutation of malignant transformation related genes |
| Annotation of somatic variants for genes involved in malignant transformation |
| Hugo Symbol | Variant Class | Variant Classification | dbSNP RS | HGVSc | HGVSp | HGVSp Short | SWISSPROT | BIOTYPE | SIFT | PolyPhen | Tumor Sample Barcode | Tissue | Histology | Sex | Age | Stage | Therapy Types | Drugs | Outcome |
| FBXL3 | SNV | Missense_Mutation | c.101G>C | p.Cys34Ser | p.C34S | Q9UKT7 | protein_coding | tolerated_low_confidence(0.32) | benign(0) | TCGA-E2-A154-01 | Breast | breast invasive carcinoma | Female | >=65 | I/II | Hormone Therapy | arimidex | SD | |
| FBXL3 | SNV | Missense_Mutation | novel | c.977N>A | p.Arg326His | p.R326H | Q9UKT7 | protein_coding | deleterious(0.04) | probably_damaging(0.996) | TCGA-E2-A1LE-01 | Breast | breast invasive carcinoma | Female | >=65 | III/IV | Chemotherapy | herceptin | PD |
| FBXL3 | insertion | Frame_Shift_Ins | novel | c.645_646insTCTCAAATGTTACAAA | p.Ile216SerfsTer11 | p.I216Sfs*11 | Q9UKT7 | protein_coding | TCGA-B6-A0IB-01 | Breast | breast invasive carcinoma | Female | <65 | III/IV | Unknown | Unknown | PD | ||
| FBXL3 | SNV | Missense_Mutation | rs766494461 | c.767N>A | p.Arg256His | p.R256H | Q9UKT7 | protein_coding | tolerated(0.07) | probably_damaging(0.925) | TCGA-AA-A00N-01 | Colorectum | colon adenocarcinoma | Male | >=65 | I/II | Unknown | Unknown | PD |
| FBXL3 | SNV | Missense_Mutation | c.749T>C | p.Val250Ala | p.V250A | Q9UKT7 | protein_coding | tolerated(0.07) | benign(0.003) | TCGA-AA-A010-01 | Colorectum | colon adenocarcinoma | Female | <65 | I/II | Chemotherapy | folinic | CR | |
| FBXL3 | SNV | Missense_Mutation | novel | c.880T>G | p.Phe294Val | p.F294V | Q9UKT7 | protein_coding | deleterious(0.01) | probably_damaging(0.954) | TCGA-AG-A002-01 | Colorectum | rectum adenocarcinoma | Male | <65 | I/II | Unknown | Unknown | SD |
| FBXL3 | deletion | Frame_Shift_Del | c.476_486delNNNNNNNNNNN | p.His159ArgfsTer16 | p.H159Rfs*16 | Q9UKT7 | protein_coding | TCGA-AA-3492-01 | Colorectum | colon adenocarcinoma | Female | >=65 | I/II | Unknown | Unknown | SD | |||
| FBXL3 | deletion | Frame_Shift_Del | rs764008859 | c.884delT | p.Leu295TyrfsTer25 | p.L295Yfs*25 | Q9UKT7 | protein_coding | TCGA-AA-A02R-01 | Colorectum | colon adenocarcinoma | Female | >=65 | I/II | Unknown | Unknown | PD | ||
| FBXL3 | deletion | Frame_Shift_Del | rs764008859 | c.884delT | p.Leu295TyrfsTer25 | p.L295Yfs*25 | Q9UKT7 | protein_coding | TCGA-CK-6746-01 | Colorectum | colon adenocarcinoma | Female | >=65 | I/II | Unknown | Unknown | SD | ||
| FBXL3 | SNV | Missense_Mutation | novel | c.515N>C | p.Lys172Thr | p.K172T | Q9UKT7 | protein_coding | tolerated(0.06) | probably_damaging(0.994) | TCGA-A5-A0G2-01 | Endometrium | uterine corpus endometrioid carcinoma | Female | <65 | III/IV | Unknown | Unknown | SD |
| Page: 1 2 3 4 5 6 |
Top |
Related drugs of malignant transformation related genes |
| Identification of chemicals and drugs interact with genes involved in malignant transfromation |
| (DGIdb 4.0) |
| Entrez ID | Symbol | Category | Interaction Types | Drug Claim Name | Drug Name | PMIDs |
| Page: 1 |

Copyright 2023-Present -The University of Texas Health Science Center at Houston |