
|
|||||
|
 | |
| |
| |
| |
| |
| |
|
Gene: FBXL15 |
Gene summary for FBXL15 |
| Gene information | Species | Human | Gene symbol | FBXL15 | Gene ID | 79176 |
| Gene name | F-box and leucine rich repeat protein 15 | |
| Gene Alias | FBXO37 | |
| Cytomap | 10q24.32 | |
| Gene Type | protein-coding | GO ID | GO:0000086 | UniProtAcc | Q9H469 |
Top |
Malignant transformation analysis |
| Identification of the aberrant gene expression in precancerous and cancerous lesions by comparing the gene expression of stem-like cells in diseased tissues with normal stem cells |
| Entrez ID | Symbol | Replicates | Species | Organ | Tissue | Adj P-value | Log2FC | Malignancy |
| 79176 | FBXL15 | LZE4T | Human | Esophagus | ESCC | 4.98e-02 | 7.62e-02 | 0.0811 |
| 79176 | FBXL15 | LZE20T | Human | Esophagus | ESCC | 1.13e-03 | 8.78e-02 | 0.0662 |
| 79176 | FBXL15 | LZE24T | Human | Esophagus | ESCC | 9.37e-17 | 4.36e-01 | 0.0596 |
| 79176 | FBXL15 | P1T-E | Human | Esophagus | ESCC | 2.57e-12 | 2.65e-01 | 0.0875 |
| 79176 | FBXL15 | P2T-E | Human | Esophagus | ESCC | 9.39e-19 | 2.90e-01 | 0.1177 |
| 79176 | FBXL15 | P4T-E | Human | Esophagus | ESCC | 5.51e-25 | 3.94e-01 | 0.1323 |
| 79176 | FBXL15 | P5T-E | Human | Esophagus | ESCC | 1.27e-13 | 2.49e-01 | 0.1327 |
| 79176 | FBXL15 | P8T-E | Human | Esophagus | ESCC | 5.67e-12 | 1.65e-01 | 0.0889 |
| 79176 | FBXL15 | P9T-E | Human | Esophagus | ESCC | 5.74e-10 | 1.94e-01 | 0.1131 |
| 79176 | FBXL15 | P10T-E | Human | Esophagus | ESCC | 6.36e-06 | 6.91e-02 | 0.116 |
| 79176 | FBXL15 | P11T-E | Human | Esophagus | ESCC | 5.08e-07 | 2.97e-01 | 0.1426 |
| 79176 | FBXL15 | P12T-E | Human | Esophagus | ESCC | 2.54e-19 | 4.29e-01 | 0.1122 |
| 79176 | FBXL15 | P15T-E | Human | Esophagus | ESCC | 7.70e-13 | 1.43e-01 | 0.1149 |
| 79176 | FBXL15 | P16T-E | Human | Esophagus | ESCC | 4.04e-11 | 1.87e-01 | 0.1153 |
| 79176 | FBXL15 | P17T-E | Human | Esophagus | ESCC | 6.77e-09 | 2.49e-01 | 0.1278 |
| 79176 | FBXL15 | P19T-E | Human | Esophagus | ESCC | 3.37e-05 | 3.98e-01 | 0.1662 |
| 79176 | FBXL15 | P20T-E | Human | Esophagus | ESCC | 9.98e-21 | 3.77e-01 | 0.1124 |
| 79176 | FBXL15 | P21T-E | Human | Esophagus | ESCC | 2.35e-16 | 2.25e-01 | 0.1617 |
| 79176 | FBXL15 | P22T-E | Human | Esophagus | ESCC | 3.12e-07 | 1.20e-01 | 0.1236 |
| 79176 | FBXL15 | P23T-E | Human | Esophagus | ESCC | 2.67e-15 | 3.60e-01 | 0.108 |
| Page: 1 2 3 4 5 6 |
| Tissue | Expression Dynamics | Abbreviation |
| Esophagus |  | ESCC: Esophageal squamous cell carcinoma |
| HGIN: High-grade intraepithelial neoplasias | ||
| LGIN: Low-grade intraepithelial neoplasias | ||
| Liver | 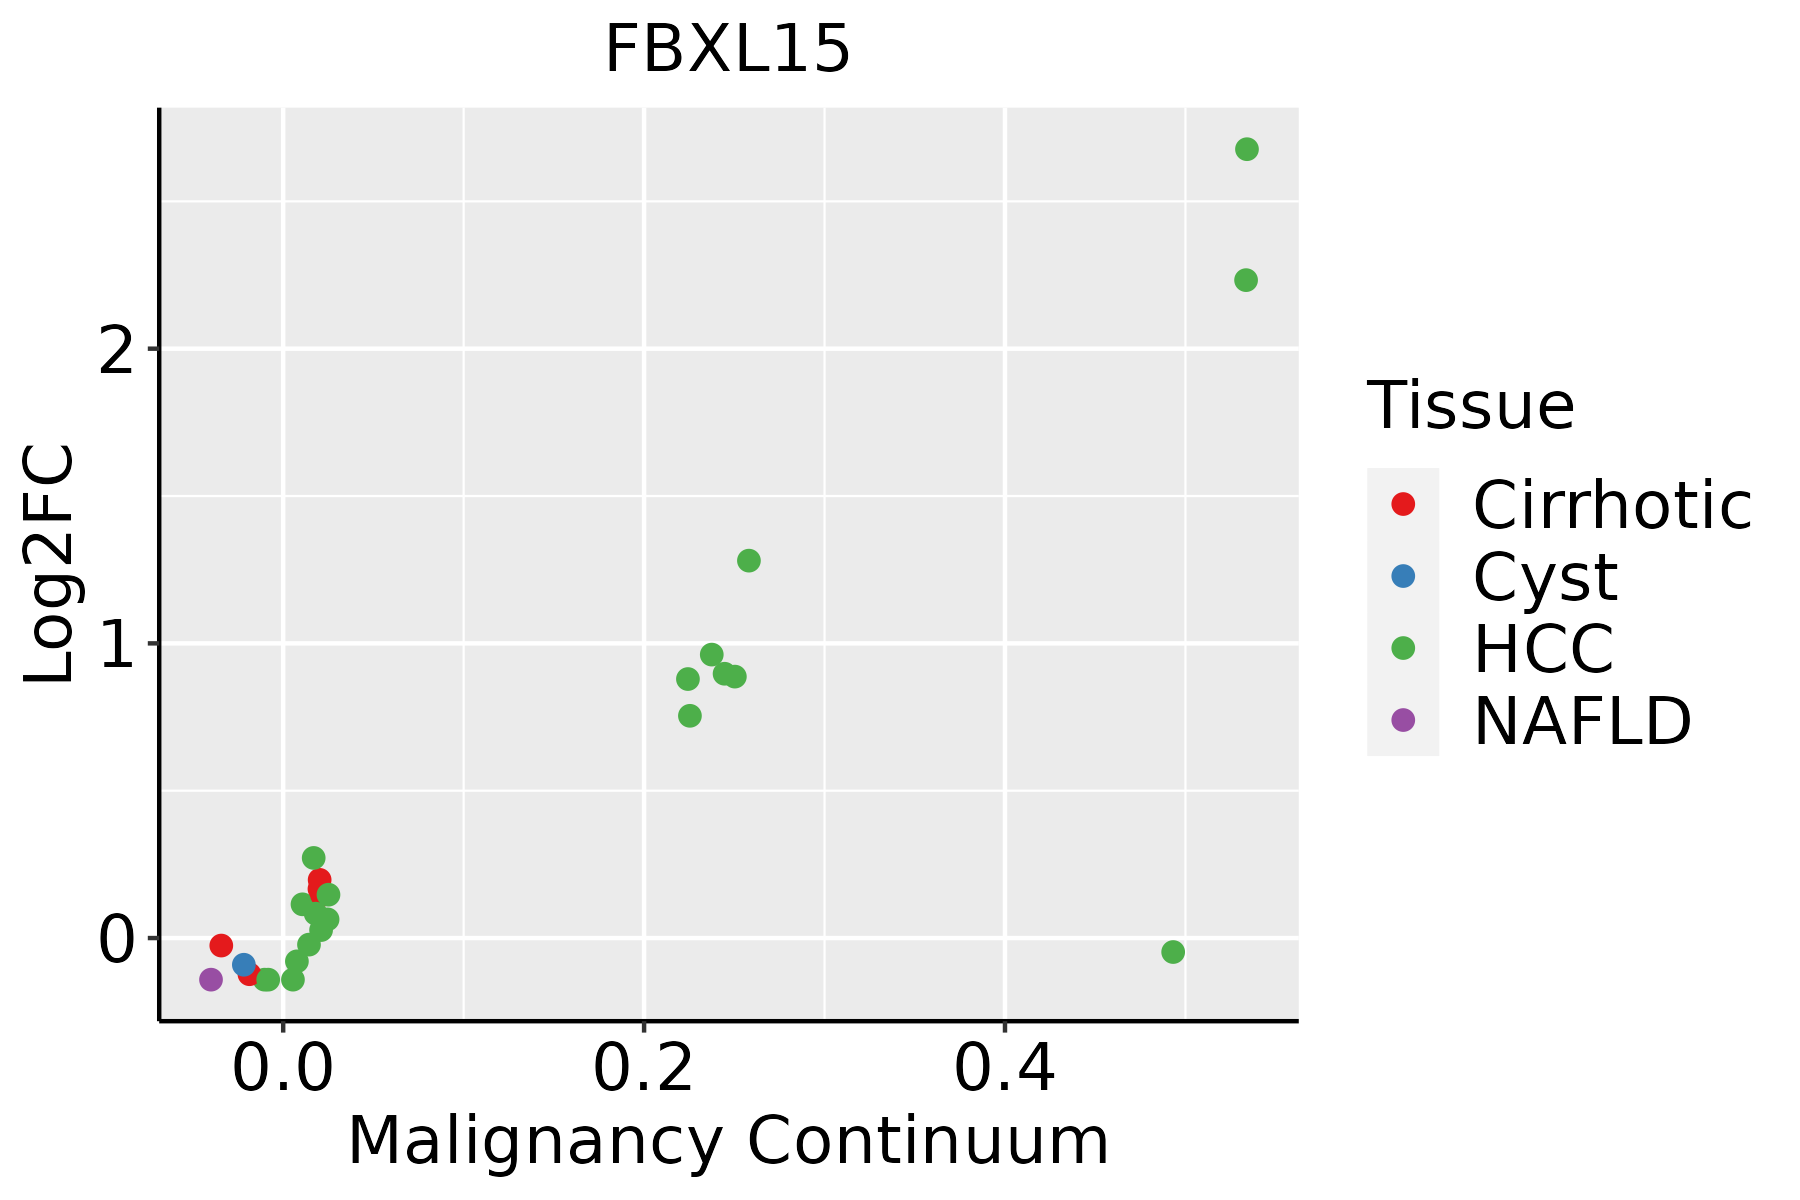 | HCC: Hepatocellular carcinoma |
| NAFLD: Non-alcoholic fatty liver disease | ||
| Oral Cavity | 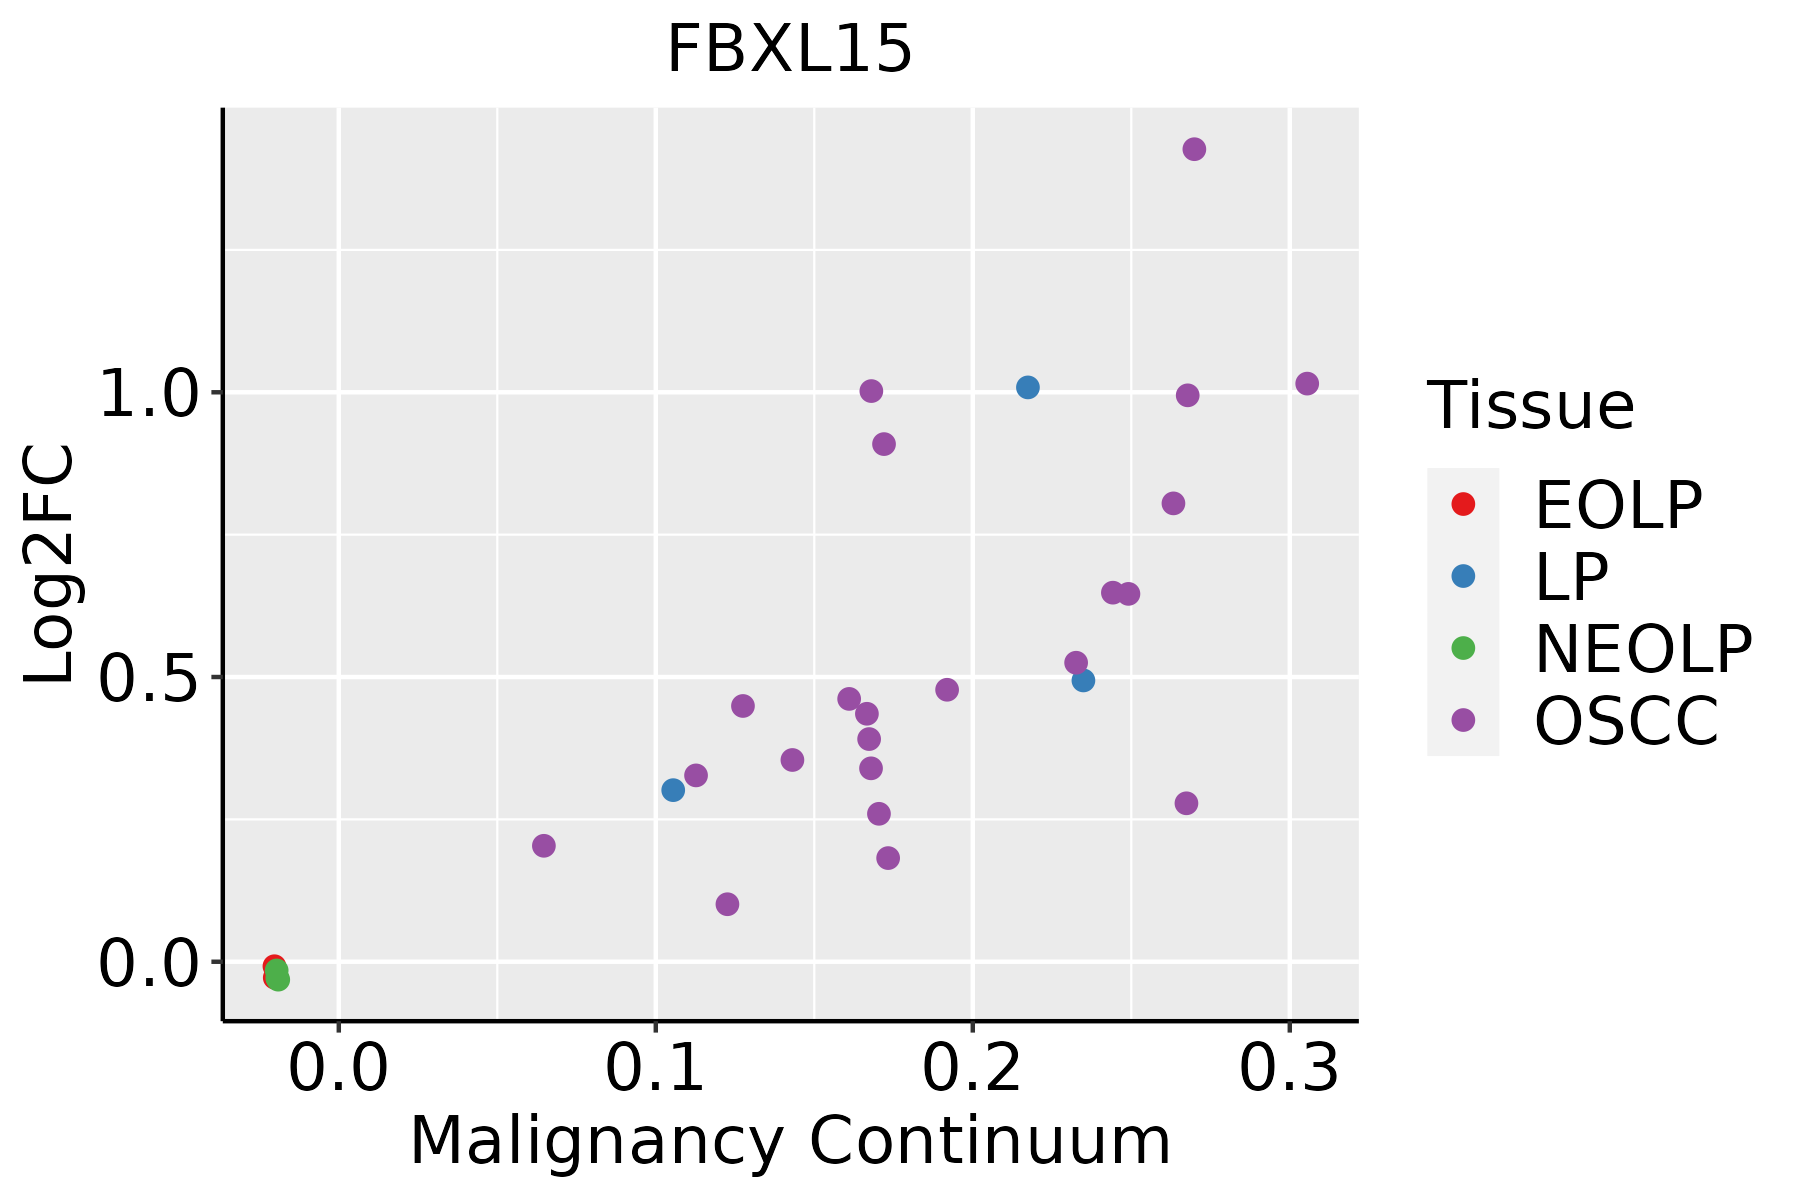 | EOLP: Erosive Oral lichen planus |
| LP: leukoplakia | ||
| NEOLP: Non-erosive oral lichen planus | ||
| OSCC: Oral squamous cell carcinoma | ||
| Thyroid | 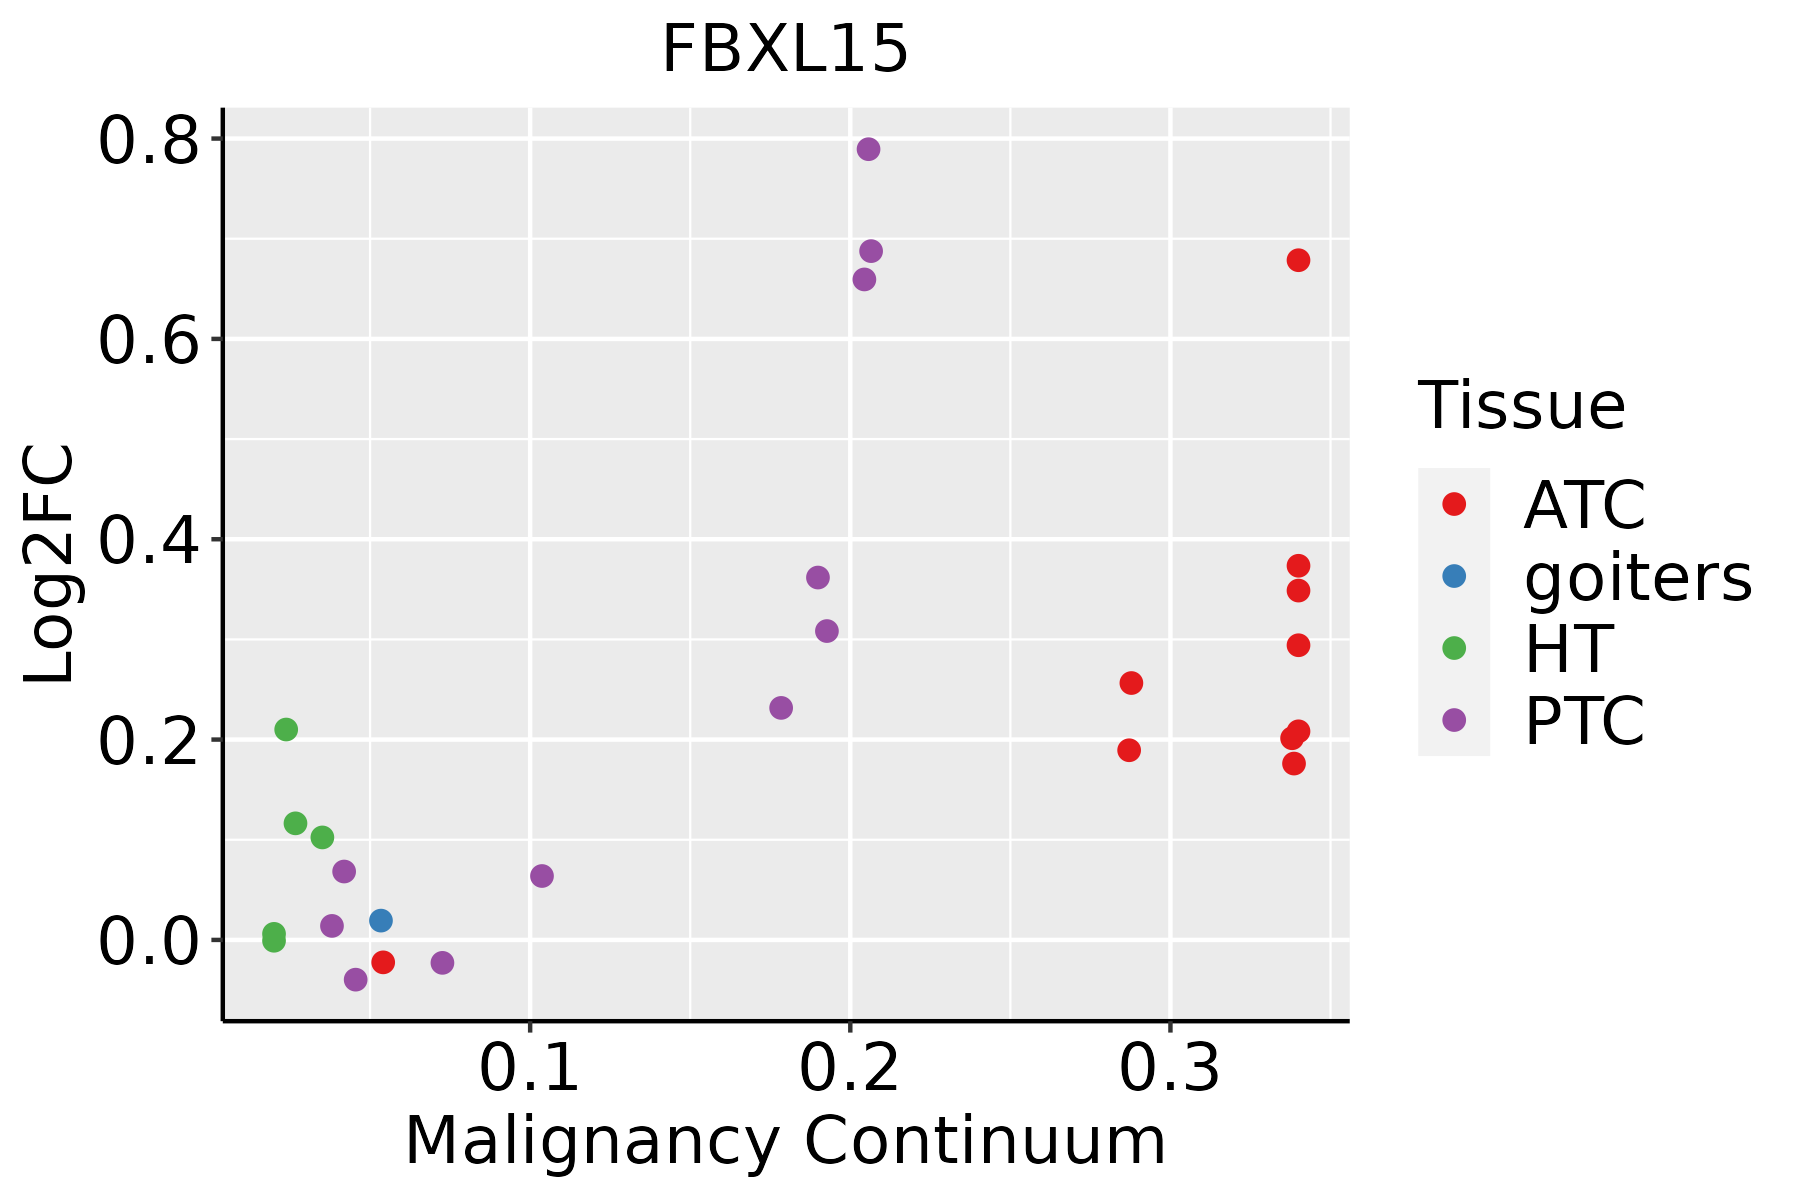 | ATC: Anaplastic thyroid cancer |
| HT: Hashimoto's thyroiditis | ||
| PTC: Papillary thyroid cancer |
| ∗log2FC in expression of this searched gene in stem-like cells from each diseased tissue sample relative to stem-like cells in normal samples in each tissue plotted against the malignancy continuum. Samples are colored based on if they are from different disease stage. |
Top |
Malignant transformation related pathway analysis |
| Find out the enriched GO biological processes and KEGG pathways involved in transition from healthy to precancer to cancer |
| Tissue | Disease Stage | Enriched GO biological Processes |
| Colorectum | AD |  |
| Colorectum | SER |  |
| Colorectum | MSS |  |
| Colorectum | MSI-H |  |
| Colorectum | FAP |  |
| ∗Top 15 enriched GO BP terms are showed in the bar plot of each disease state in each tissue. Each row represents a significant GO biological process which is colored according to the -log10(p.adjust). |
| Page: 1 2 3 4 5 6 7 8 9 |
| GO ID | Tissue | Disease Stage | Description | Gene Ratio | Bg Ratio | pvalue | p.adjust | Count |
| GO:0010498111 | Esophagus | ESCC | proteasomal protein catabolic process | 369/8552 | 490/18723 | 1.13e-41 | 1.80e-38 | 369 |
| GO:0043161111 | Esophagus | ESCC | proteasome-mediated ubiquitin-dependent protein catabolic process | 312/8552 | 412/18723 | 3.53e-36 | 4.48e-33 | 312 |
| GO:004477216 | Esophagus | ESCC | mitotic cell cycle phase transition | 281/8552 | 424/18723 | 4.63e-18 | 4.45e-16 | 281 |
| GO:00448394 | Esophagus | ESCC | cell cycle G2/M phase transition | 103/8552 | 148/18723 | 3.09e-09 | 6.67e-08 | 103 |
| GO:00000864 | Esophagus | ESCC | G2/M transition of mitotic cell cycle | 96/8552 | 137/18723 | 6.00e-09 | 1.23e-07 | 96 |
| GO:000150317 | Esophagus | ESCC | ossification | 232/8552 | 408/18723 | 3.00e-06 | 3.40e-05 | 232 |
| GO:000717810 | Esophagus | ESCC | transmembrane receptor protein serine/threonine kinase signaling pathway | 195/8552 | 355/18723 | 2.58e-04 | 1.58e-03 | 195 |
| GO:00311461 | Esophagus | ESCC | SCF-dependent proteasomal ubiquitin-dependent protein catabolic process | 33/8552 | 49/18723 | 1.80e-03 | 8.26e-03 | 33 |
| GO:001049812 | Liver | Cirrhotic | proteasomal protein catabolic process | 216/4634 | 490/18723 | 2.52e-21 | 9.29e-19 | 216 |
| GO:004316112 | Liver | Cirrhotic | proteasome-mediated ubiquitin-dependent protein catabolic process | 184/4634 | 412/18723 | 4.52e-19 | 8.85e-17 | 184 |
| GO:00447721 | Liver | Cirrhotic | mitotic cell cycle phase transition | 139/4634 | 424/18723 | 1.02e-04 | 1.06e-03 | 139 |
| GO:00015035 | Liver | Cirrhotic | ossification | 127/4634 | 408/18723 | 1.89e-03 | 1.19e-02 | 127 |
| GO:000717811 | Liver | Cirrhotic | transmembrane receptor protein serine/threonine kinase signaling pathway | 111/4634 | 355/18723 | 2.98e-03 | 1.70e-02 | 111 |
| GO:001049822 | Liver | HCC | proteasomal protein catabolic process | 351/7958 | 490/18723 | 6.92e-40 | 1.46e-36 | 351 |
| GO:004316122 | Liver | HCC | proteasome-mediated ubiquitin-dependent protein catabolic process | 299/7958 | 412/18723 | 7.82e-36 | 8.27e-33 | 299 |
| GO:00447722 | Liver | HCC | mitotic cell cycle phase transition | 240/7958 | 424/18723 | 2.47e-09 | 6.84e-08 | 240 |
| GO:0000086 | Liver | HCC | G2/M transition of mitotic cell cycle | 75/7958 | 137/18723 | 2.52e-03 | 1.22e-02 | 75 |
| GO:0044839 | Liver | HCC | cell cycle G2/M phase transition | 79/7958 | 148/18723 | 4.82e-03 | 2.03e-02 | 79 |
| GO:0031146 | Liver | HCC | SCF-dependent proteasomal ubiquitin-dependent protein catabolic process | 30/7958 | 49/18723 | 6.31e-03 | 2.57e-02 | 30 |
| GO:001049820 | Oral cavity | OSCC | proteasomal protein catabolic process | 336/7305 | 490/18723 | 5.45e-41 | 8.63e-38 | 336 |
| Page: 1 2 3 |
| Pathway ID | Tissue | Disease Stage | Description | Gene Ratio | Bg Ratio | pvalue | p.adjust | qvalue | Count |
| Page: 1 |
Top |
Cell-cell communication analysis |
| Identification of potential cell-cell interactions between two cell types and their ligand-receptor pairs for different disease states |
| Ligand | Receptor | LRpair | Pathway | Tissue | Disease Stage |
| Page: 1 |
Top |
Single-cell gene regulatory network inference analysis |
| Find out the significant the regulons (TFs) and the target genes of each regulon across cell types for different disease states |
| TF | Cell Type | Tissue | Disease Stage | Target Gene | RSS | Regulon Activity |
| ∗The dot plots of a searched regulon are shown for all cell subpopulations in each disease state of each tissue based on the regulon specific score inferred using pySCENIC and by calculating the average expression. |
| Page: 1 |
Top |
Somatic mutation of malignant transformation related genes |
| Annotation of somatic variants for genes involved in malignant transformation |
| Hugo Symbol | Variant Class | Variant Classification | dbSNP RS | HGVSc | HGVSp | HGVSp Short | SWISSPROT | BIOTYPE | SIFT | PolyPhen | Tumor Sample Barcode | Tissue | Histology | Sex | Age | Stage | Therapy Types | Drugs | Outcome |
| FBXL15 | SNV | Missense_Mutation | c.778G>A | p.Glu260Lys | p.E260K | Q9H469 | protein_coding | deleterious(0) | probably_damaging(0.978) | TCGA-LP-A7HU-01 | Cervix | cervical & endocervical cancer | Female | <65 | I/II | Unknown | Unknown | SD | |
| FBXL15 | SNV | Missense_Mutation | c.820G>A | p.Asp274Asn | p.D274N | Q9H469 | protein_coding | deleterious(0) | probably_damaging(0.995) | TCGA-D5-6540-01 | Colorectum | colon adenocarcinoma | Male | >=65 | I/II | Unknown | Unknown | SD | |
| FBXL15 | SNV | Missense_Mutation | c.284N>T | p.Ala95Val | p.A95V | Q9H469 | protein_coding | tolerated(0.22) | benign(0.028) | TCGA-G4-6586-01 | Colorectum | colon adenocarcinoma | Female | >=65 | I/II | Unknown | Unknown | SD | |
| FBXL15 | SNV | Missense_Mutation | novel | c.11C>T | p.Pro4Leu | p.P4L | Q9H469 | protein_coding | deleterious_low_confidence(0) | benign(0) | TCGA-G5-6233-01 | Colorectum | rectum adenocarcinoma | Male | >=65 | III/IV | Chemotherapy | 5-fluorouracil | PD |
| FBXL15 | insertion | Frame_Shift_Ins | novel | c.885dupT | p.Val296CysfsTer22 | p.V296Cfs*22 | Q9H469 | protein_coding | TCGA-A6-2680-01 | Colorectum | colon adenocarcinoma | Female | >=65 | I/II | Unknown | Unknown | SD | ||
| FBXL15 | deletion | Frame_Shift_Del | novel | c.768delN | p.His257MetfsTer7 | p.H257Mfs*7 | Q9H469 | protein_coding | TCGA-SJ-A6ZI-01 | Endometrium | uterine corpus endometrioid carcinoma | Female | <65 | I/II | Unknown | Unknown | SD | ||
| FBXL15 | SNV | Missense_Mutation | c.850N>T | p.Val284Leu | p.V284L | Q9H469 | protein_coding | tolerated(0.06) | probably_damaging(0.967) | TCGA-D7-A4YY-01 | Stomach | stomach adenocarcinoma | Male | <65 | III/IV | Chemotherapy | 5-fluorouracil | SD | |
| FBXL15 | SNV | Missense_Mutation | rs775240149 | c.347N>C | p.Leu116Pro | p.L116P | Q9H469 | protein_coding | deleterious(0) | probably_damaging(0.997) | TCGA-HU-A4H3-01 | Stomach | stomach adenocarcinoma | Female | <65 | III/IV | Chemotherapy | ts-1 | PD |
| Page: 1 |
Top |
Related drugs of malignant transformation related genes |
| Identification of chemicals and drugs interact with genes involved in malignant transfromation |
| (DGIdb 4.0) |
| Entrez ID | Symbol | Category | Interaction Types | Drug Claim Name | Drug Name | PMIDs |
| Page: 1 |

Copyright 2023-Present -The University of Texas Health Science Center at Houston |