
|
|||||
|
 | |
| |
| |
| |
| |
| |
|
Gene: FBXL13 |
Gene summary for FBXL13 |
| Gene information | Species | Human | Gene symbol | FBXL13 | Gene ID | 222235 |
| Gene name | F-box and leucine rich repeat protein 13 | |
| Gene Alias | CFAP169 | |
| Cytomap | 7q22.1 | |
| Gene Type | protein-coding | GO ID | GO:0006508 | UniProtAcc | Q8N1P0 |
Top |
Malignant transformation analysis |
| Identification of the aberrant gene expression in precancerous and cancerous lesions by comparing the gene expression of stem-like cells in diseased tissues with normal stem cells |
| Entrez ID | Symbol | Replicates | Species | Organ | Tissue | Adj P-value | Log2FC | Malignancy |
| 222235 | FBXL13 | P2T-E | Human | Esophagus | ESCC | 1.92e-37 | 6.09e-01 | 0.1177 |
| 222235 | FBXL13 | P27T-E | Human | Esophagus | ESCC | 1.78e-03 | 1.14e-01 | 0.1055 |
| 222235 | FBXL13 | P56T-E | Human | Esophagus | ESCC | 1.16e-08 | 9.98e-01 | 0.1613 |
| 222235 | FBXL13 | P80T-E | Human | Esophagus | ESCC | 1.97e-04 | 1.73e-01 | 0.155 |
| 222235 | FBXL13 | P128T-E | Human | Esophagus | ESCC | 9.55e-03 | 1.21e-01 | 0.1241 |
| 222235 | FBXL13 | HCC1 | Human | Liver | HCC | 8.15e-10 | 1.23e+00 | 0.5336 |
| 222235 | FBXL13 | HCC2 | Human | Liver | HCC | 5.53e-16 | 1.75e+00 | 0.5341 |
| 222235 | FBXL13 | HCC5 | Human | Liver | HCC | 4.93e-04 | 9.36e-01 | 0.4932 |
| Page: 1 |
| Tissue | Expression Dynamics | Abbreviation |
| Esophagus | 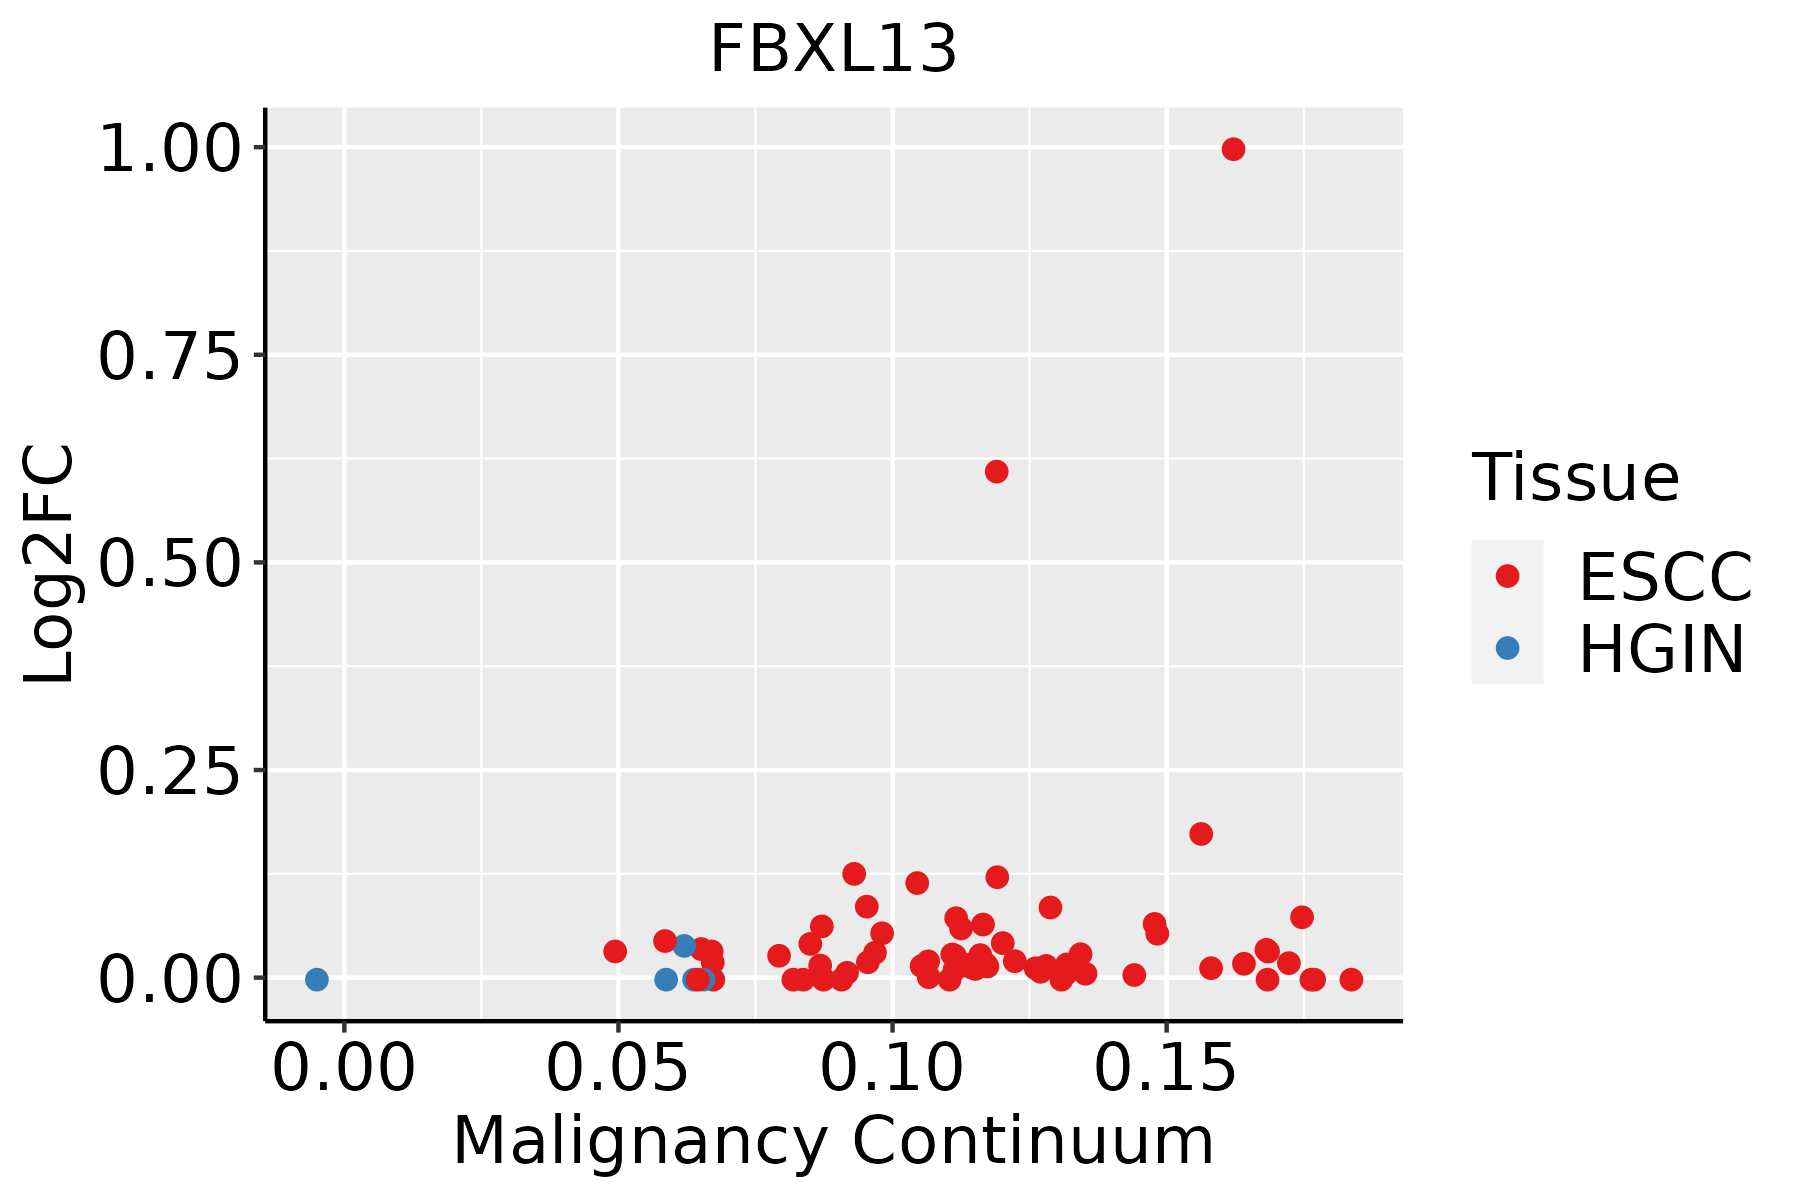 | ESCC: Esophageal squamous cell carcinoma |
| HGIN: High-grade intraepithelial neoplasias | ||
| LGIN: Low-grade intraepithelial neoplasias | ||
| Liver |  | HCC: Hepatocellular carcinoma |
| NAFLD: Non-alcoholic fatty liver disease |
| ∗log2FC in expression of this searched gene in stem-like cells from each diseased tissue sample relative to stem-like cells in normal samples in each tissue plotted against the malignancy continuum. Samples are colored based on if they are from different disease stage. |
Top |
Malignant transformation related pathway analysis |
| Find out the enriched GO biological processes and KEGG pathways involved in transition from healthy to precancer to cancer |
| Tissue | Disease Stage | Enriched GO biological Processes |
| Colorectum | AD |  |
| Colorectum | SER |  |
| Colorectum | MSS |  |
| Colorectum | MSI-H |  |
| Colorectum | FAP |  |
| ∗Top 15 enriched GO BP terms are showed in the bar plot of each disease state in each tissue. Each row represents a significant GO biological process which is colored according to the -log10(p.adjust). |
| Page: 1 2 3 4 5 6 7 8 9 |
| GO ID | Tissue | Disease Stage | Description | Gene Ratio | Bg Ratio | pvalue | p.adjust | Count |
| GO:0010498111 | Esophagus | ESCC | proteasomal protein catabolic process | 369/8552 | 490/18723 | 1.13e-41 | 1.80e-38 | 369 |
| GO:0043161111 | Esophagus | ESCC | proteasome-mediated ubiquitin-dependent protein catabolic process | 312/8552 | 412/18723 | 3.53e-36 | 4.48e-33 | 312 |
| GO:00311461 | Esophagus | ESCC | SCF-dependent proteasomal ubiquitin-dependent protein catabolic process | 33/8552 | 49/18723 | 1.80e-03 | 8.26e-03 | 33 |
| GO:001049822 | Liver | HCC | proteasomal protein catabolic process | 351/7958 | 490/18723 | 6.92e-40 | 1.46e-36 | 351 |
| GO:004316122 | Liver | HCC | proteasome-mediated ubiquitin-dependent protein catabolic process | 299/7958 | 412/18723 | 7.82e-36 | 8.27e-33 | 299 |
| GO:0031146 | Liver | HCC | SCF-dependent proteasomal ubiquitin-dependent protein catabolic process | 30/7958 | 49/18723 | 6.31e-03 | 2.57e-02 | 30 |
| Page: 1 |
| Pathway ID | Tissue | Disease Stage | Description | Gene Ratio | Bg Ratio | pvalue | p.adjust | qvalue | Count |
| Page: 1 |
Top |
Cell-cell communication analysis |
| Identification of potential cell-cell interactions between two cell types and their ligand-receptor pairs for different disease states |
| Ligand | Receptor | LRpair | Pathway | Tissue | Disease Stage |
| Page: 1 |
Top |
Single-cell gene regulatory network inference analysis |
| Find out the significant the regulons (TFs) and the target genes of each regulon across cell types for different disease states |
| TF | Cell Type | Tissue | Disease Stage | Target Gene | RSS | Regulon Activity |
| ∗The dot plots of a searched regulon are shown for all cell subpopulations in each disease state of each tissue based on the regulon specific score inferred using pySCENIC and by calculating the average expression. |
| Page: 1 |
Top |
Somatic mutation of malignant transformation related genes |
| Annotation of somatic variants for genes involved in malignant transformation |
| Hugo Symbol | Variant Class | Variant Classification | dbSNP RS | HGVSc | HGVSp | HGVSp Short | SWISSPROT | BIOTYPE | SIFT | PolyPhen | Tumor Sample Barcode | Tissue | Histology | Sex | Age | Stage | Therapy Types | Drugs | Outcome |
| FBXL13 | SNV | Missense_Mutation | novel | c.2158N>C | p.Glu720Gln | p.E720Q | Q8NEE6 | protein_coding | deleterious_low_confidence(0.03) | benign(0.298) | TCGA-5L-AAT1-01 | Breast | breast invasive carcinoma | Female | <65 | III/IV | Hormone Therapy | letrozol | SD |
| FBXL13 | SNV | Missense_Mutation | rs760937969 | c.673C>T | p.Arg225Cys | p.R225C | Q8NEE6 | protein_coding | tolerated(0.11) | probably_damaging(0.951) | TCGA-A2-A0CL-01 | Breast | breast invasive carcinoma | Female | <65 | III/IV | Chemotherapy | cytoxan | SD |
| FBXL13 | SNV | Missense_Mutation | c.716N>A | p.Arg239Lys | p.R239K | Q8NEE6 | protein_coding | tolerated(1) | benign(0.003) | TCGA-A8-A092-01 | Breast | breast invasive carcinoma | Female | <65 | III/IV | Chemotherapy | paclitaxel | CR | |
| FBXL13 | SNV | Missense_Mutation | c.445N>A | p.Glu149Lys | p.E149K | Q8NEE6 | protein_coding | tolerated(0.76) | benign(0.003) | TCGA-A8-A094-01 | Breast | breast invasive carcinoma | Female | >=65 | I/II | Unknown | Unknown | SD | |
| FBXL13 | SNV | Missense_Mutation | c.2084N>A | p.Arg695His | p.R695H | Q8NEE6 | protein_coding | tolerated(0.54) | benign(0.001) | TCGA-BH-A0RX-01 | Breast | breast invasive carcinoma | Female | <65 | I/II | Chemotherapy | fluorouracil | SD | |
| FBXL13 | SNV | Missense_Mutation | c.745N>C | p.Glu249Gln | p.E249Q | Q8NEE6 | protein_coding | deleterious(0.01) | probably_damaging(0.924) | TCGA-C8-A26Y-01 | Breast | breast invasive carcinoma | Female | >=65 | I/II | Unknown | Unknown | SD | |
| FBXL13 | SNV | Missense_Mutation | c.70A>G | p.Thr24Ala | p.T24A | Q8NEE6 | protein_coding | tolerated(1) | benign(0) | TCGA-D8-A1XK-01 | Breast | breast invasive carcinoma | Female | <65 | I/II | Chemotherapy | doxorubicine+cyclophosphamide | SD | |
| FBXL13 | insertion | Nonsense_Mutation | novel | c.523_524insCAAGGACCCAATCCTTATAAACCCAGAC | p.Val175AlafsTer7 | p.V175Afs*7 | Q8NEE6 | protein_coding | TCGA-AO-A128-01 | Breast | breast invasive carcinoma | Female | <65 | I/II | Chemotherapy | doxorubicin | SD | ||
| FBXL13 | SNV | Missense_Mutation | novel | c.1208G>C | p.Arg403Thr | p.R403T | Q8NEE6 | protein_coding | tolerated(0.39) | benign(0.005) | TCGA-HM-A4S6-01 | Cervix | cervical & endocervical cancer | Female | <65 | III/IV | Chemotherapy | cisplatin | CR |
| FBXL13 | SNV | Missense_Mutation | novel | c.769A>C | p.Thr257Pro | p.T257P | Q8NEE6 | protein_coding | deleterious(0.04) | benign(0.139) | TCGA-AA-3949-01 | Colorectum | colon adenocarcinoma | Female | >=65 | III/IV | Unknown | Unknown | SD |
| Page: 1 2 3 4 5 6 7 8 |
Top |
Related drugs of malignant transformation related genes |
| Identification of chemicals and drugs interact with genes involved in malignant transfromation |
| (DGIdb 4.0) |
| Entrez ID | Symbol | Category | Interaction Types | Drug Claim Name | Drug Name | PMIDs |
| Page: 1 |

Copyright 2023-Present -The University of Texas Health Science Center at Houston |