
|
|||||
|
 | |
| |
| |
| |
| |
| |
|
Gene: FBRS |
Gene summary for FBRS |
| Gene information | Species | Human | Gene symbol | FBRS | Gene ID | 64319 |
| Gene name | fibrosin | |
| Gene Alias | FBS | |
| Cytomap | 16p11.2 | |
| Gene Type | protein-coding | GO ID | NA | UniProtAcc | B3KTZ7 |
Top |
Malignant transformation analysis |
| Identification of the aberrant gene expression in precancerous and cancerous lesions by comparing the gene expression of stem-like cells in diseased tissues with normal stem cells |
| Entrez ID | Symbol | Replicates | Species | Organ | Tissue | Adj P-value | Log2FC | Malignancy |
| 64319 | FBRS | LZE7T | Human | Esophagus | ESCC | 3.04e-05 | 2.06e-01 | 0.0667 |
| 64319 | FBRS | LZE20T | Human | Esophagus | ESCC | 1.85e-06 | 2.04e-01 | 0.0662 |
| 64319 | FBRS | LZE22D1 | Human | Esophagus | HGIN | 7.56e-03 | 1.10e-01 | 0.0595 |
| 64319 | FBRS | LZE22T | Human | Esophagus | ESCC | 4.86e-04 | 2.87e-01 | 0.068 |
| 64319 | FBRS | LZE24T | Human | Esophagus | ESCC | 1.20e-27 | 6.74e-01 | 0.0596 |
| 64319 | FBRS | LZE21T | Human | Esophagus | ESCC | 1.70e-05 | 2.37e-01 | 0.0655 |
| 64319 | FBRS | P1T-E | Human | Esophagus | ESCC | 1.15e-19 | 8.27e-01 | 0.0875 |
| 64319 | FBRS | P2T-E | Human | Esophagus | ESCC | 7.47e-32 | 5.57e-01 | 0.1177 |
| 64319 | FBRS | P4T-E | Human | Esophagus | ESCC | 4.52e-11 | 1.88e-01 | 0.1323 |
| 64319 | FBRS | P5T-E | Human | Esophagus | ESCC | 2.38e-09 | 1.54e-01 | 0.1327 |
| 64319 | FBRS | P8T-E | Human | Esophagus | ESCC | 1.65e-29 | 5.65e-01 | 0.0889 |
| 64319 | FBRS | P9T-E | Human | Esophagus | ESCC | 6.84e-10 | 1.25e-01 | 0.1131 |
| 64319 | FBRS | P10T-E | Human | Esophagus | ESCC | 1.41e-19 | 1.45e-01 | 0.116 |
| 64319 | FBRS | P11T-E | Human | Esophagus | ESCC | 1.41e-03 | 2.61e-01 | 0.1426 |
| 64319 | FBRS | P12T-E | Human | Esophagus | ESCC | 3.84e-24 | 4.29e-01 | 0.1122 |
| 64319 | FBRS | P15T-E | Human | Esophagus | ESCC | 5.93e-17 | 3.84e-01 | 0.1149 |
| 64319 | FBRS | P16T-E | Human | Esophagus | ESCC | 1.40e-17 | 2.27e-01 | 0.1153 |
| 64319 | FBRS | P17T-E | Human | Esophagus | ESCC | 7.11e-03 | 1.10e-01 | 0.1278 |
| 64319 | FBRS | P19T-E | Human | Esophagus | ESCC | 1.38e-02 | 1.86e-01 | 0.1662 |
| 64319 | FBRS | P20T-E | Human | Esophagus | ESCC | 6.12e-14 | 2.62e-01 | 0.1124 |
| Page: 1 2 3 4 5 |
| Tissue | Expression Dynamics | Abbreviation |
| Esophagus | 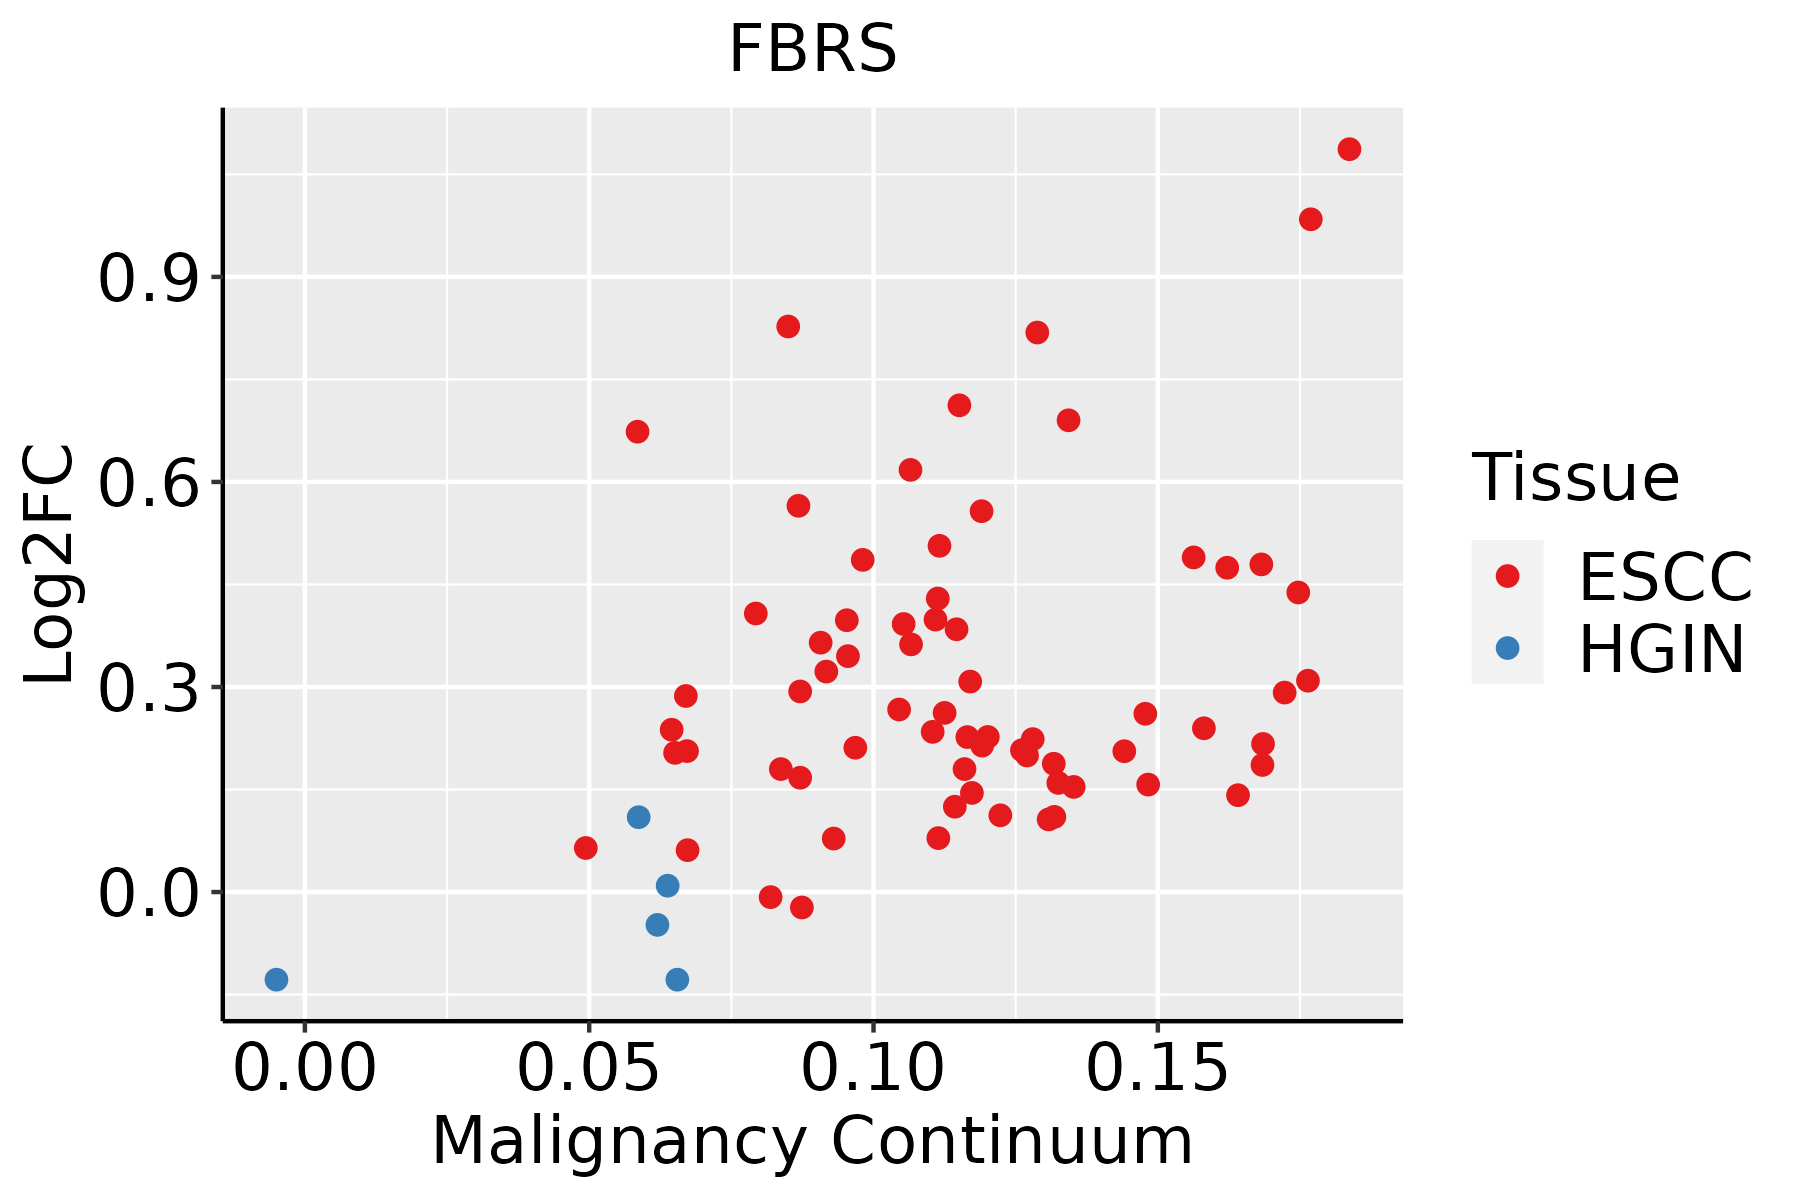 | ESCC: Esophageal squamous cell carcinoma |
| HGIN: High-grade intraepithelial neoplasias | ||
| LGIN: Low-grade intraepithelial neoplasias | ||
| Liver | 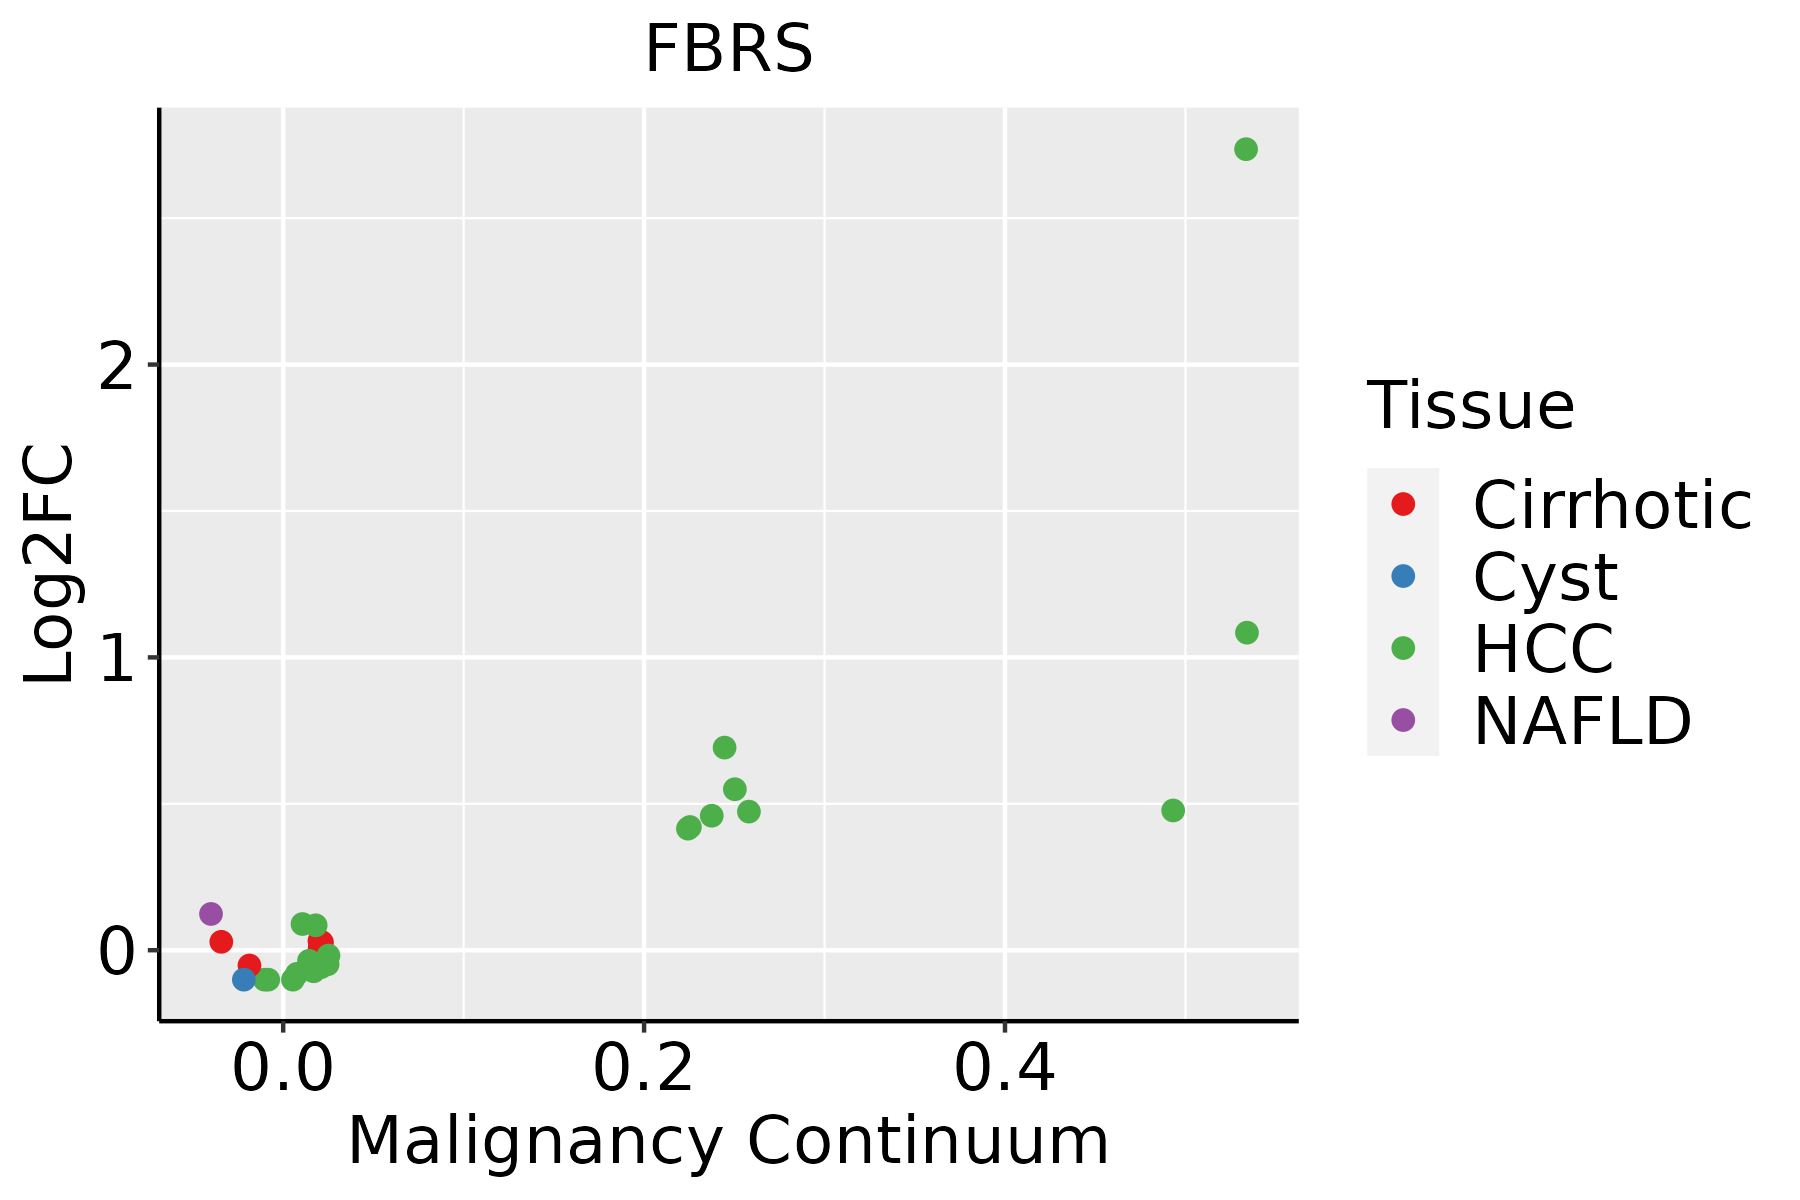 | HCC: Hepatocellular carcinoma |
| NAFLD: Non-alcoholic fatty liver disease | ||
| Oral Cavity | 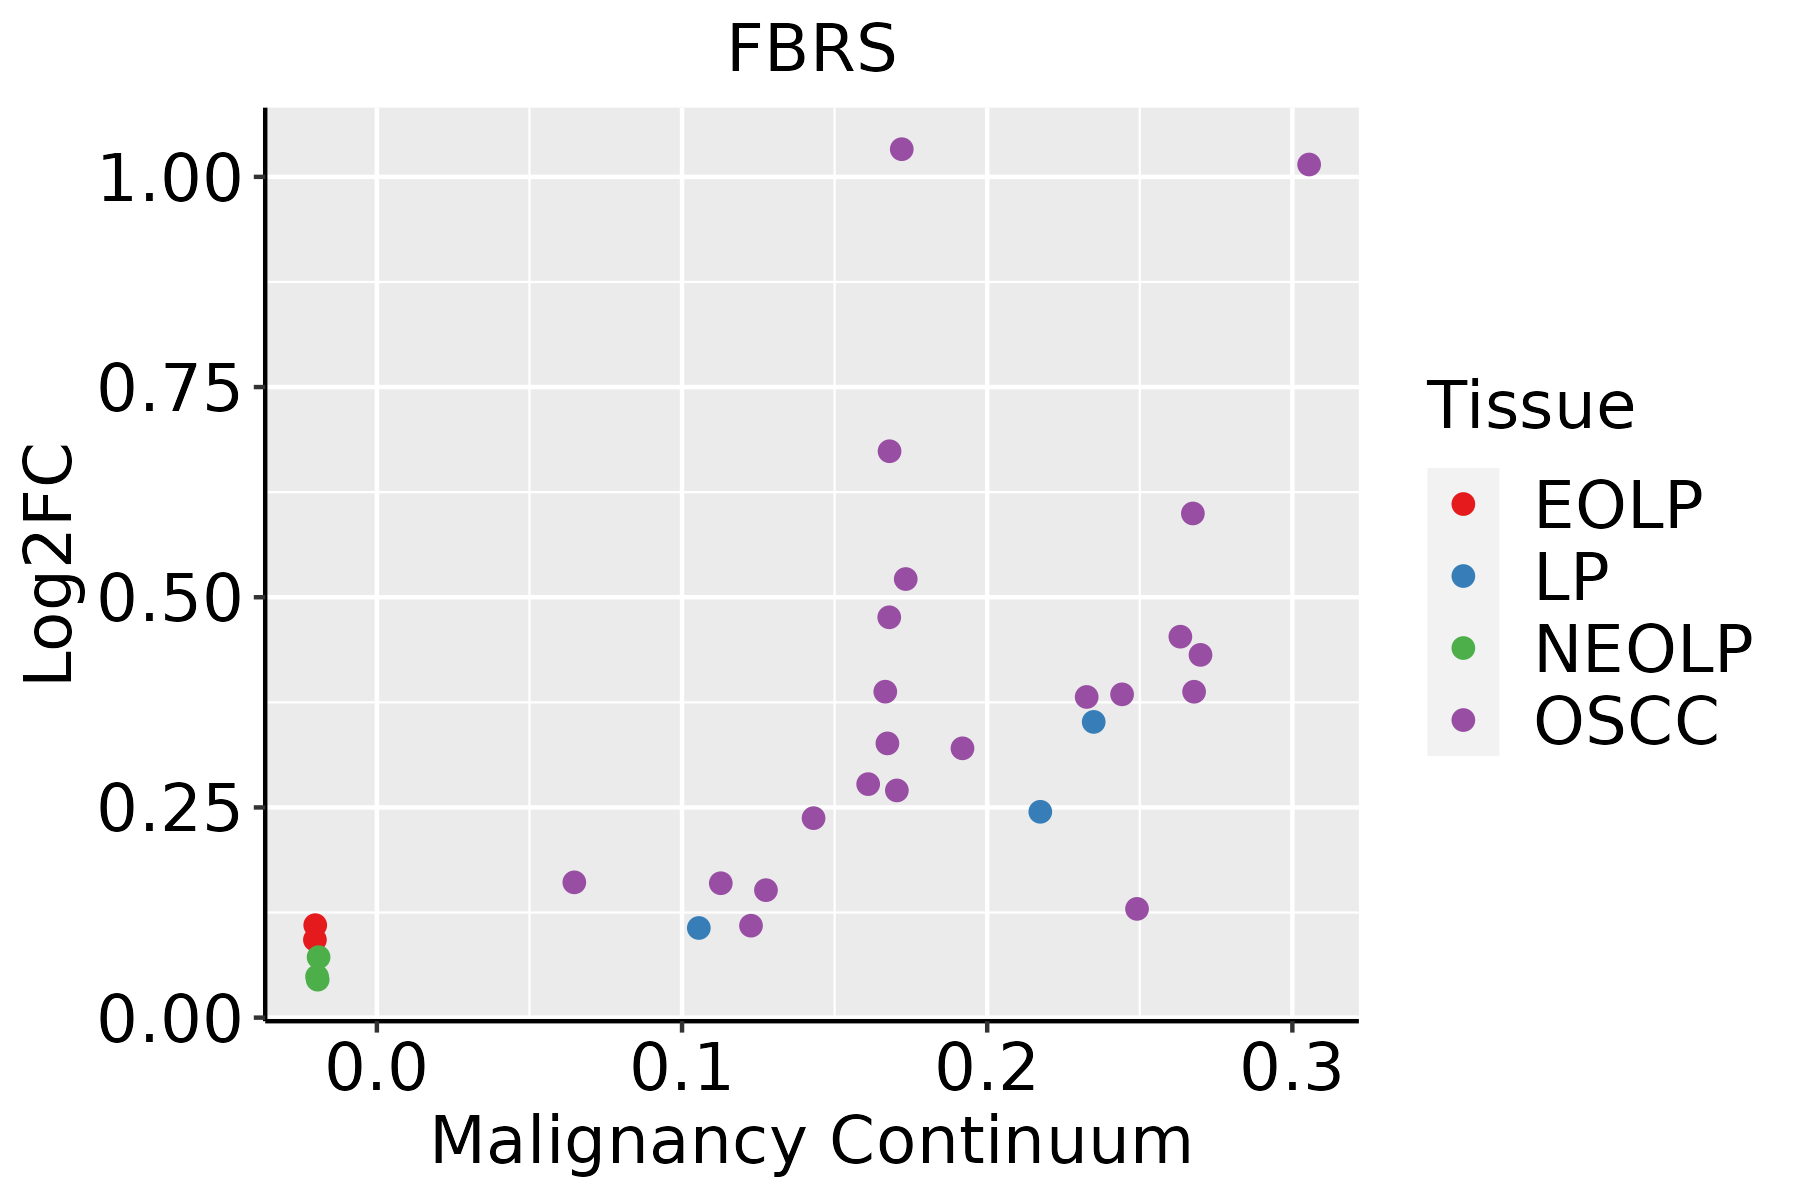 | EOLP: Erosive Oral lichen planus |
| LP: leukoplakia | ||
| NEOLP: Non-erosive oral lichen planus | ||
| OSCC: Oral squamous cell carcinoma |
| ∗log2FC in expression of this searched gene in stem-like cells from each diseased tissue sample relative to stem-like cells in normal samples in each tissue plotted against the malignancy continuum. Samples are colored based on if they are from different disease stage. |
Top |
Malignant transformation related pathway analysis |
| Find out the enriched GO biological processes and KEGG pathways involved in transition from healthy to precancer to cancer |
| Tissue | Disease Stage | Enriched GO biological Processes |
| Colorectum | AD |  |
| Colorectum | SER |  |
| Colorectum | MSS |  |
| Colorectum | MSI-H |  |
| Colorectum | FAP |  |
| ∗Top 15 enriched GO BP terms are showed in the bar plot of each disease state in each tissue. Each row represents a significant GO biological process which is colored according to the -log10(p.adjust). |
| Page: 1 2 3 4 5 6 7 8 9 |
| GO ID | Tissue | Disease Stage | Description | Gene Ratio | Bg Ratio | pvalue | p.adjust | Count |
| Page: 1 |
| Pathway ID | Tissue | Disease Stage | Description | Gene Ratio | Bg Ratio | pvalue | p.adjust | qvalue | Count |
| Page: 1 |
Top |
Cell-cell communication analysis |
| Identification of potential cell-cell interactions between two cell types and their ligand-receptor pairs for different disease states |
| Ligand | Receptor | LRpair | Pathway | Tissue | Disease Stage |
| Page: 1 |
Top |
Single-cell gene regulatory network inference analysis |
| Find out the significant the regulons (TFs) and the target genes of each regulon across cell types for different disease states |
| TF | Cell Type | Tissue | Disease Stage | Target Gene | RSS | Regulon Activity |
| ∗The dot plots of a searched regulon are shown for all cell subpopulations in each disease state of each tissue based on the regulon specific score inferred using pySCENIC and by calculating the average expression. |
| Page: 1 |
Top |
Somatic mutation of malignant transformation related genes |
| Annotation of somatic variants for genes involved in malignant transformation |
| Hugo Symbol | Variant Class | Variant Classification | dbSNP RS | HGVSc | HGVSp | HGVSp Short | SWISSPROT | BIOTYPE | SIFT | PolyPhen | Tumor Sample Barcode | Tissue | Histology | Sex | Age | Stage | Therapy Types | Drugs | Outcome |
| FBRS | SNV | Missense_Mutation | c.1365N>A | p.Asp455Glu | p.D455E | protein_coding | tolerated(0.78) | benign(0.165) | TCGA-E9-A244-01 | Breast | breast invasive carcinoma | Female | <65 | I/II | Chemotherapy | cyclophosphamide | SD | ||
| FBRS | SNV | Missense_Mutation | novel | c.750N>G | p.Ser250Arg | p.S250R | protein_coding | tolerated(0.22) | unknown(0) | TCGA-OL-A66J-01 | Breast | breast invasive carcinoma | Female | >=65 | I/II | Unknown | Unknown | SD | |
| FBRS | SNV | Missense_Mutation | rs181348530 | c.772N>A | p.Ala258Thr | p.A258T | protein_coding | tolerated(0.32) | unknown(0) | TCGA-WT-AB44-01 | Breast | breast invasive carcinoma | Female | >=65 | I/II | Hormone Therapy | arimidex | SD | |
| FBRS | deletion | Frame_Shift_Del | novel | c.1409delG | p.Gly470ValfsTer131 | p.G470Vfs*131 | protein_coding | TCGA-D8-A27V-01 | Breast | breast invasive carcinoma | Female | <65 | I/II | Hormone Therapy | tamoxiphen | SD | |||
| FBRS | SNV | Missense_Mutation | rs368020065 | c.2317C>T | p.Arg773Trp | p.R773W | protein_coding | deleterious(0) | probably_damaging(0.964) | TCGA-2W-A8YY-01 | Cervix | cervical & endocervical cancer | Female | <65 | I/II | Chemotherapy | cisplatin | CR | |
| FBRS | SNV | Missense_Mutation | c.2422N>T | p.Arg808Trp | p.R808W | protein_coding | deleterious(0) | probably_damaging(0.992) | TCGA-C5-A2LS-01 | Cervix | cervical & endocervical cancer | Female | <65 | I/II | Unknown | Unknown | SD | ||
| FBRS | SNV | Missense_Mutation | novel | c.2858T>C | p.Leu953Pro | p.L953P | protein_coding | tolerated_low_confidence(0.13) | probably_damaging(0.943) | TCGA-C5-A7CO-01 | Cervix | cervical & endocervical cancer | Female | >=65 | I/II | Chemotherapy | cisplatin | SD | |
| FBRS | SNV | Missense_Mutation | c.991N>T | p.Arg331Trp | p.R331W | protein_coding | deleterious(0.01) | unknown(0) | TCGA-JX-A3Q0-01 | Cervix | cervical & endocervical cancer | Female | <65 | III/IV | Unknown | Unknown | SD | ||
| FBRS | SNV | Missense_Mutation | novel | c.1879G>A | p.Asp627Asn | p.D627N | protein_coding | deleterious(0.01) | probably_damaging(0.93) | TCGA-VS-A9U7-01 | Cervix | cervical & endocervical cancer | Female | <65 | I/II | Chemotherapy | cisplatin | CR | |
| FBRS | deletion | Frame_Shift_Del | novel | c.533delG | p.Gly178AlafsTer113 | p.G178Afs*113 | protein_coding | TCGA-EA-A410-01 | Cervix | cervical & endocervical cancer | Female | <65 | I/II | Unknown | Unknown | SD |
| Page: 1 2 3 4 5 6 |
Top |
Related drugs of malignant transformation related genes |
| Identification of chemicals and drugs interact with genes involved in malignant transfromation |
| (DGIdb 4.0) |
| Entrez ID | Symbol | Category | Interaction Types | Drug Claim Name | Drug Name | PMIDs |
| Page: 1 |

Copyright 2023-Present -The University of Texas Health Science Center at Houston |