
|
|||||
|
 | |
| |
| |
| |
| |
| |
|
Gene: FBP1 |
Gene summary for FBP1 |
| Gene information | Species | Human | Gene symbol | FBP1 | Gene ID | 2203 |
| Gene name | fructose-bisphosphatase 1 | |
| Gene Alias | FBP | |
| Cytomap | 9q22.32 | |
| Gene Type | protein-coding | GO ID | GO:0000122 | UniProtAcc | P09467 |
Top |
Malignant transformation analysis |
| Identification of the aberrant gene expression in precancerous and cancerous lesions by comparing the gene expression of stem-like cells in diseased tissues with normal stem cells |
| Entrez ID | Symbol | Replicates | Species | Organ | Tissue | Adj P-value | Log2FC | Malignancy |
| 2203 | FBP1 | HTA11_1938_2000001011 | Human | Colorectum | AD | 3.61e-02 | 3.22e-01 | -0.0811 |
| 2203 | FBP1 | HTA11_1391_2000001011 | Human | Colorectum | AD | 3.96e-09 | 6.07e-01 | -0.059 |
| 2203 | FBP1 | HTA11_866_3004761011 | Human | Colorectum | AD | 2.99e-02 | 2.81e-01 | 0.096 |
| 2203 | FBP1 | HTA11_7696_3000711011 | Human | Colorectum | AD | 3.50e-02 | 2.47e-01 | 0.0674 |
| 2203 | FBP1 | HTA11_6818_2000001021 | Human | Colorectum | AD | 1.05e-02 | 2.69e-01 | 0.0588 |
| 2203 | FBP1 | HTA11_99999971662_82457 | Human | Colorectum | MSS | 6.08e-09 | 4.21e-01 | 0.3859 |
| 2203 | FBP1 | LZE24T | Human | Esophagus | ESCC | 9.58e-06 | 2.63e-01 | 0.0596 |
| 2203 | FBP1 | P8T-E | Human | Esophagus | ESCC | 9.53e-09 | 1.91e-01 | 0.0889 |
| 2203 | FBP1 | P28T-E | Human | Esophagus | ESCC | 5.15e-11 | 3.01e-01 | 0.1149 |
| 2203 | FBP1 | P57T-E | Human | Esophagus | ESCC | 1.78e-03 | 1.06e-01 | 0.0926 |
| 2203 | FBP1 | P74T-E | Human | Esophagus | ESCC | 3.83e-04 | 2.67e-01 | 0.1479 |
| 2203 | FBP1 | P75T-E | Human | Esophagus | ESCC | 2.70e-39 | 1.11e+00 | 0.1125 |
| 2203 | FBP1 | P76T-E | Human | Esophagus | ESCC | 1.96e-05 | 1.24e-01 | 0.1207 |
| 2203 | FBP1 | P82T-E | Human | Esophagus | ESCC | 9.61e-07 | 5.53e-01 | 0.1072 |
| 2203 | FBP1 | P94T-E | Human | Esophagus | ESCC | 1.55e-13 | 1.76e+00 | 0.0879 |
| 2203 | FBP1 | P104T-E | Human | Esophagus | ESCC | 3.89e-05 | 4.92e-01 | 0.0931 |
| 2203 | FBP1 | P130T-E | Human | Esophagus | ESCC | 1.75e-25 | 5.56e-01 | 0.1676 |
| 2203 | FBP1 | NAFLD1 | Human | Liver | NAFLD | 4.79e-07 | 5.92e-01 | -0.04 |
| 2203 | FBP1 | S43 | Human | Liver | Cirrhotic | 1.95e-17 | -2.48e-01 | -0.0187 |
| 2203 | FBP1 | HCC1_Meng | Human | Liver | HCC | 5.66e-30 | -4.31e-01 | 0.0246 |
| Page: 1 2 3 |
| Tissue | Expression Dynamics | Abbreviation |
| Colorectum (GSE201348) |  | FAP: Familial adenomatous polyposis |
| CRC: Colorectal cancer | ||
| Colorectum (HTA11) |  | AD: Adenomas |
| SER: Sessile serrated lesions | ||
| MSI-H: Microsatellite-high colorectal cancer | ||
| MSS: Microsatellite stable colorectal cancer | ||
| Esophagus | 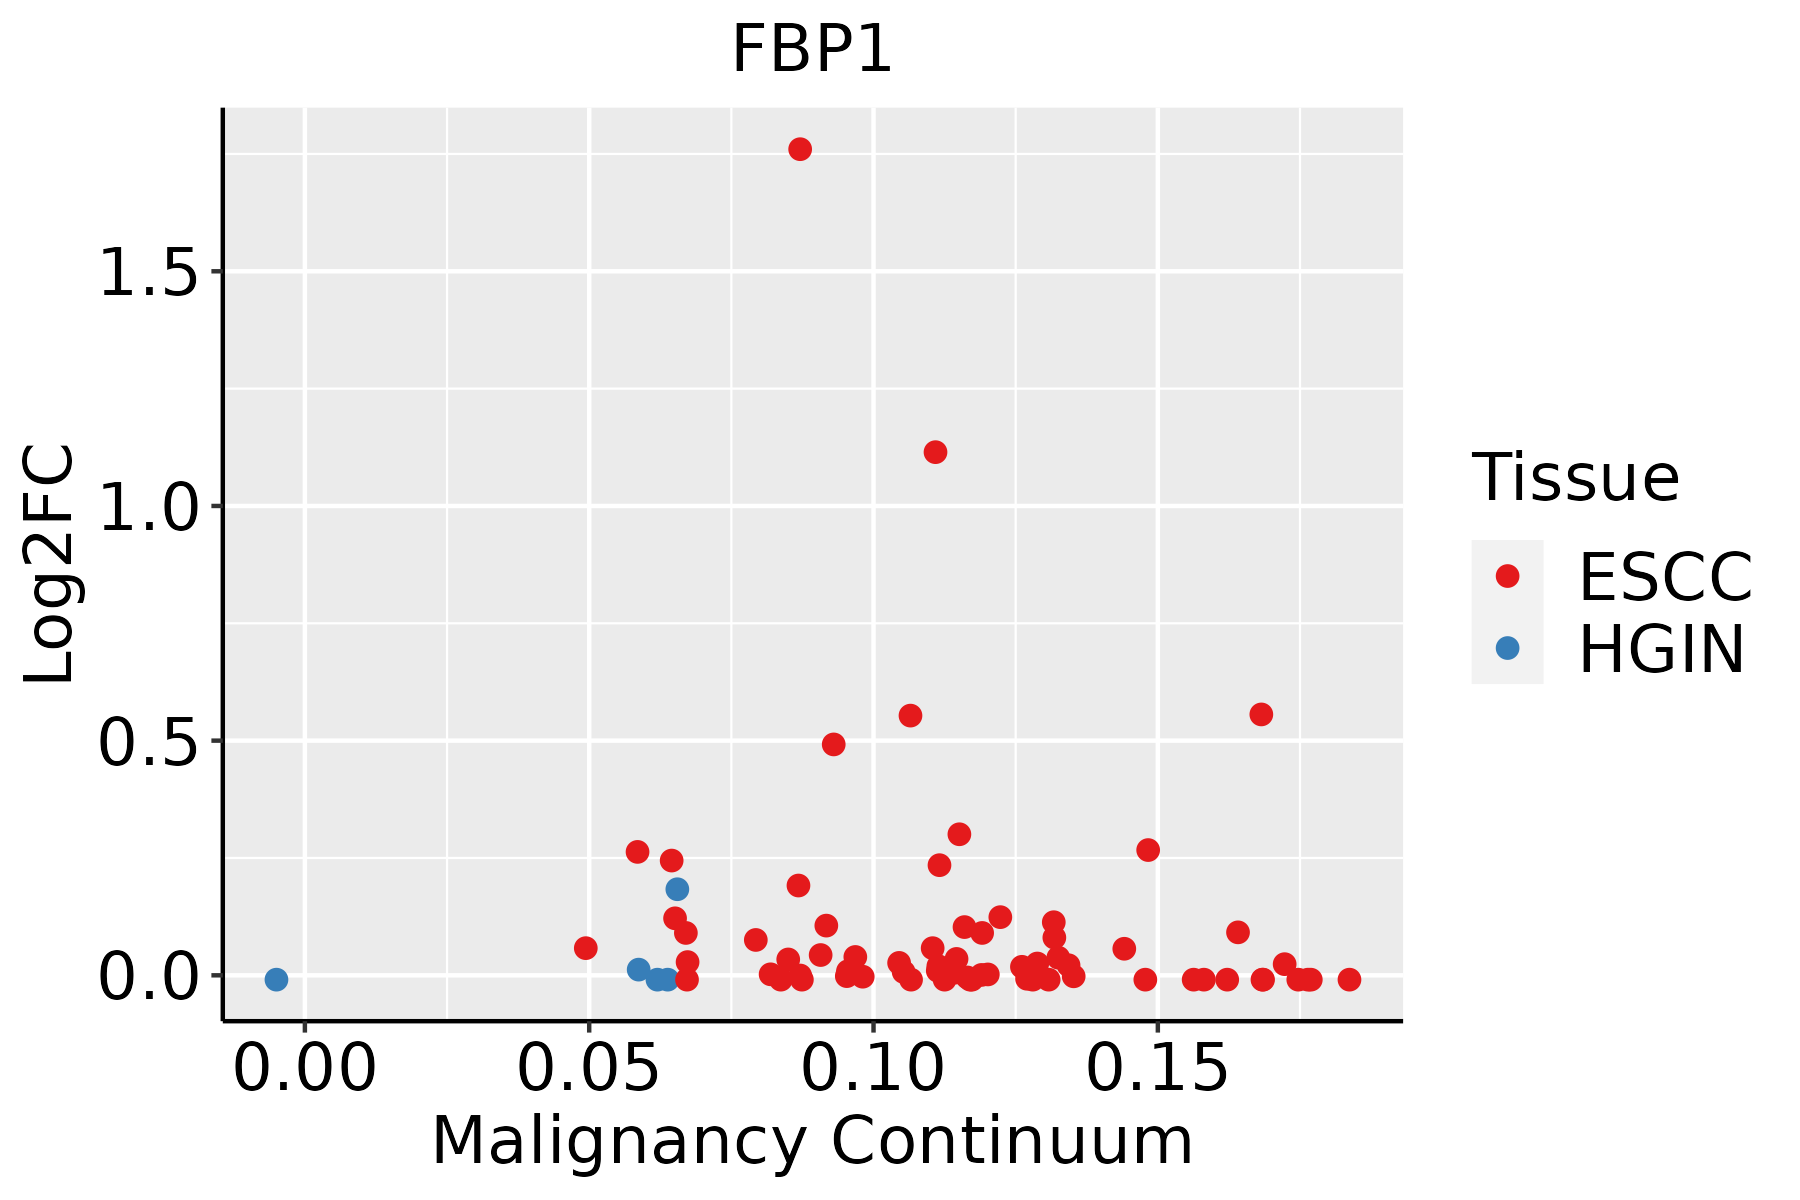 | ESCC: Esophageal squamous cell carcinoma |
| HGIN: High-grade intraepithelial neoplasias | ||
| LGIN: Low-grade intraepithelial neoplasias | ||
| Liver | 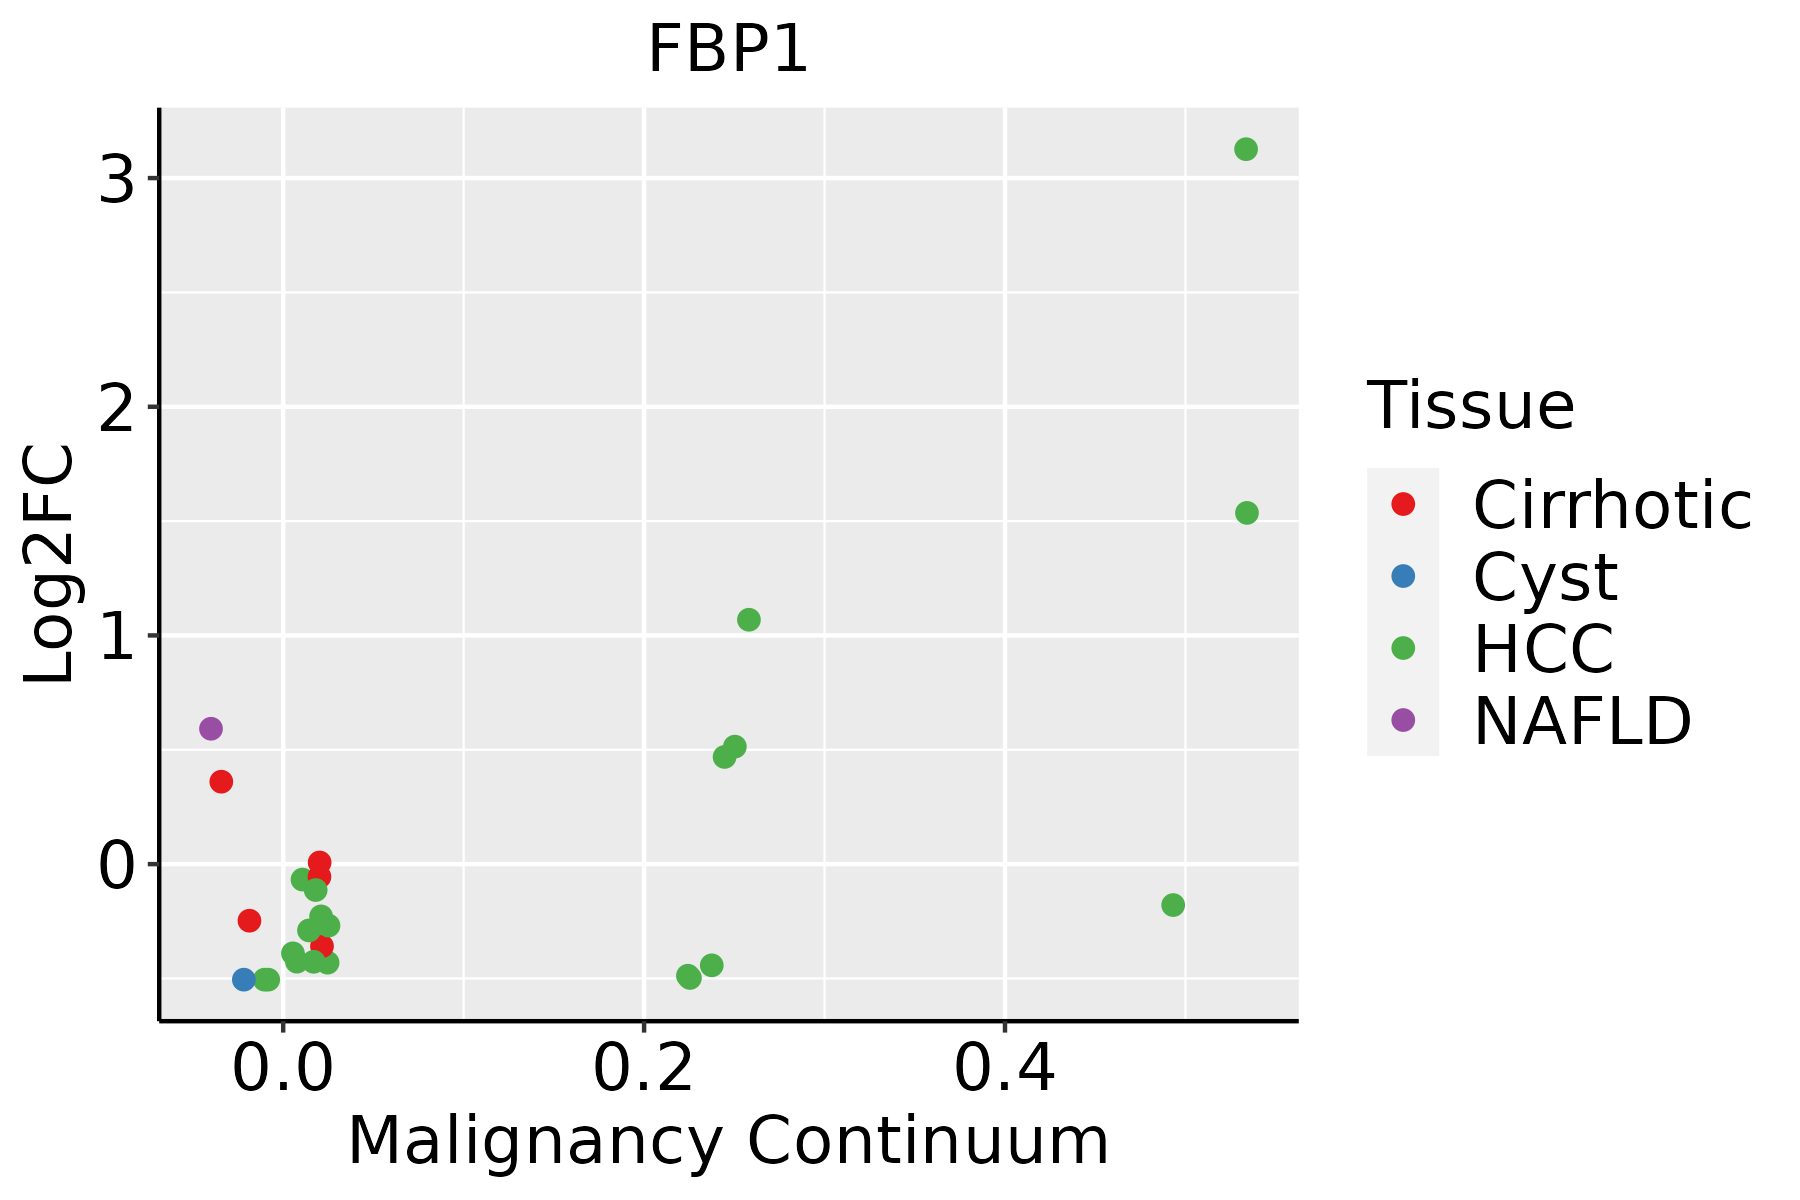 | HCC: Hepatocellular carcinoma |
| NAFLD: Non-alcoholic fatty liver disease | ||
| Prostate | 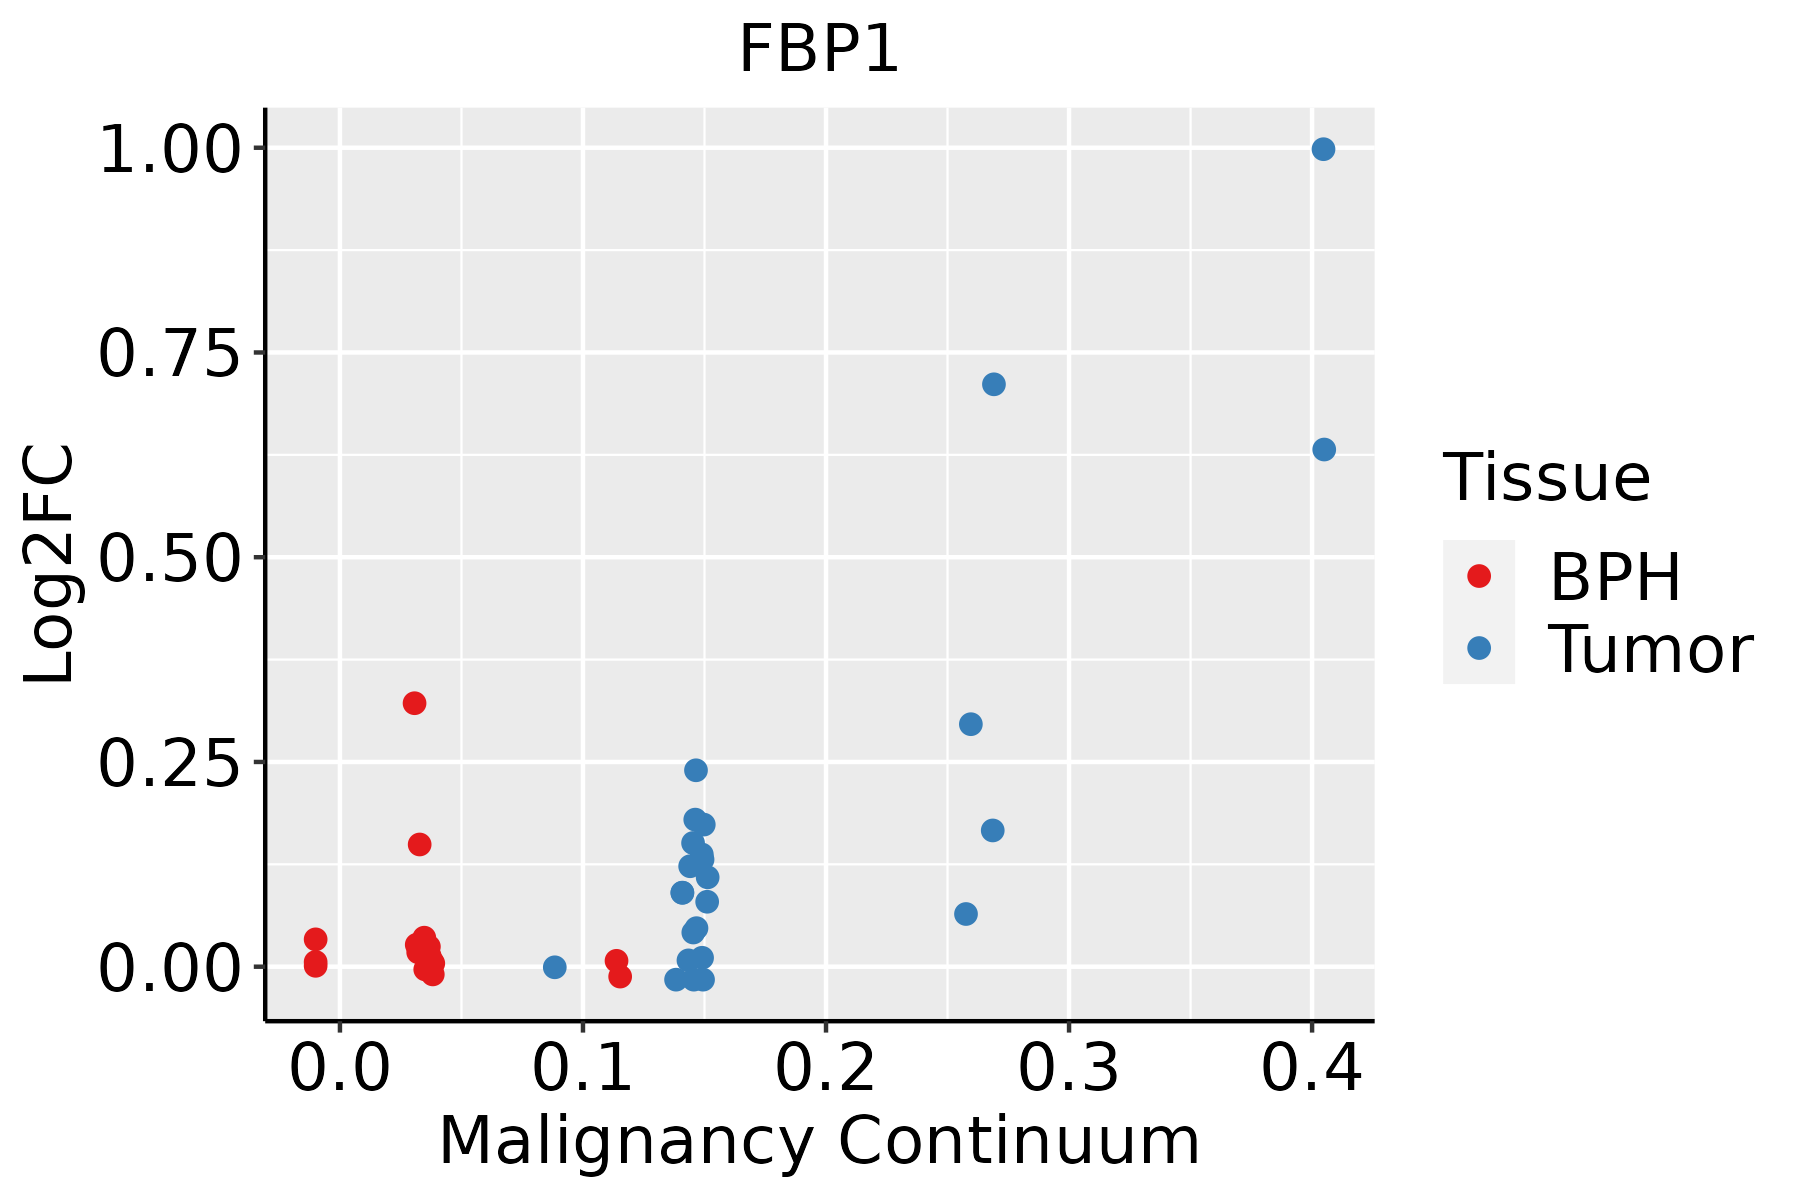 | BPH: Benign Prostatic Hyperplasia |
| Thyroid |  | ATC: Anaplastic thyroid cancer |
| HT: Hashimoto's thyroiditis | ||
| PTC: Papillary thyroid cancer |
| ∗log2FC in expression of this searched gene in stem-like cells from each diseased tissue sample relative to stem-like cells in normal samples in each tissue plotted against the malignancy continuum. Samples are colored based on if they are from different disease stage. |
Top |
Malignant transformation related pathway analysis |
| Find out the enriched GO biological processes and KEGG pathways involved in transition from healthy to precancer to cancer |
| Tissue | Disease Stage | Enriched GO biological Processes |
| Colorectum | AD |  |
| Colorectum | SER |  |
| Colorectum | MSS |  |
| Colorectum | MSI-H |  |
| Colorectum | FAP |  |
| ∗Top 15 enriched GO BP terms are showed in the bar plot of each disease state in each tissue. Each row represents a significant GO biological process which is colored according to the -log10(p.adjust). |
| Page: 1 2 3 4 5 6 7 8 9 |
| GO ID | Tissue | Disease Stage | Description | Gene Ratio | Bg Ratio | pvalue | p.adjust | Count |
| GO:009013210 | Cervix | CC | epithelium migration | 90/2311 | 360/18723 | 2.45e-11 | 6.11e-09 | 90 |
| GO:00016679 | Cervix | CC | ameboidal-type cell migration | 110/2311 | 475/18723 | 2.66e-11 | 6.36e-09 | 110 |
| GO:001063110 | Cervix | CC | epithelial cell migration | 89/2311 | 357/18723 | 3.72e-11 | 8.54e-09 | 89 |
| GO:009013010 | Cervix | CC | tissue migration | 90/2311 | 365/18723 | 5.42e-11 | 1.05e-08 | 90 |
| GO:00506737 | Cervix | CC | epithelial cell proliferation | 98/2311 | 437/18723 | 2.01e-09 | 2.15e-07 | 98 |
| GO:001063210 | Cervix | CC | regulation of epithelial cell migration | 72/2311 | 292/18723 | 4.52e-09 | 4.43e-07 | 72 |
| GO:00506787 | Cervix | CC | regulation of epithelial cell proliferation | 83/2311 | 381/18723 | 1.31e-07 | 6.42e-06 | 83 |
| GO:00106349 | Cervix | CC | positive regulation of epithelial cell migration | 47/2311 | 176/18723 | 1.73e-07 | 8.01e-06 | 47 |
| GO:00435427 | Cervix | CC | endothelial cell migration | 60/2311 | 279/18723 | 1.05e-05 | 2.33e-04 | 60 |
| GO:00105944 | Cervix | CC | regulation of endothelial cell migration | 52/2311 | 232/18723 | 1.20e-05 | 2.54e-04 | 52 |
| GO:00506794 | Cervix | CC | positive regulation of epithelial cell proliferation | 47/2311 | 207/18723 | 2.18e-05 | 3.90e-04 | 47 |
| GO:00105954 | Cervix | CC | positive regulation of endothelial cell migration | 31/2311 | 133/18723 | 3.15e-04 | 3.35e-03 | 31 |
| GO:0043534 | Cervix | CC | blood vessel endothelial cell migration | 37/2311 | 176/18723 | 7.59e-04 | 6.77e-03 | 37 |
| GO:0043535 | Cervix | CC | regulation of blood vessel endothelial cell migration | 32/2311 | 151/18723 | 1.45e-03 | 1.13e-02 | 32 |
| GO:0043536 | Cervix | CC | positive regulation of blood vessel endothelial cell migration | 18/2311 | 76/18723 | 4.45e-03 | 2.71e-02 | 18 |
| GO:001063113 | Cervix | HSIL_HPV | epithelial cell migration | 33/737 | 357/18723 | 5.28e-06 | 2.04e-04 | 33 |
| GO:000166715 | Cervix | HSIL_HPV | ameboidal-type cell migration | 40/737 | 475/18723 | 5.48e-06 | 2.07e-04 | 40 |
| GO:009013213 | Cervix | HSIL_HPV | epithelium migration | 33/737 | 360/18723 | 6.31e-06 | 2.29e-04 | 33 |
| GO:009013013 | Cervix | HSIL_HPV | tissue migration | 33/737 | 365/18723 | 8.43e-06 | 2.97e-04 | 33 |
| GO:005067314 | Cervix | HSIL_HPV | epithelial cell proliferation | 34/737 | 437/18723 | 1.31e-04 | 2.61e-03 | 34 |
| Page: 1 2 3 4 5 6 7 8 9 10 11 12 13 14 15 16 17 18 19 20 21 22 23 24 25 26 27 28 29 30 31 32 33 34 35 |
| Pathway ID | Tissue | Disease Stage | Description | Gene Ratio | Bg Ratio | pvalue | p.adjust | qvalue | Count |
| hsa01200 | Colorectum | AD | Carbon metabolism | 55/2092 | 115/8465 | 5.53e-08 | 8.42e-07 | 5.37e-07 | 55 |
| hsa00010 | Colorectum | AD | Glycolysis / Gluconeogenesis | 34/2092 | 67/8465 | 3.63e-06 | 4.34e-05 | 2.77e-05 | 34 |
| hsa04152 | Colorectum | AD | AMPK signaling pathway | 47/2092 | 121/8465 | 3.74e-04 | 2.82e-03 | 1.80e-03 | 47 |
| hsa04922 | Colorectum | AD | Glucagon signaling pathway | 41/2092 | 107/8465 | 1.18e-03 | 7.75e-03 | 4.94e-03 | 41 |
| hsa00051 | Colorectum | AD | Fructose and mannose metabolism | 17/2092 | 34/8465 | 1.25e-03 | 8.02e-03 | 5.12e-03 | 17 |
| hsa012001 | Colorectum | AD | Carbon metabolism | 55/2092 | 115/8465 | 5.53e-08 | 8.42e-07 | 5.37e-07 | 55 |
| hsa000101 | Colorectum | AD | Glycolysis / Gluconeogenesis | 34/2092 | 67/8465 | 3.63e-06 | 4.34e-05 | 2.77e-05 | 34 |
| hsa041521 | Colorectum | AD | AMPK signaling pathway | 47/2092 | 121/8465 | 3.74e-04 | 2.82e-03 | 1.80e-03 | 47 |
| hsa049221 | Colorectum | AD | Glucagon signaling pathway | 41/2092 | 107/8465 | 1.18e-03 | 7.75e-03 | 4.94e-03 | 41 |
| hsa000511 | Colorectum | AD | Fructose and mannose metabolism | 17/2092 | 34/8465 | 1.25e-03 | 8.02e-03 | 5.12e-03 | 17 |
| hsa000104 | Colorectum | MSS | Glycolysis / Gluconeogenesis | 28/1875 | 67/8465 | 2.36e-04 | 1.81e-03 | 1.11e-03 | 28 |
| hsa049224 | Colorectum | MSS | Glucagon signaling pathway | 39/1875 | 107/8465 | 5.00e-04 | 3.45e-03 | 2.11e-03 | 39 |
| hsa041522 | Colorectum | MSS | AMPK signaling pathway | 41/1875 | 121/8465 | 1.91e-03 | 9.83e-03 | 6.03e-03 | 41 |
| hsa04910 | Colorectum | MSS | Insulin signaling pathway | 43/1875 | 137/8465 | 7.37e-03 | 2.84e-02 | 1.74e-02 | 43 |
| hsa000105 | Colorectum | MSS | Glycolysis / Gluconeogenesis | 28/1875 | 67/8465 | 2.36e-04 | 1.81e-03 | 1.11e-03 | 28 |
| hsa049225 | Colorectum | MSS | Glucagon signaling pathway | 39/1875 | 107/8465 | 5.00e-04 | 3.45e-03 | 2.11e-03 | 39 |
| hsa041523 | Colorectum | MSS | AMPK signaling pathway | 41/1875 | 121/8465 | 1.91e-03 | 9.83e-03 | 6.03e-03 | 41 |
| hsa049101 | Colorectum | MSS | Insulin signaling pathway | 43/1875 | 137/8465 | 7.37e-03 | 2.84e-02 | 1.74e-02 | 43 |
| hsa0120023 | Esophagus | ESCC | Carbon metabolism | 79/4205 | 115/8465 | 2.50e-05 | 1.21e-04 | 6.22e-05 | 79 |
| hsa0415210 | Esophagus | ESCC | AMPK signaling pathway | 80/4205 | 121/8465 | 1.73e-04 | 6.67e-04 | 3.42e-04 | 80 |
| Page: 1 2 3 4 |
Top |
Cell-cell communication analysis |
| Identification of potential cell-cell interactions between two cell types and their ligand-receptor pairs for different disease states |
| Ligand | Receptor | LRpair | Pathway | Tissue | Disease Stage |
| Page: 1 |
Top |
Single-cell gene regulatory network inference analysis |
| Find out the significant the regulons (TFs) and the target genes of each regulon across cell types for different disease states |
| TF | Cell Type | Tissue | Disease Stage | Target Gene | RSS | Regulon Activity |
| ∗The dot plots of a searched regulon are shown for all cell subpopulations in each disease state of each tissue based on the regulon specific score inferred using pySCENIC and by calculating the average expression. |
| Page: 1 |
Top |
Somatic mutation of malignant transformation related genes |
| Annotation of somatic variants for genes involved in malignant transformation |
| Hugo Symbol | Variant Class | Variant Classification | dbSNP RS | HGVSc | HGVSp | HGVSp Short | SWISSPROT | BIOTYPE | SIFT | PolyPhen | Tumor Sample Barcode | Tissue | Histology | Sex | Age | Stage | Therapy Types | Drugs | Outcome |
| FBP1 | SNV | Missense_Mutation | novel | c.1007N>T | p.Ser336Phe | p.S336F | P09467 | protein_coding | deleterious(0.01) | benign(0.284) | TCGA-A8-A08L-01 | Breast | breast invasive carcinoma | Female | >=65 | III/IV | Unknown | Unknown | SD |
| FBP1 | SNV | Missense_Mutation | c.747N>A | p.Met249Ile | p.M249I | P09467 | protein_coding | deleterious(0) | possibly_damaging(0.476) | TCGA-A8-A09I-01 | Breast | breast invasive carcinoma | Female | >=65 | I/II | Hormone Therapy | anastrozole | SD | |
| FBP1 | SNV | Missense_Mutation | novel | c.145G>C | p.Val49Leu | p.V49L | P09467 | protein_coding | deleterious(0.02) | benign(0.366) | TCGA-AR-A2LE-01 | Breast | breast invasive carcinoma | Female | >=65 | I/II | Hormone Therapy | tamoxiphen | PD |
| FBP1 | SNV | Missense_Mutation | novel | c.923N>T | p.Pro308Leu | p.P308L | P09467 | protein_coding | deleterious(0) | probably_damaging(0.992) | TCGA-AR-A5QM-01 | Breast | breast invasive carcinoma | Female | <65 | I/II | Hormone Therapy | anastrozole | PD |
| FBP1 | SNV | Missense_Mutation | novel | c.323N>A | p.Pro108Gln | p.P108Q | P09467 | protein_coding | tolerated(0.21) | benign(0.028) | TCGA-VS-A9UJ-01 | Cervix | cervical & endocervical cancer | Female | <65 | I/II | Unknown | Unknown | PD |
| FBP1 | SNV | Missense_Mutation | novel | c.299N>C | p.Asp100Ala | p.D100A | P09467 | protein_coding | tolerated(0.05) | benign(0.069) | TCGA-AA-A02R-01 | Colorectum | colon adenocarcinoma | Female | >=65 | I/II | Unknown | Unknown | PD |
| FBP1 | SNV | Missense_Mutation | c.88N>A | p.Glu30Lys | p.E30K | P09467 | protein_coding | deleterious(0) | benign(0.247) | TCGA-AZ-6599-01 | Colorectum | colon adenocarcinoma | Male | >=65 | I/II | Unknown | Unknown | SD | |
| FBP1 | SNV | Missense_Mutation | novel | c.931N>G | p.Ile311Val | p.I311V | P09467 | protein_coding | deleterious(0.02) | possibly_damaging(0.47) | TCGA-G4-6295-01 | Colorectum | colon adenocarcinoma | Female | >=65 | I/II | Unknown | Unknown | SD |
| FBP1 | deletion | Frame_Shift_Del | c.881delN | p.Gly294GlufsTer11 | p.G294Efs*11 | P09467 | protein_coding | TCGA-A6-5661-01 | Colorectum | colon adenocarcinoma | Female | >=65 | I/II | Unknown | Unknown | SD | |||
| FBP1 | SNV | Missense_Mutation | novel | c.1010N>T | p.Ala337Val | p.A337V | P09467 | protein_coding | tolerated(0.08) | benign(0) | TCGA-A5-A0G1-01 | Endometrium | uterine corpus endometrioid carcinoma | Female | >=65 | I/II | Unknown | Unknown | SD |
| Page: 1 2 3 4 |
Top |
Related drugs of malignant transformation related genes |
| Identification of chemicals and drugs interact with genes involved in malignant transfromation |
| (DGIdb 4.0) |
| Entrez ID | Symbol | Category | Interaction Types | Drug Claim Name | Drug Name | PMIDs |
| 2203 | FBP1 | DRUGGABLE GENOME, ENZYME | MB07803 | MB-07803 | ||
| 2203 | FBP1 | DRUGGABLE GENOME, ENZYME | MB07803 | MB-07803 | ||
| 2203 | FBP1 | DRUGGABLE GENOME, ENZYME | Managlinat dialanetil |
| Page: 1 |

Copyright 2023-Present -The University of Texas Health Science Center at Houston |