
|
|||||
|
 | |
| |
| |
| |
| |
| |
|
Gene: FBN2 |
Gene summary for FBN2 |
| Gene information | Species | Human | Gene symbol | FBN2 | Gene ID | 2201 |
| Gene name | fibrillin 2 | |
| Gene Alias | CCA | |
| Cytomap | 5q23.3 | |
| Gene Type | protein-coding | GO ID | GO:0001501 | UniProtAcc | P35556 |
Top |
Malignant transformation analysis |
| Identification of the aberrant gene expression in precancerous and cancerous lesions by comparing the gene expression of stem-like cells in diseased tissues with normal stem cells |
| Entrez ID | Symbol | Replicates | Species | Organ | Tissue | Adj P-value | Log2FC | Malignancy |
| 2201 | FBN2 | LZE7T | Human | Esophagus | ESCC | 6.19e-05 | 4.16e-01 | 0.0667 |
| 2201 | FBN2 | P9T-E | Human | Esophagus | ESCC | 3.49e-19 | 6.02e-01 | 0.1131 |
| 2201 | FBN2 | P10T-E | Human | Esophagus | ESCC | 1.15e-23 | 5.76e-01 | 0.116 |
| 2201 | FBN2 | P12T-E | Human | Esophagus | ESCC | 1.77e-15 | 5.53e-01 | 0.1122 |
| 2201 | FBN2 | P15T-E | Human | Esophagus | ESCC | 8.30e-04 | 1.94e-01 | 0.1149 |
| 2201 | FBN2 | P16T-E | Human | Esophagus | ESCC | 6.34e-08 | 1.29e-01 | 0.1153 |
| 2201 | FBN2 | P22T-E | Human | Esophagus | ESCC | 1.98e-07 | 2.69e-01 | 0.1236 |
| 2201 | FBN2 | P28T-E | Human | Esophagus | ESCC | 4.10e-14 | 5.12e-01 | 0.1149 |
| 2201 | FBN2 | P30T-E | Human | Esophagus | ESCC | 2.66e-21 | 1.31e+00 | 0.137 |
| 2201 | FBN2 | P49T-E | Human | Esophagus | ESCC | 4.57e-04 | 7.98e-01 | 0.1768 |
| 2201 | FBN2 | P52T-E | Human | Esophagus | ESCC | 1.59e-09 | 3.38e-01 | 0.1555 |
| 2201 | FBN2 | P65T-E | Human | Esophagus | ESCC | 3.59e-03 | 1.06e-01 | 0.0978 |
| 2201 | FBN2 | P75T-E | Human | Esophagus | ESCC | 1.18e-03 | 8.29e-02 | 0.1125 |
| 2201 | FBN2 | P79T-E | Human | Esophagus | ESCC | 2.47e-06 | 2.07e-01 | 0.1154 |
| 2201 | FBN2 | male-WTA | Human | Thyroid | PTC | 7.24e-07 | 8.79e-02 | 0.1037 |
| 2201 | FBN2 | ATC09 | Human | Thyroid | ATC | 1.32e-08 | 4.01e-01 | 0.2871 |
| 2201 | FBN2 | ATC13 | Human | Thyroid | ATC | 6.74e-62 | 1.21e+00 | 0.34 |
| 2201 | FBN2 | ATC1 | Human | Thyroid | ATC | 1.27e-07 | 4.76e-01 | 0.2878 |
| 2201 | FBN2 | ATC2 | Human | Thyroid | ATC | 1.31e-13 | 1.01e+00 | 0.34 |
| 2201 | FBN2 | ATC5 | Human | Thyroid | ATC | 1.22e-72 | 1.29e+00 | 0.34 |
| Page: 1 |
| Tissue | Expression Dynamics | Abbreviation |
| Esophagus |  | ESCC: Esophageal squamous cell carcinoma |
| HGIN: High-grade intraepithelial neoplasias | ||
| LGIN: Low-grade intraepithelial neoplasias | ||
| Thyroid | 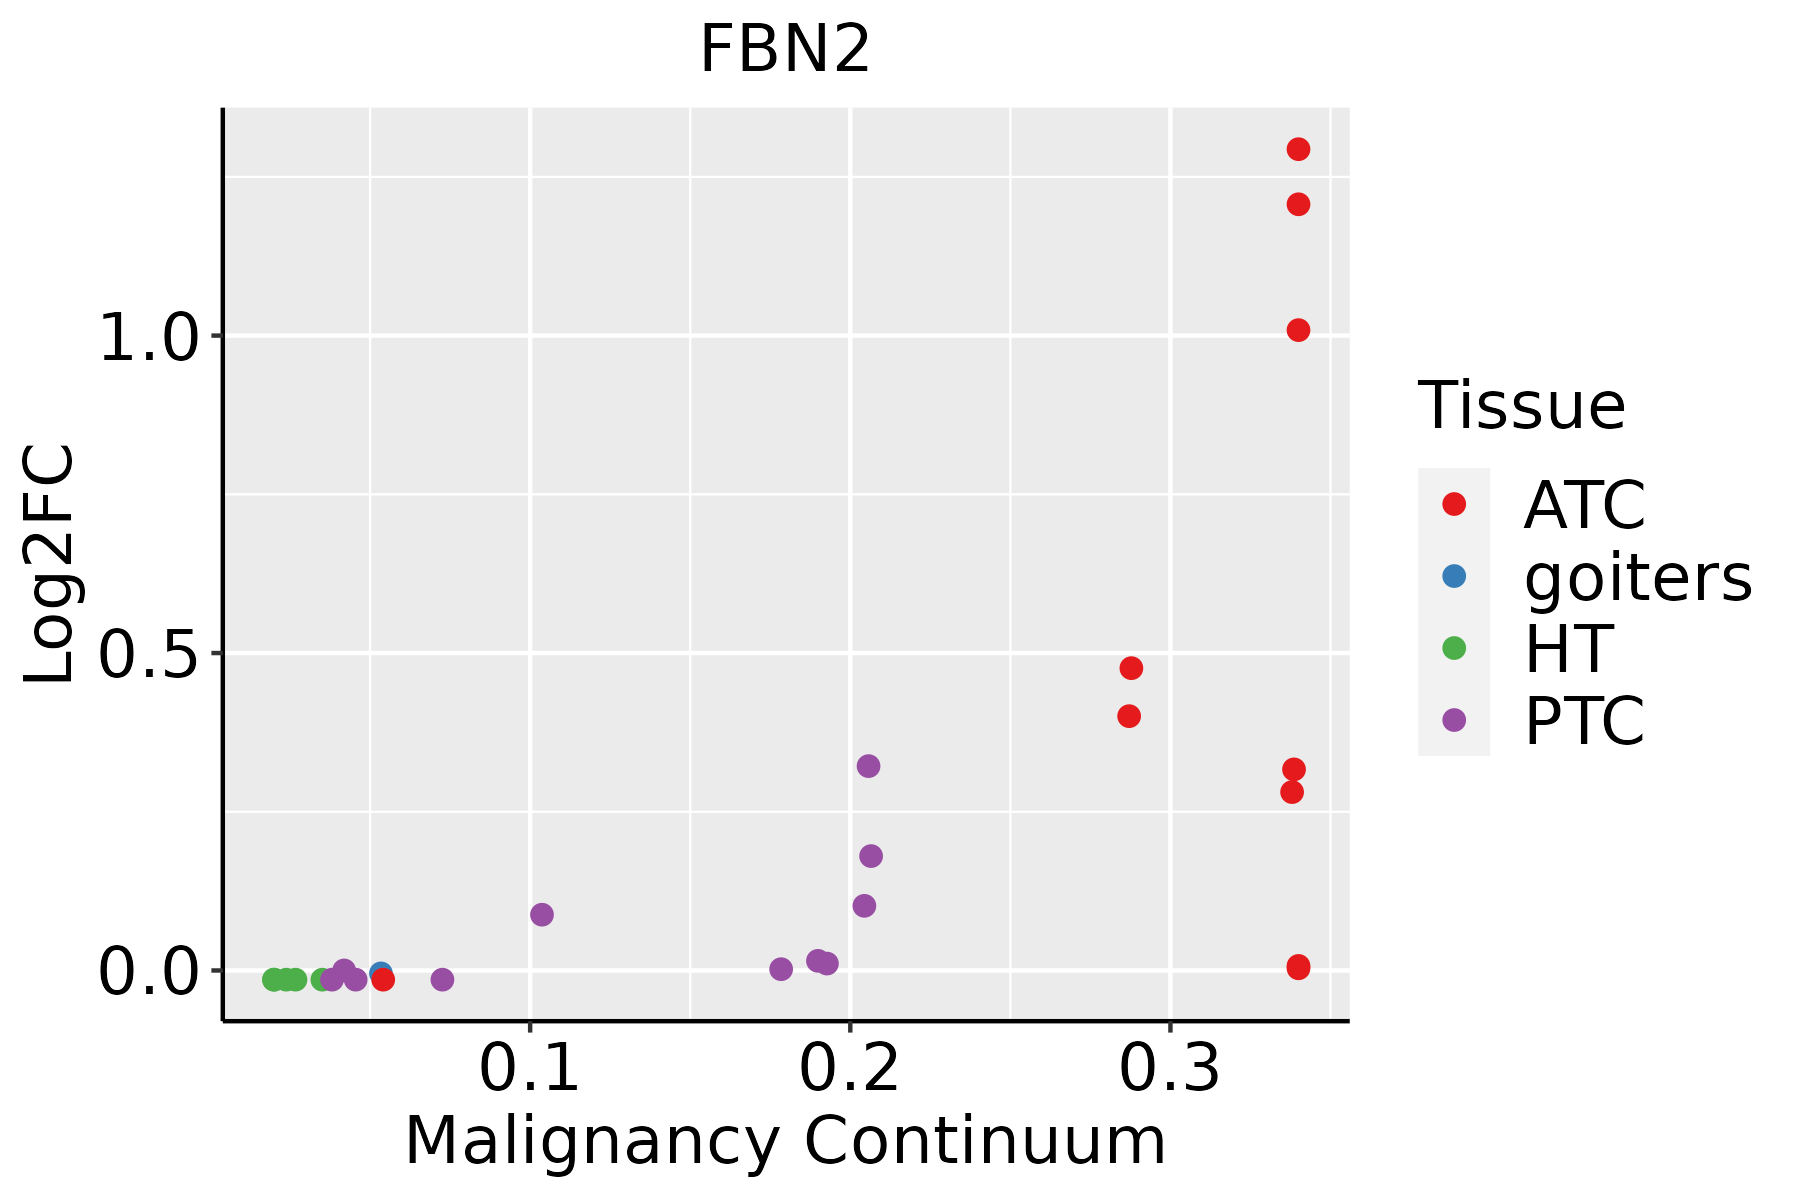 | ATC: Anaplastic thyroid cancer |
| HT: Hashimoto's thyroiditis | ||
| PTC: Papillary thyroid cancer |
| ∗log2FC in expression of this searched gene in stem-like cells from each diseased tissue sample relative to stem-like cells in normal samples in each tissue plotted against the malignancy continuum. Samples are colored based on if they are from different disease stage. |
Top |
Malignant transformation related pathway analysis |
| Find out the enriched GO biological processes and KEGG pathways involved in transition from healthy to precancer to cancer |
| Tissue | Disease Stage | Enriched GO biological Processes |
| Colorectum | AD |  |
| Colorectum | SER |  |
| Colorectum | MSS |  |
| Colorectum | MSI-H |  |
| Colorectum | FAP |  |
| ∗Top 15 enriched GO BP terms are showed in the bar plot of each disease state in each tissue. Each row represents a significant GO biological process which is colored according to the -log10(p.adjust). |
| Page: 1 2 3 4 5 6 7 8 9 |
| GO ID | Tissue | Disease Stage | Description | Gene Ratio | Bg Ratio | pvalue | p.adjust | Count |
| GO:0045185111 | Esophagus | ESCC | maintenance of protein location | 71/8552 | 94/18723 | 3.41e-09 | 7.24e-08 | 71 |
| GO:0051235110 | Esophagus | ESCC | maintenance of location | 200/8552 | 327/18723 | 1.01e-08 | 2.02e-07 | 200 |
| GO:00715599 | Esophagus | ESCC | response to transforming growth factor beta | 157/8552 | 256/18723 | 2.95e-07 | 4.23e-06 | 157 |
| GO:000164918 | Esophagus | ESCC | osteoblast differentiation | 140/8552 | 229/18723 | 1.63e-06 | 1.95e-05 | 140 |
| GO:00715609 | Esophagus | ESCC | cellular response to transforming growth factor beta stimulus | 151/8552 | 250/18723 | 1.78e-06 | 2.10e-05 | 151 |
| GO:000150317 | Esophagus | ESCC | ossification | 232/8552 | 408/18723 | 3.00e-06 | 3.40e-05 | 232 |
| GO:00071799 | Esophagus | ESCC | transforming growth factor beta receptor signaling pathway | 121/8552 | 198/18723 | 8.26e-06 | 8.03e-05 | 121 |
| GO:000717810 | Esophagus | ESCC | transmembrane receptor protein serine/threonine kinase signaling pathway | 195/8552 | 355/18723 | 2.58e-04 | 1.58e-03 | 195 |
| GO:00485687 | Esophagus | ESCC | embryonic organ development | 228/8552 | 427/18723 | 7.28e-04 | 3.79e-03 | 228 |
| GO:00487367 | Esophagus | ESCC | appendage development | 98/8552 | 172/18723 | 1.83e-03 | 8.37e-03 | 98 |
| GO:00601737 | Esophagus | ESCC | limb development | 98/8552 | 172/18723 | 1.83e-03 | 8.37e-03 | 98 |
| GO:00170156 | Esophagus | ESCC | regulation of transforming growth factor beta receptor signaling pathway | 75/8552 | 128/18723 | 2.19e-03 | 9.71e-03 | 75 |
| GO:00456675 | Esophagus | ESCC | regulation of osteoblast differentiation | 77/8552 | 132/18723 | 2.28e-03 | 1.00e-02 | 77 |
| GO:19038447 | Esophagus | ESCC | regulation of cellular response to transforming growth factor beta stimulus | 76/8552 | 131/18723 | 2.96e-03 | 1.24e-02 | 76 |
| GO:00456695 | Esophagus | ESCC | positive regulation of osteoblast differentiation | 43/8552 | 69/18723 | 3.93e-03 | 1.59e-02 | 43 |
| GO:00487052 | Esophagus | ESCC | skeletal system morphogenesis | 120/8552 | 220/18723 | 4.90e-03 | 1.89e-02 | 120 |
| GO:007169210 | Esophagus | ESCC | protein localization to extracellular region | 193/8552 | 368/18723 | 5.01e-03 | 1.92e-02 | 193 |
| GO:0045185113 | Thyroid | PTC | maintenance of protein location | 64/5968 | 94/18723 | 5.92e-13 | 2.85e-11 | 64 |
| GO:007155919 | Thyroid | PTC | response to transforming growth factor beta | 131/5968 | 256/18723 | 9.20e-11 | 3.17e-09 | 131 |
| GO:007156019 | Thyroid | PTC | cellular response to transforming growth factor beta stimulus | 126/5968 | 250/18723 | 7.34e-10 | 2.19e-08 | 126 |
| Page: 1 2 3 4 |
| Pathway ID | Tissue | Disease Stage | Description | Gene Ratio | Bg Ratio | pvalue | p.adjust | qvalue | Count |
| Page: 1 |
Top |
Cell-cell communication analysis |
| Identification of potential cell-cell interactions between two cell types and their ligand-receptor pairs for different disease states |
| Ligand | Receptor | LRpair | Pathway | Tissue | Disease Stage |
| Page: 1 |
Top |
Single-cell gene regulatory network inference analysis |
| Find out the significant the regulons (TFs) and the target genes of each regulon across cell types for different disease states |
| TF | Cell Type | Tissue | Disease Stage | Target Gene | RSS | Regulon Activity |
| ∗The dot plots of a searched regulon are shown for all cell subpopulations in each disease state of each tissue based on the regulon specific score inferred using pySCENIC and by calculating the average expression. |
| Page: 1 |
Top |
Somatic mutation of malignant transformation related genes |
| Annotation of somatic variants for genes involved in malignant transformation |
| Hugo Symbol | Variant Class | Variant Classification | dbSNP RS | HGVSc | HGVSp | HGVSp Short | SWISSPROT | BIOTYPE | SIFT | PolyPhen | Tumor Sample Barcode | Tissue | Histology | Sex | Age | Stage | Therapy Types | Drugs | Outcome |
| FBN2 | SNV | Missense_Mutation | rs150735582 | c.2480N>A | p.Arg827Gln | p.R827Q | P35556 | protein_coding | tolerated(0.1) | probably_damaging(0.992) | TCGA-A2-A0EY-01 | Breast | breast invasive carcinoma | Female | <65 | I/II | Chemotherapy | adriamycin | SD |
| FBN2 | SNV | Missense_Mutation | c.533N>A | p.Pro178His | p.P178H | P35556 | protein_coding | deleterious(0.02) | probably_damaging(0.996) | TCGA-A2-A0SV-01 | Breast | breast invasive carcinoma | Female | <65 | III/IV | Other, specify in notesBisphosphonate therapy | zometa | PD | |
| FBN2 | SNV | Missense_Mutation | rs563228953 | c.1180N>T | p.Arg394Cys | p.R394C | P35556 | protein_coding | deleterious(0) | possibly_damaging(0.873) | TCGA-A8-A0A7-01 | Breast | breast invasive carcinoma | Female | <65 | I/II | Unknown | Unknown | SD |
| FBN2 | SNV | Missense_Mutation | c.7477N>C | p.Asp2493His | p.D2493H | P35556 | protein_coding | deleterious(0) | probably_damaging(0.999) | TCGA-AC-A23H-01 | Breast | breast invasive carcinoma | Female | >=65 | I/II | Unknown | Unknown | PD | |
| FBN2 | SNV | Missense_Mutation | c.3226N>A | p.Glu1076Lys | p.E1076K | P35556 | protein_coding | deleterious(0) | probably_damaging(0.992) | TCGA-AC-A23H-01 | Breast | breast invasive carcinoma | Female | >=65 | I/II | Unknown | Unknown | PD | |
| FBN2 | SNV | Missense_Mutation | c.1733A>G | p.Glu578Gly | p.E578G | P35556 | protein_coding | deleterious(0) | probably_damaging(0.988) | TCGA-AN-A0AK-01 | Breast | breast invasive carcinoma | Female | >=65 | I/II | Unknown | Unknown | SD | |
| FBN2 | SNV | Missense_Mutation | novel | c.3034N>C | p.Cys1012Arg | p.C1012R | P35556 | protein_coding | deleterious(0) | benign(0.026) | TCGA-BH-A0EB-01 | Breast | breast invasive carcinoma | Female | >=65 | I/II | Hormone Therapy | arimidex | SD |
| FBN2 | SNV | Missense_Mutation | c.2771N>A | p.Leu924His | p.L924H | P35556 | protein_coding | deleterious(0) | probably_damaging(0.999) | TCGA-C8-A12K-01 | Breast | breast invasive carcinoma | Female | >=65 | I/II | Unknown | Unknown | SD | |
| FBN2 | SNV | Missense_Mutation | c.7580N>T | p.Gly2527Val | p.G2527V | P35556 | protein_coding | deleterious(0) | probably_damaging(0.997) | TCGA-C8-A27B-01 | Breast | breast invasive carcinoma | Female | <65 | I/II | Chemotherapy | 5-fluorouracil | CR | |
| FBN2 | SNV | Missense_Mutation | c.1858N>A | p.Glu620Lys | p.E620K | P35556 | protein_coding | deleterious(0.02) | probably_damaging(0.987) | TCGA-D8-A27G-01 | Breast | breast invasive carcinoma | Female | >=65 | I/II | Unknown | Unknown | SD |
| Page: 1 2 3 4 5 6 7 8 9 10 11 12 13 14 15 16 17 18 19 20 21 22 23 24 25 26 27 28 29 30 31 32 33 34 35 36 37 38 39 40 41 |
Top |
Related drugs of malignant transformation related genes |
| Identification of chemicals and drugs interact with genes involved in malignant transfromation |
| (DGIdb 4.0) |
| Entrez ID | Symbol | Category | Interaction Types | Drug Claim Name | Drug Name | PMIDs |
| Page: 1 |

Copyright 2023-Present -The University of Texas Health Science Center at Houston |