
|
|||||
|
 | |
| |
| |
| |
| |
| |
|
Gene: FBN1 |
Gene summary for FBN1 |
| Gene information | Species | Human | Gene symbol | FBN1 | Gene ID | 2200 |
| Gene name | fibrillin 1 | |
| Gene Alias | ACMICD | |
| Cytomap | 15q21.1 | |
| Gene Type | protein-coding | GO ID | GO:0001501 | UniProtAcc | P35555 |
Top |
Malignant transformation analysis |
| Identification of the aberrant gene expression in precancerous and cancerous lesions by comparing the gene expression of stem-like cells in diseased tissues with normal stem cells |
| Entrez ID | Symbol | Replicates | Species | Organ | Tissue | Adj P-value | Log2FC | Malignancy |
| 2200 | FBN1 | C06 | Human | Oral cavity | OSCC | 1.29e-02 | 7.83e-01 | 0.2699 |
| 2200 | FBN1 | EOLP-1 | Human | Oral cavity | EOLP | 4.89e-02 | 1.41e-01 | -0.0202 |
| 2200 | FBN1 | NEOLP-1 | Human | Oral cavity | NEOLP | 5.91e-14 | 6.33e-01 | -0.0194 |
| 2200 | FBN1 | NEOLP-2 | Human | Oral cavity | NEOLP | 3.01e-06 | 3.07e-01 | -0.0196 |
| 2200 | FBN1 | NEOLP-3 | Human | Oral cavity | NEOLP | 1.39e-05 | 2.56e-01 | -0.0191 |
| 2200 | FBN1 | SYSMH4 | Human | Oral cavity | OSCC | 1.66e-02 | -1.49e-01 | 0.1226 |
| 2200 | FBN1 | male-WTA | Human | Thyroid | PTC | 6.15e-20 | 3.11e-01 | 0.1037 |
| 2200 | FBN1 | PTC01 | Human | Thyroid | PTC | 4.67e-04 | 2.77e-01 | 0.1899 |
| 2200 | FBN1 | PTC04 | Human | Thyroid | PTC | 1.70e-10 | 3.75e-01 | 0.1927 |
| 2200 | FBN1 | PTC05 | Human | Thyroid | PTC | 3.32e-06 | 1.71e-01 | 0.2065 |
| 2200 | FBN1 | PTC06 | Human | Thyroid | PTC | 9.15e-18 | 8.21e-01 | 0.2057 |
| 2200 | FBN1 | PTC07 | Human | Thyroid | PTC | 4.18e-18 | 6.22e-01 | 0.2044 |
| 2200 | FBN1 | ATC09 | Human | Thyroid | ATC | 5.61e-10 | 3.85e-01 | 0.2871 |
| 2200 | FBN1 | ATC11 | Human | Thyroid | ATC | 2.26e-05 | 1.04e+00 | 0.3386 |
| 2200 | FBN1 | ATC12 | Human | Thyroid | ATC | 1.24e-56 | 1.26e+00 | 0.34 |
| 2200 | FBN1 | ATC13 | Human | Thyroid | ATC | 4.64e-100 | 2.72e+00 | 0.34 |
| 2200 | FBN1 | ATC1 | Human | Thyroid | ATC | 7.57e-08 | 4.44e-01 | 0.2878 |
| 2200 | FBN1 | ATC2 | Human | Thyroid | ATC | 2.39e-16 | 1.61e+00 | 0.34 |
| 2200 | FBN1 | ATC3 | Human | Thyroid | ATC | 3.90e-14 | 1.15e+00 | 0.338 |
| 2200 | FBN1 | ATC4 | Human | Thyroid | ATC | 7.62e-67 | 1.48e+00 | 0.34 |
| Page: 1 2 |
| Tissue | Expression Dynamics | Abbreviation |
| Oral Cavity |  | EOLP: Erosive Oral lichen planus |
| LP: leukoplakia | ||
| NEOLP: Non-erosive oral lichen planus | ||
| OSCC: Oral squamous cell carcinoma | ||
| Thyroid | 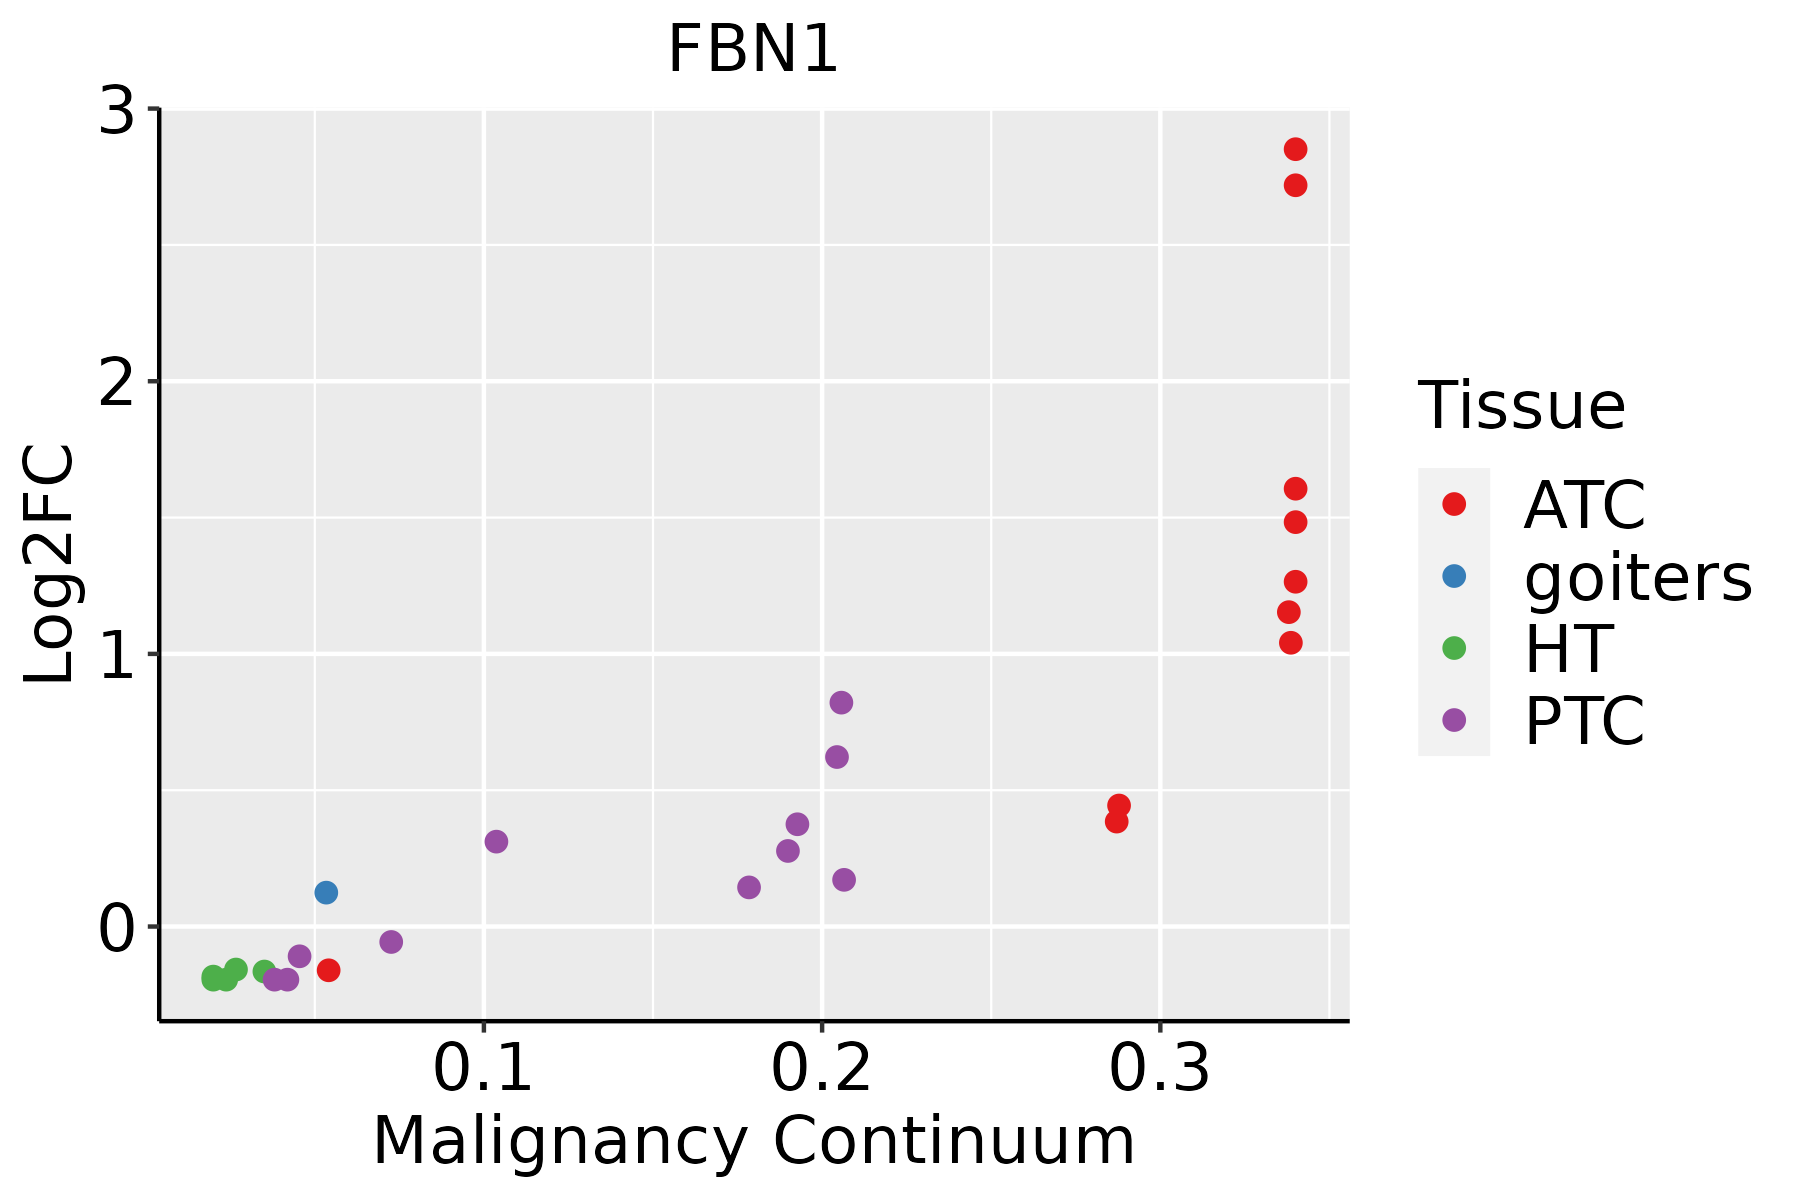 | ATC: Anaplastic thyroid cancer |
| HT: Hashimoto's thyroiditis | ||
| PTC: Papillary thyroid cancer |
| ∗log2FC in expression of this searched gene in stem-like cells from each diseased tissue sample relative to stem-like cells in normal samples in each tissue plotted against the malignancy continuum. Samples are colored based on if they are from different disease stage. |
Top |
Malignant transformation related pathway analysis |
| Find out the enriched GO biological processes and KEGG pathways involved in transition from healthy to precancer to cancer |
| Tissue | Disease Stage | Enriched GO biological Processes |
| Colorectum | AD |  |
| Colorectum | SER |  |
| Colorectum | MSS |  |
| Colorectum | MSI-H |  |
| Colorectum | FAP |  |
| ∗Top 15 enriched GO BP terms are showed in the bar plot of each disease state in each tissue. Each row represents a significant GO biological process which is colored according to the -log10(p.adjust). |
| Page: 1 2 3 4 5 6 7 8 9 |
| GO ID | Tissue | Disease Stage | Description | Gene Ratio | Bg Ratio | pvalue | p.adjust | Count |
| GO:003009920 | Oral cavity | OSCC | myeloid cell differentiation | 213/7305 | 381/18723 | 1.24e-11 | 4.42e-10 | 213 |
| GO:005123518 | Oral cavity | OSCC | maintenance of location | 182/7305 | 327/18723 | 6.16e-10 | 1.58e-08 | 182 |
| GO:004518520 | Oral cavity | OSCC | maintenance of protein location | 65/7305 | 94/18723 | 3.00e-09 | 6.88e-08 | 65 |
| GO:190165316 | Oral cavity | OSCC | cellular response to peptide | 194/7305 | 359/18723 | 4.31e-09 | 9.57e-08 | 194 |
| GO:000257310 | Oral cavity | OSCC | myeloid leukocyte differentiation | 119/7305 | 208/18723 | 7.29e-08 | 1.29e-06 | 119 |
| GO:00715598 | Oral cavity | OSCC | response to transforming growth factor beta | 140/7305 | 256/18723 | 2.34e-07 | 3.70e-06 | 140 |
| GO:00715608 | Oral cavity | OSCC | cellular response to transforming growth factor beta stimulus | 137/7305 | 250/18723 | 2.68e-07 | 4.15e-06 | 137 |
| GO:007137510 | Oral cavity | OSCC | cellular response to peptide hormone stimulus | 153/7305 | 290/18723 | 1.23e-06 | 1.63e-05 | 153 |
| GO:004343419 | Oral cavity | OSCC | response to peptide hormone | 208/7305 | 414/18723 | 1.83e-06 | 2.35e-05 | 208 |
| GO:00071798 | Oral cavity | OSCC | transforming growth factor beta receptor signaling pathway | 109/7305 | 198/18723 | 3.21e-06 | 3.86e-05 | 109 |
| GO:00097918 | Oral cavity | OSCC | post-embryonic development | 51/7305 | 80/18723 | 6.43e-06 | 7.13e-05 | 51 |
| GO:00336274 | Oral cavity | OSCC | cell adhesion mediated by integrin | 46/7305 | 72/18723 | 1.66e-05 | 1.64e-04 | 46 |
| GO:190370618 | Oral cavity | OSCC | regulation of hemopoiesis | 180/7305 | 367/18723 | 5.16e-05 | 4.30e-04 | 180 |
| GO:00170155 | Oral cavity | OSCC | regulation of transforming growth factor beta receptor signaling pathway | 71/7305 | 128/18723 | 1.14e-04 | 8.34e-04 | 71 |
| GO:19038446 | Oral cavity | OSCC | regulation of cellular response to transforming growth factor beta stimulus | 72/7305 | 131/18723 | 1.51e-04 | 1.06e-03 | 72 |
| GO:00485693 | Oral cavity | OSCC | post-embryonic animal organ development | 13/7305 | 15/18723 | 2.07e-04 | 1.36e-03 | 13 |
| GO:000268310 | Oral cavity | OSCC | negative regulation of immune system process | 204/7305 | 434/18723 | 3.72e-04 | 2.27e-03 | 204 |
| GO:004563720 | Oral cavity | OSCC | regulation of myeloid cell differentiation | 106/7305 | 210/18723 | 4.58e-04 | 2.76e-03 | 106 |
| GO:19021059 | Oral cavity | OSCC | regulation of leukocyte differentiation | 136/7305 | 279/18723 | 5.53e-04 | 3.21e-03 | 136 |
| GO:00016558 | Oral cavity | OSCC | urogenital system development | 160/7305 | 338/18723 | 1.03e-03 | 5.31e-03 | 160 |
| Page: 1 2 3 4 5 6 7 8 9 |
| Pathway ID | Tissue | Disease Stage | Description | Gene Ratio | Bg Ratio | pvalue | p.adjust | qvalue | Count |
| hsa043506 | Oral cavity | OSCC | TGF-beta signaling pathway | 60/3704 | 108/8465 | 8.66e-03 | 1.97e-02 | 1.00e-02 | 60 |
| hsa0435013 | Oral cavity | OSCC | TGF-beta signaling pathway | 60/3704 | 108/8465 | 8.66e-03 | 1.97e-02 | 1.00e-02 | 60 |
| hsa0435022 | Oral cavity | EOLP | TGF-beta signaling pathway | 29/1218 | 108/8465 | 4.81e-04 | 1.92e-03 | 1.13e-03 | 29 |
| hsa0435032 | Oral cavity | EOLP | TGF-beta signaling pathway | 29/1218 | 108/8465 | 4.81e-04 | 1.92e-03 | 1.13e-03 | 29 |
| hsa0435041 | Oral cavity | NEOLP | TGF-beta signaling pathway | 28/1112 | 108/8465 | 2.46e-04 | 1.62e-03 | 1.02e-03 | 28 |
| hsa0435051 | Oral cavity | NEOLP | TGF-beta signaling pathway | 28/1112 | 108/8465 | 2.46e-04 | 1.62e-03 | 1.02e-03 | 28 |
| Page: 1 |
Top |
Cell-cell communication analysis |
| Identification of potential cell-cell interactions between two cell types and their ligand-receptor pairs for different disease states |
| Ligand | Receptor | LRpair | Pathway | Tissue | Disease Stage |
| Page: 1 |
Top |
Single-cell gene regulatory network inference analysis |
| Find out the significant the regulons (TFs) and the target genes of each regulon across cell types for different disease states |
| TF | Cell Type | Tissue | Disease Stage | Target Gene | RSS | Regulon Activity |
| ∗The dot plots of a searched regulon are shown for all cell subpopulations in each disease state of each tissue based on the regulon specific score inferred using pySCENIC and by calculating the average expression. |
| Page: 1 |
Top |
Somatic mutation of malignant transformation related genes |
| Annotation of somatic variants for genes involved in malignant transformation |
| Hugo Symbol | Variant Class | Variant Classification | dbSNP RS | HGVSc | HGVSp | HGVSp Short | SWISSPROT | BIOTYPE | SIFT | PolyPhen | Tumor Sample Barcode | Tissue | Histology | Sex | Age | Stage | Therapy Types | Drugs | Outcome |
| FBN1 | SNV | Missense_Mutation | c.6466G>T | p.Gly2156Cys | p.G2156C | P35555 | protein_coding | deleterious(0) | probably_damaging(1) | TCGA-A8-A08F-01 | Breast | breast invasive carcinoma | Female | <65 | III/IV | Chemotherapy | 5-fluorouracil | CR | |
| FBN1 | SNV | Missense_Mutation | c.6879T>A | p.Asn2293Lys | p.N2293K | P35555 | protein_coding | deleterious(0) | probably_damaging(0.992) | TCGA-A8-A094-01 | Breast | breast invasive carcinoma | Female | >=65 | I/II | Unknown | Unknown | SD | |
| FBN1 | SNV | Missense_Mutation | c.6019C>G | p.Gln2007Glu | p.Q2007E | P35555 | protein_coding | tolerated(0.1) | benign(0.005) | TCGA-A8-A095-01 | Breast | breast invasive carcinoma | Female | <65 | I/II | Chemotherapy | 5-fluorouracil | CR | |
| FBN1 | SNV | Missense_Mutation | c.7009G>T | p.Gly2337Trp | p.G2337W | P35555 | protein_coding | deleterious(0) | probably_damaging(0.998) | TCGA-A8-A09Z-01 | Breast | breast invasive carcinoma | Female | >=65 | I/II | Unknown | Unknown | SD | |
| FBN1 | SNV | Missense_Mutation | c.7459G>C | p.Asp2487His | p.D2487H | P35555 | protein_coding | deleterious(0) | probably_damaging(0.999) | TCGA-AC-A23H-01 | Breast | breast invasive carcinoma | Female | >=65 | I/II | Unknown | Unknown | PD | |
| FBN1 | SNV | Missense_Mutation | c.6880G>A | p.Glu2294Lys | p.E2294K | P35555 | protein_coding | deleterious(0) | probably_damaging(0.987) | TCGA-AC-A23H-01 | Breast | breast invasive carcinoma | Female | >=65 | I/II | Unknown | Unknown | PD | |
| FBN1 | SNV | Missense_Mutation | c.6359G>C | p.Gly2120Ala | p.G2120A | P35555 | protein_coding | deleterious(0) | benign(0.058) | TCGA-AC-A23H-01 | Breast | breast invasive carcinoma | Female | >=65 | I/II | Unknown | Unknown | PD | |
| FBN1 | SNV | Missense_Mutation | c.6773G>C | p.Cys2258Ser | p.C2258S | P35555 | protein_coding | deleterious(0) | probably_damaging(0.985) | TCGA-AO-A0J4-01 | Breast | breast invasive carcinoma | Female | <65 | I/II | Chemotherapy | doxorubicin | SD | |
| FBN1 | SNV | Missense_Mutation | c.4480N>A | p.Pro1494Thr | p.P1494T | P35555 | protein_coding | deleterious(0) | probably_damaging(0.992) | TCGA-AR-A0U0-01 | Breast | breast invasive carcinoma | Female | >=65 | I/II | Unknown | Unknown | SD | |
| FBN1 | SNV | Missense_Mutation | c.6010N>C | p.Tyr2004His | p.Y2004H | P35555 | protein_coding | tolerated(0.05) | probably_damaging(0.996) | TCGA-AR-A24Q-01 | Breast | breast invasive carcinoma | Female | <65 | I/II | Chemotherapy | doxorubicin | SD |
| Page: 1 2 3 4 5 6 7 8 9 10 11 12 13 14 15 16 17 18 19 20 21 22 23 24 25 26 27 28 29 30 31 32 33 34 35 36 37 38 39 |
Top |
Related drugs of malignant transformation related genes |
| Identification of chemicals and drugs interact with genes involved in malignant transfromation |
| (DGIdb 4.0) |
| Entrez ID | Symbol | Category | Interaction Types | Drug Claim Name | Drug Name | PMIDs |
| Page: 1 |

Copyright 2023-Present -The University of Texas Health Science Center at Houston |