Schematic overview of the cellular and molecular mechanisms involved in the cancer progression, including the proposed cellular and molecular mechanisms in cancer cells trajectory. AT1: alveolar type 1 cells; AT2: alveolar type 2 cells; AAH: atypical adenomatous hyperplasia; AIS: adenocarcinoma in situ; MIA: minimally invasive adenocarcinoma; IA: invasive adenocarcinoma; EMT: epithelial-mesenchymal transition

Home

Download

Statistics

Help

Contact

Center for Computational Systems Medicine
leaf

Gene summary

leaf

Malignant transformation analysis

leaf

Malignant transformation related pathway analysis

leaf

Cell-cell communication analysis

leaf

Single-cell gene regulatory network inference analysis

leaf

Somatic mutation of malignant transformation related genes

leaf

Related drugs of malignant transformation related genes

Gene: FBLN2

Gene summary for FBLN2

check button Gene summary.

Gene informationSpeciesHuman
Gene symbol

FBLN2

Gene ID

2199

Gene namefibulin 2
Gene AliasFBLN2
Cytomap3p25.1
Gene Typeprotein-coding
GO ID

GO:0007155

UniProtAcc

P98095


Top

Malignant transformation analysis

check button Identification of the aberrant gene expression in precancerous and cancerous lesions by comparing the gene expression of stem-like cells in diseased tissues with normal stem cells
check button Malignant transformation involving gene list.
Entrez IDSymbolReplicatesSpeciesOrganTissueAdj P-valueLog2FCMalignancy
2199FBLN2GSM4909281HumanBreastIDC3.22e-547.95e-010.21
2199FBLN2GSM4909295HumanBreastIDC5.02e-278.98e-010.0898
2199FBLN2LZE2THumanEsophagusESCC1.70e-074.40e-010.082
2199FBLN2P2T-EHumanEsophagusESCC1.33e-082.39e-010.1177
2199FBLN2P5T-EHumanEsophagusESCC1.11e-092.70e-010.1327
2199FBLN2P12T-EHumanEsophagusESCC2.56e-05-3.88e-030.1122
2199FBLN2P16T-EHumanEsophagusESCC5.49e-092.99e-010.1153
2199FBLN2P21T-EHumanEsophagusESCC2.65e-236.03e-010.1617
2199FBLN2P26T-EHumanEsophagusESCC8.91e-183.55e-010.1276
2199FBLN2P37T-EHumanEsophagusESCC1.30e-197.45e-010.1371
2199FBLN2P44T-EHumanEsophagusESCC1.54e-035.34e-010.1096
2199FBLN2P47T-EHumanEsophagusESCC1.33e-033.30e-010.1067
2199FBLN2P56T-EHumanEsophagusESCC1.19e-047.33e-010.1613
2199FBLN2P57T-EHumanEsophagusESCC1.29e-038.18e-020.0926
2199FBLN2P75T-EHumanEsophagusESCC1.79e-11-1.48e-010.1125
2199FBLN2P76T-EHumanEsophagusESCC2.77e-077.97e-020.1207
2199FBLN2P79T-EHumanEsophagusESCC6.79e-061.88e-020.1154
2199FBLN2P80T-EHumanEsophagusESCC1.49e-04-9.33e-020.155
2199FBLN2P107T-EHumanEsophagusESCC1.25e-09-3.67e-020.171
2199FBLN2P126T-EHumanEsophagusESCC7.29e-031.83e-010.1125
Page: 1 2 3 

check button Transcriptomic changes along malignancy continuum.
TissueExpression DynamicsAbbreviation
BreastThe image shows the transcriptomic changes along malignancy continuum.log2FC in expression of this searched gene in stem-like cells from each diseased tissue sample relative to stem-like cells in normal samples in each tissue plotted against the malignancy continuum. Samples are colored based on if they are from different disease stage.
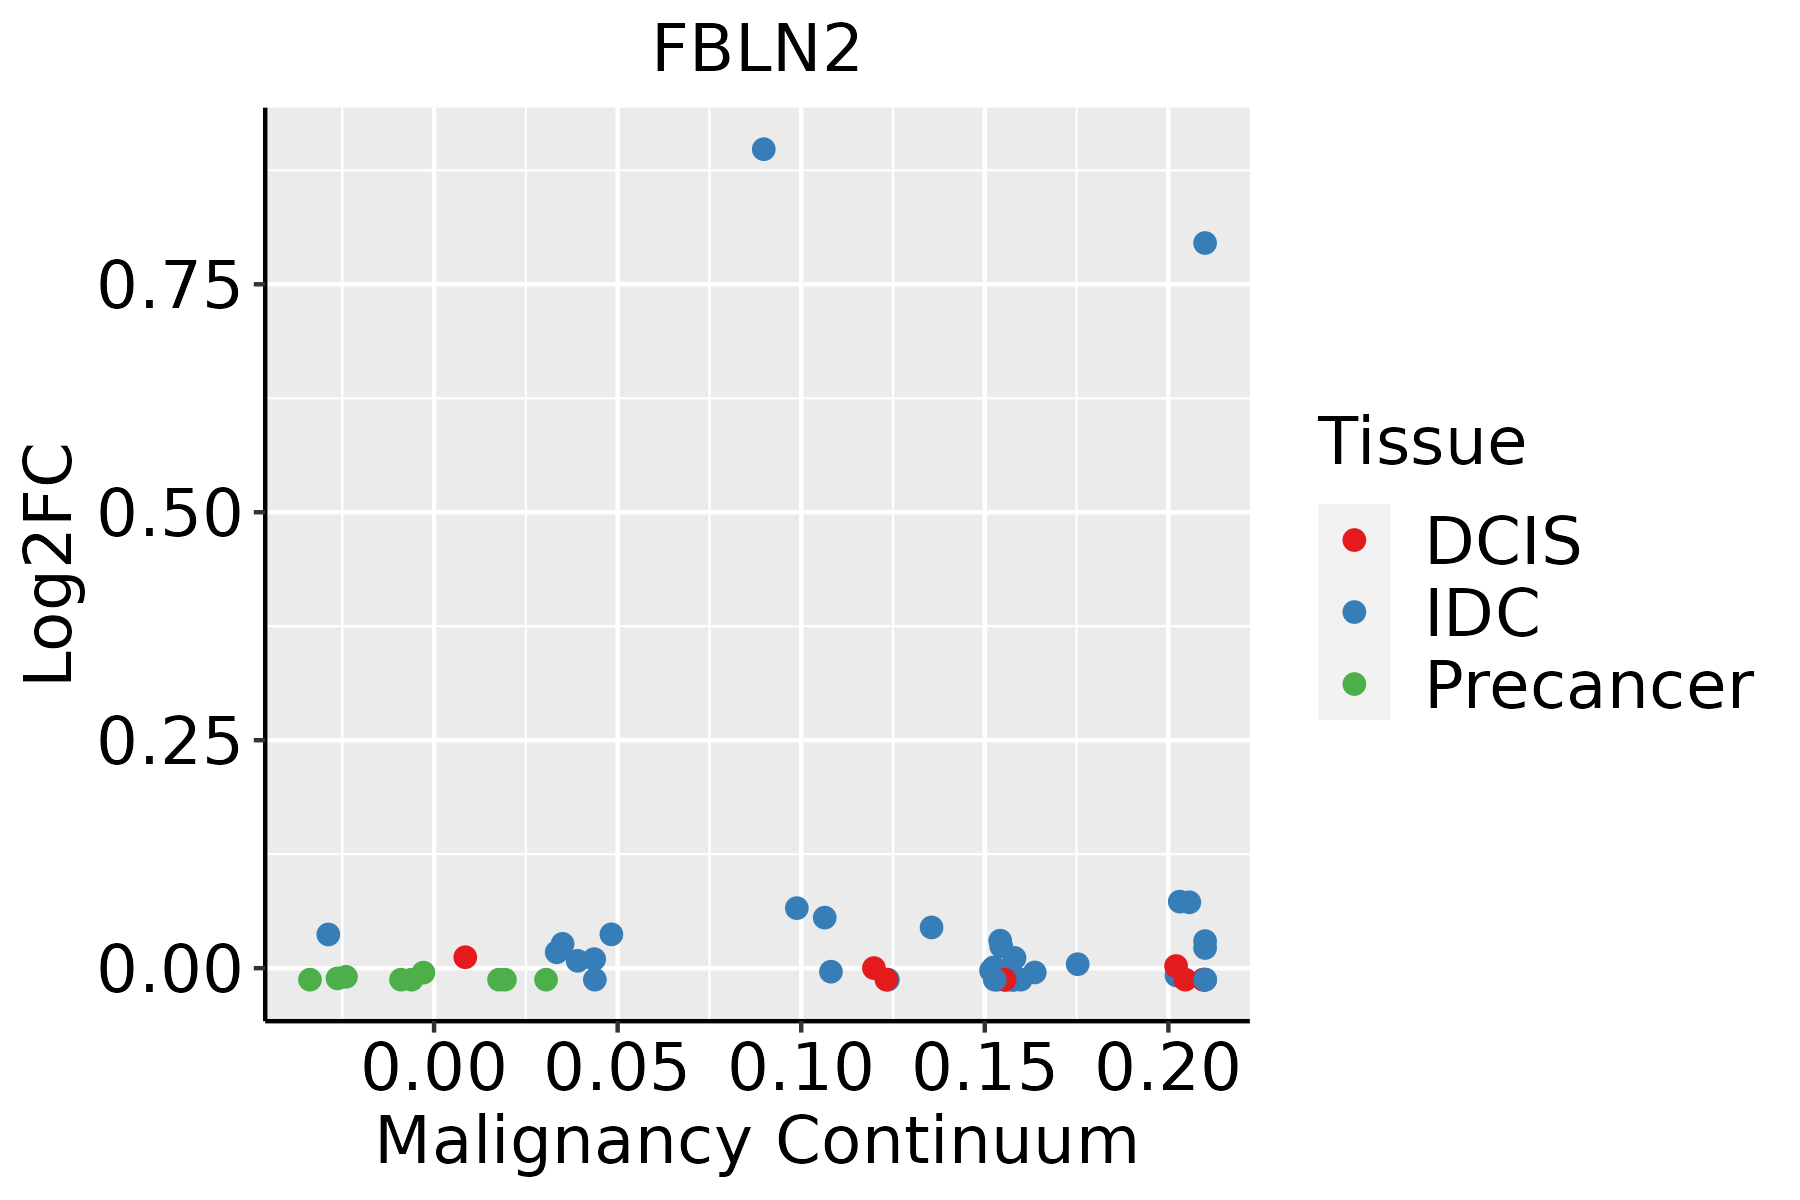
IDC: Invasive ductal carcinoma
DCIS: Ductal carcinoma in situ
Precancer(BRCA1-mut): Precancerous lesion from BRCA1 mutation carriers
EsophagusThe image shows the transcriptomic changes along malignancy continuum.log2FC in expression of this searched gene in stem-like cells from each diseased tissue sample relative to stem-like cells in normal samples in each tissue plotted against the malignancy continuum. Samples are colored based on if they are from different disease stage.
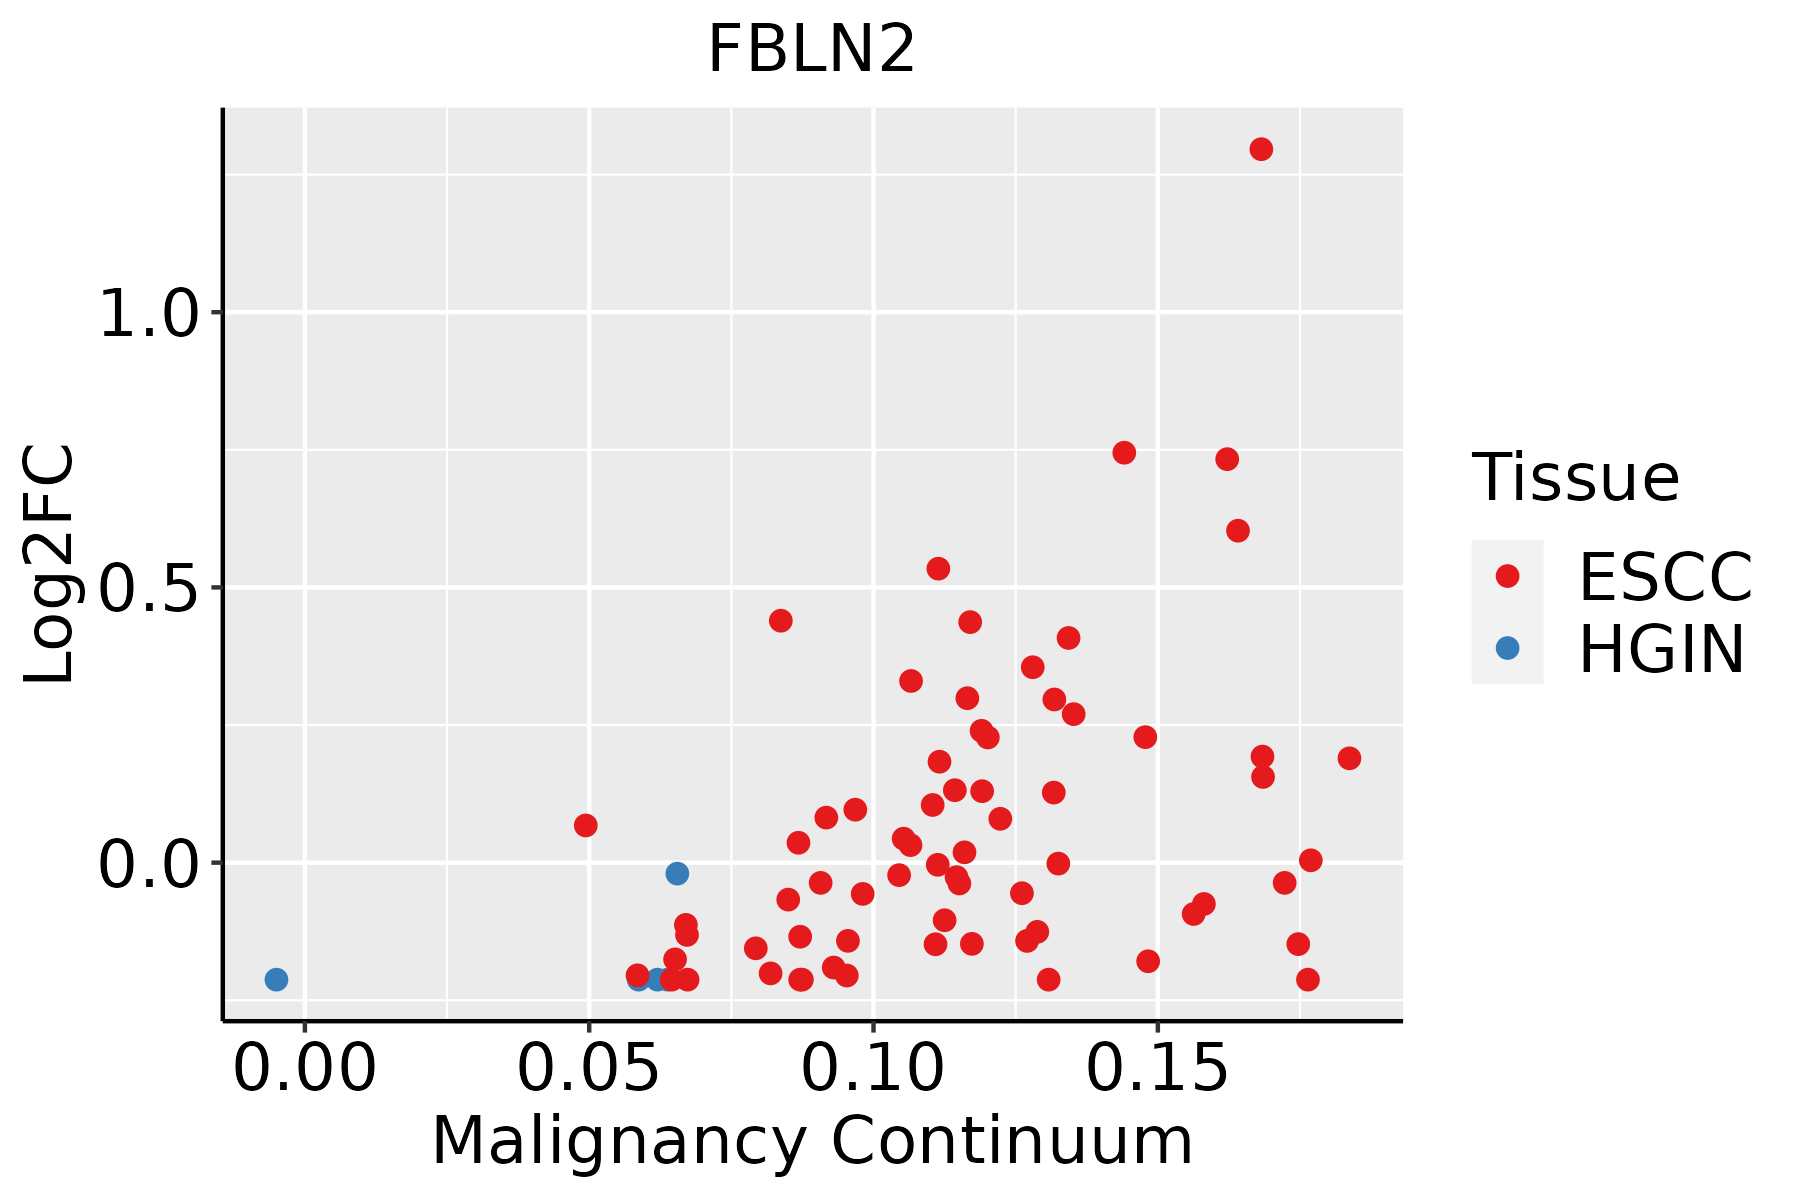
ESCC: Esophageal squamous cell carcinoma
HGIN: High-grade intraepithelial neoplasias
LGIN: Low-grade intraepithelial neoplasias
SkinThe image shows the transcriptomic changes along malignancy continuum.log2FC in expression of this searched gene in stem-like cells from each diseased tissue sample relative to stem-like cells in normal samples in each tissue plotted against the malignancy continuum. Samples are colored based on if they are from different disease stage.
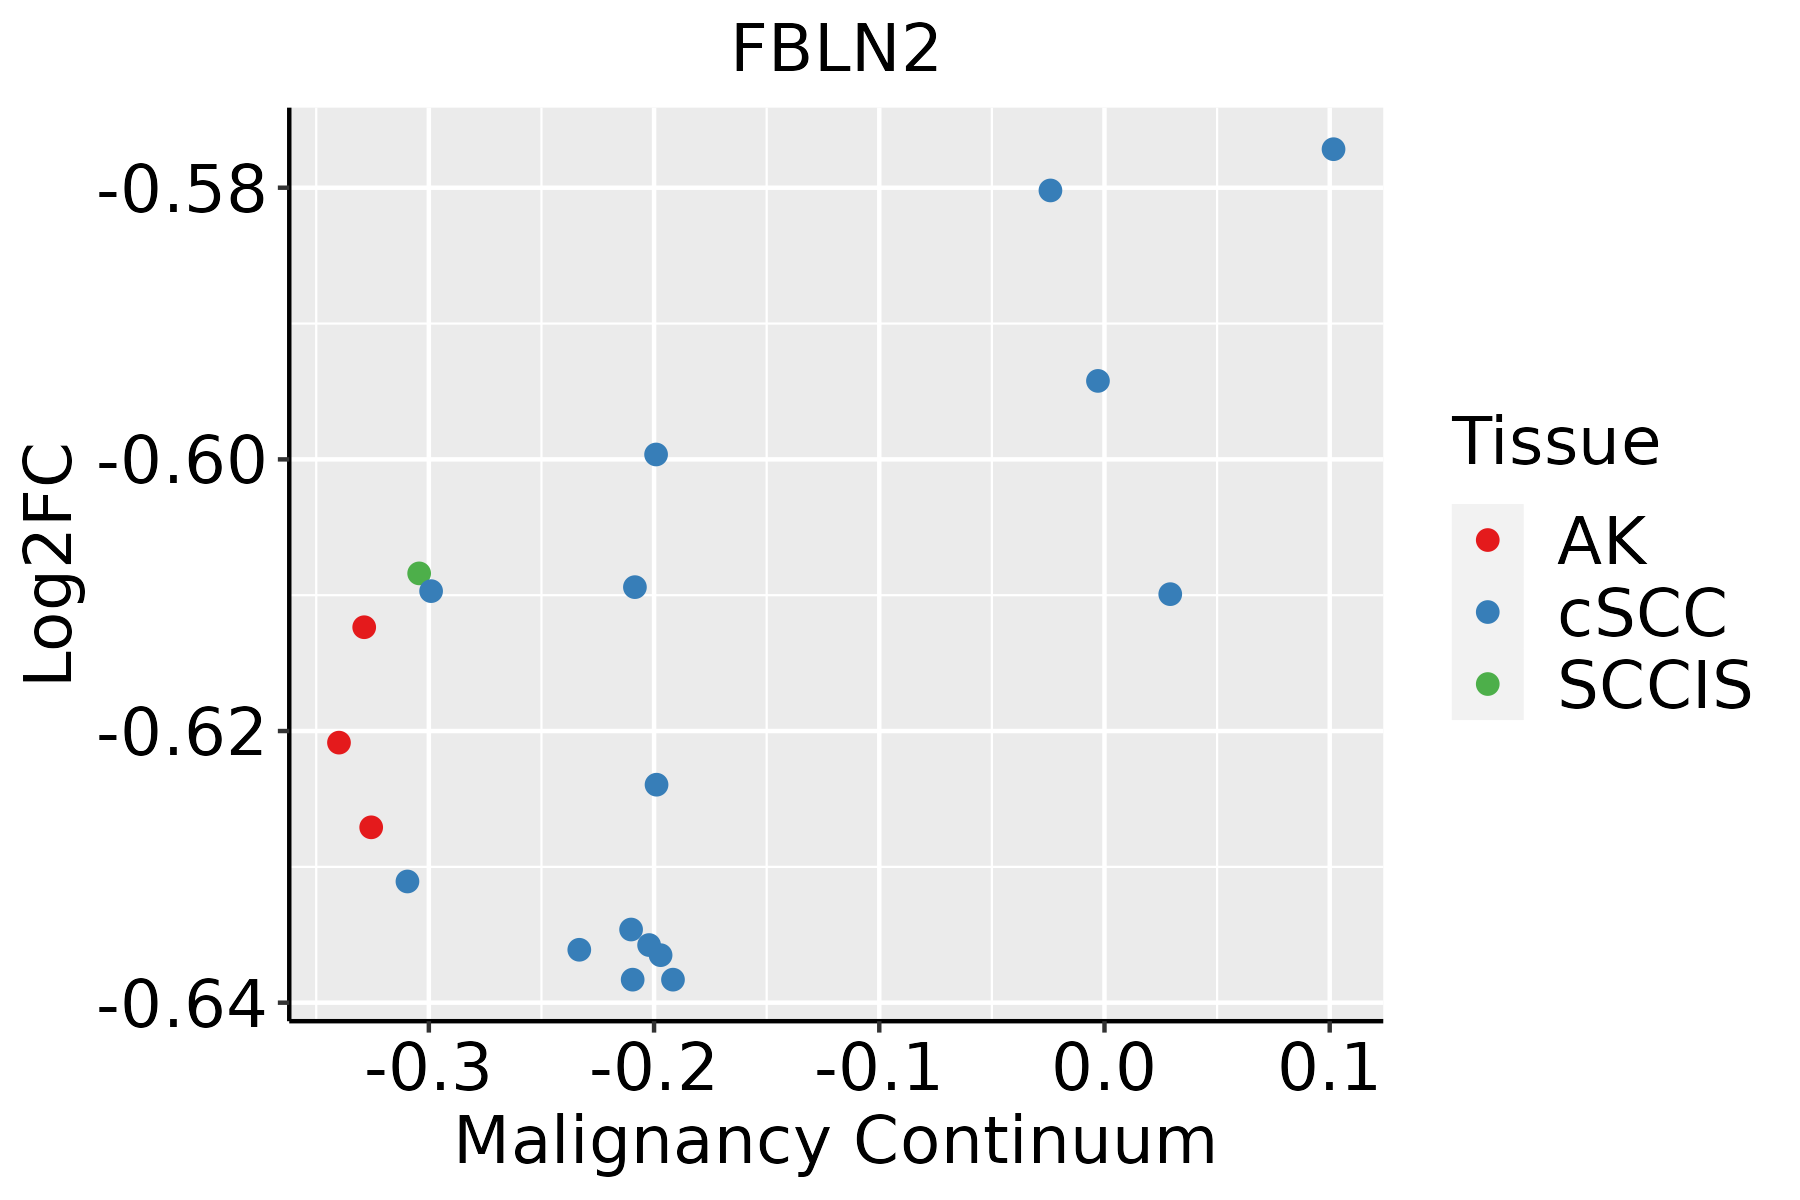
AK: Actinic keratosis
cSCC: Cutaneous squamous cell carcinoma
SCCIS:squamous cell carcinoma in situ
ThyroidThe image shows the transcriptomic changes along malignancy continuum.log2FC in expression of this searched gene in stem-like cells from each diseased tissue sample relative to stem-like cells in normal samples in each tissue plotted against the malignancy continuum. Samples are colored based on if they are from different disease stage.ATC: Anaplastic thyroid cancer
HT: Hashimoto's thyroiditis
PTC: Papillary thyroid cancer
∗log2FC in expression of this searched gene in stem-like cells from each diseased tissue sample relative to stem-like cells in normal samples in each tissue plotted against the malignancy continuum. Samples are colored based on if they are from different disease stage.

Top

Malignant transformation related pathway analysis

check buttonFind out the enriched GO biological processes and KEGG pathways involved in transition from healthy to precancer to cancer
check button Figure of enriched GO biological processes.
TissueDisease StageEnriched GO biological Processes
ColorectumADGO analysis - Figure of enriched GO biological processes: Top 15 enriched GO BP terms are showed in the bar plot of each disease state in each tissue. Each row represents a significant GO biological process which is colored according to the -log10(p.adjust).
ColorectumSERGO analysis - Figure of enriched GO biological processes: Top 15 enriched GO BP terms are showed in the bar plot of each disease state in each tissue. Each row represents a significant GO biological process which is colored according to the -log10(p.adjust).
ColorectumMSSGO analysis - Figure of enriched GO biological processes: Top 15 enriched GO BP terms are showed in the bar plot of each disease state in each tissue. Each row represents a significant GO biological process which is colored according to the -log10(p.adjust).
ColorectumMSI-HGO analysis - Figure of enriched GO biological processes: Top 15 enriched GO BP terms are showed in the bar plot of each disease state in each tissue. Each row represents a significant GO biological process which is colored according to the -log10(p.adjust).
ColorectumFAPGO analysis - Figure of enriched GO biological processes: Top 15 enriched GO BP terms are showed in the bar plot of each disease state in each tissue. Each row represents a significant GO biological process which is colored according to the -log10(p.adjust).
∗Top 15 enriched GO BP terms are showed in the bar plot of each disease state in each tissue. Each row represents a significant GO biological process which is colored according to the -log10(p.adjust).
Page: 1 2 3 4 5 6 7 8 9 

check button Enriched GO biological processes.
GO IDTissueDisease StageDescriptionGene RatioBg Ratiopvaluep.adjustCount
GO:004578514BreastIDCpositive regulation of cell adhesion62/1434437/187231.70e-067.16e-0562
GO:001081114BreastIDCpositive regulation of cell-substrate adhesion20/1434123/187231.05e-031.16e-0220
GO:00108109BreastIDCregulation of cell-substrate adhesion28/1434221/187235.88e-034.24e-0228
GO:003158919EsophagusESCCcell-substrate adhesion221/8552363/187233.06e-096.62e-08221
GO:001081020EsophagusESCCregulation of cell-substrate adhesion144/8552221/187233.55e-097.45e-08144
GO:004578527EsophagusESCCpositive regulation of cell adhesion255/8552437/187235.07e-089.11e-07255
GO:001081126EsophagusESCCpositive regulation of cell-substrate adhesion84/8552123/187233.18e-074.50e-0684
GO:00301984EsophagusESCCextracellular matrix organization171/8552301/187236.08e-054.67e-04171
GO:00430624EsophagusESCCextracellular structure organization171/8552302/187237.73e-055.76e-04171
GO:00452294EsophagusESCCexternal encapsulating structure organization172/8552304/187237.80e-055.80e-04172
GO:001081026SkinAKregulation of cell-substrate adhesion53/1910221/187232.22e-092.02e-0753
GO:004578528SkinAKpositive regulation of cell adhesion85/1910437/187233.40e-092.79e-0785
GO:003158920SkinAKcell-substrate adhesion74/1910363/187234.40e-093.30e-0774
GO:001081127SkinAKpositive regulation of cell-substrate adhesion29/1910123/187231.29e-052.58e-0429
GO:0045785111SkinSCCISpositive regulation of cell adhesion57/919437/187231.49e-111.58e-0857
GO:0031589110SkinSCCIScell-substrate adhesion44/919363/187233.03e-087.00e-0644
GO:0010810111SkinSCCISregulation of cell-substrate adhesion30/919221/187234.35e-073.67e-0530
GO:00301985SkinSCCISextracellular matrix organization32/919301/187233.46e-059.17e-0432
GO:00430625SkinSCCISextracellular structure organization32/919302/187233.69e-059.65e-0432
GO:00452295SkinSCCISexternal encapsulating structure organization32/919304/187234.20e-051.06e-0332
Page: 1 2 

check button Enriched KEGG pathways.
Pathway IDTissueDisease StageDescriptionGene RatioBg Ratiopvaluep.adjustqvalueCount
Page: 1 

Top

Cell-cell communication analysis

check buttonIdentification of potential cell-cell interactions between two cell types and their ligand-receptor pairs for different disease states
LigandReceptorLRpairPathwayTissueDisease Stage
Page: 1 

Top

Single-cell gene regulatory network inference analysis

check buttonFind out the significant the regulons (TFs) and the target genes of each regulon across cell types for different disease states
TFCell TypeTissueDisease StageTarget GeneRSSRegulon Activity
∗The dot plots of a searched regulon are shown for all cell subpopulations in each disease state of each tissue based on the regulon specific score inferred using pySCENIC and by calculating the average expression.
Page: 1 

Top

Somatic mutation of malignant transformation related genes

check buttonAnnotation of somatic variants for genes involved in malignant transformation
Hugo SymbolVariant ClassVariant ClassificationdbSNP RSHGVScHGVSpHGVSp ShortSWISSPROTBIOTYPESIFTPolyPhenTumor Sample BarcodeTissueHistologySexAgeStageTherapy TypesDrugsOutcome
FBLN2SNVMissense_Mutationc.1675N>Gp.Leu559Valp.L559VP98095protein_codingtolerated(0.11)possibly_damaging(0.84)TCGA-A8-A06Q-01Breastbreast invasive carcinomaFemale<65III/IVUnknownUnknownSD
FBLN2SNVMissense_Mutationnovelc.538N>Gp.Asn180Aspp.N180DP98095protein_codingdeleterious(0.03)possibly_damaging(0.84)TCGA-AN-A046-01Breastbreast invasive carcinomaFemale>=65I/IIUnknownUnknownSD
FBLN2SNVMissense_Mutationc.1084N>Ap.Leu362Metp.L362MP98095protein_codingtolerated(0.24)benign(0.332)TCGA-AO-A128-01Breastbreast invasive carcinomaFemale<65I/IIChemotherapydoxorubicinSD
FBLN2SNVMissense_Mutationnovelc.3630N>Cp.Trp1210Cysp.W1210CP98095protein_codingdeleterious(0)probably_damaging(0.997)TCGA-AQ-A54N-01Breastbreast invasive carcinomaFemale<65I/IIUnknownUnknownSD
FBLN2SNVMissense_Mutationrs751893647c.3185N>Tp.Thr1062Ilep.T1062IP98095protein_codingdeleterious(0)possibly_damaging(0.798)TCGA-AR-A0TY-01Breastbreast invasive carcinomaFemale<65I/IIUnspecificPaclitaxelPD
FBLN2SNVMissense_Mutationc.2564G>Cp.Cys855Serp.C855SP98095protein_codingdeleterious(0)benign(0.065)TCGA-AR-A24Q-01Breastbreast invasive carcinomaFemale<65I/IIChemotherapydoxorubicinSD
FBLN2SNVMissense_Mutationc.2872N>Tp.Arg958Cysp.R958CP98095protein_codingdeleterious(0)probably_damaging(0.999)TCGA-BH-A18M-01Breastbreast invasive carcinomaFemale<65III/IVUnknownUnknownSD
FBLN2SNVMissense_Mutationc.3343N>Ap.Cys1115Serp.C1115SP98095protein_codingdeleterious(0)probably_damaging(0.998)TCGA-D8-A1XK-01Breastbreast invasive carcinomaFemale<65I/IIChemotherapydoxorubicine+cyclophosphamideSD
FBLN2insertionFrame_Shift_Insnovelc.2135_2136insTp.Asp713GlyfsTer6p.D713Gfs*6P98095protein_codingTCGA-AO-A03T-01Breastbreast invasive carcinomaFemale<65I/IIChemotherapycyclophosphamideSD
FBLN2insertionFrame_Shift_Insnovelc.2136_2137insGTGCTGGGTATGTGCAAp.Asp713ValfsTer18p.D713Vfs*18P98095protein_codingTCGA-AO-A03T-01Breastbreast invasive carcinomaFemale<65I/IIChemotherapycyclophosphamideSD
Page: 1 2 3 4 5 6 7 8 9 10 11 12 13 

Top

Related drugs of malignant transformation related genes

check buttonIdentification of chemicals and drugs interact with genes involved in malignant transfromation
(DGIdb 4.0)
Entrez IDSymbolCategoryInteraction TypesDrug Claim NameDrug NamePMIDs
Page: 1