
|
|||||
|
 | |
| |
| |
| |
| |
| |
|
Gene: FBL |
Gene summary for FBL |
| Gene information | Species | Human | Gene symbol | FBL | Gene ID | 2091 |
| Gene name | fibrillarin | |
| Gene Alias | FIB | |
| Cytomap | 19q13.2 | |
| Gene Type | protein-coding | GO ID | GO:0000154 | UniProtAcc | P22087 |
Top |
Malignant transformation analysis |
| Identification of the aberrant gene expression in precancerous and cancerous lesions by comparing the gene expression of stem-like cells in diseased tissues with normal stem cells |
| Entrez ID | Symbol | Replicates | Species | Organ | Tissue | Adj P-value | Log2FC | Malignancy |
| 2091 | FBL | GSM4909285 | Human | Breast | IDC | 1.42e-28 | 6.19e-01 | 0.21 |
| 2091 | FBL | GSM4909286 | Human | Breast | IDC | 3.90e-29 | 5.57e-01 | 0.1081 |
| 2091 | FBL | GSM4909294 | Human | Breast | IDC | 5.93e-04 | -2.37e-01 | 0.2022 |
| 2091 | FBL | GSM4909296 | Human | Breast | IDC | 5.16e-08 | -1.82e-02 | 0.1524 |
| 2091 | FBL | GSM4909297 | Human | Breast | IDC | 1.90e-13 | -3.35e-01 | 0.1517 |
| 2091 | FBL | GSM4909311 | Human | Breast | IDC | 2.45e-34 | -2.29e-01 | 0.1534 |
| 2091 | FBL | GSM4909312 | Human | Breast | IDC | 4.97e-10 | -1.24e-02 | 0.1552 |
| 2091 | FBL | GSM4909319 | Human | Breast | IDC | 5.59e-33 | -3.80e-01 | 0.1563 |
| 2091 | FBL | GSM4909320 | Human | Breast | IDC | 2.12e-04 | -2.10e-01 | 0.1575 |
| 2091 | FBL | GSM4909321 | Human | Breast | IDC | 5.24e-12 | -1.69e-01 | 0.1559 |
| 2091 | FBL | brca3 | Human | Breast | Precancer | 2.80e-02 | 5.33e-02 | -0.0263 |
| 2091 | FBL | NCCBC14 | Human | Breast | DCIS | 3.24e-11 | -3.32e-01 | 0.2021 |
| 2091 | FBL | NCCBC3 | Human | Breast | DCIS | 2.67e-02 | -9.59e-02 | 0.1198 |
| 2091 | FBL | NCCBC5 | Human | Breast | DCIS | 4.86e-10 | -2.11e-01 | 0.2046 |
| 2091 | FBL | P1 | Human | Breast | IDC | 9.52e-20 | -4.29e-01 | 0.1527 |
| 2091 | FBL | DCIS2 | Human | Breast | DCIS | 5.31e-50 | 9.70e-05 | 0.0085 |
| 2091 | FBL | HTA11_3410_2000001011 | Human | Colorectum | AD | 1.57e-56 | 9.71e-01 | 0.0155 |
| 2091 | FBL | HTA11_2487_2000001011 | Human | Colorectum | SER | 1.73e-21 | 7.91e-01 | -0.1808 |
| 2091 | FBL | HTA11_2951_2000001011 | Human | Colorectum | AD | 6.92e-17 | 1.15e+00 | 0.0216 |
| 2091 | FBL | HTA11_1938_2000001011 | Human | Colorectum | AD | 7.77e-30 | 8.98e-01 | -0.0811 |
| Page: 1 2 3 4 5 6 7 8 9 10 11 12 |
| Tissue | Expression Dynamics | Abbreviation |
| Breast |  | IDC: Invasive ductal carcinoma |
| DCIS: Ductal carcinoma in situ | ||
| Precancer(BRCA1-mut): Precancerous lesion from BRCA1 mutation carriers | ||
| Colorectum (GSE201348) | 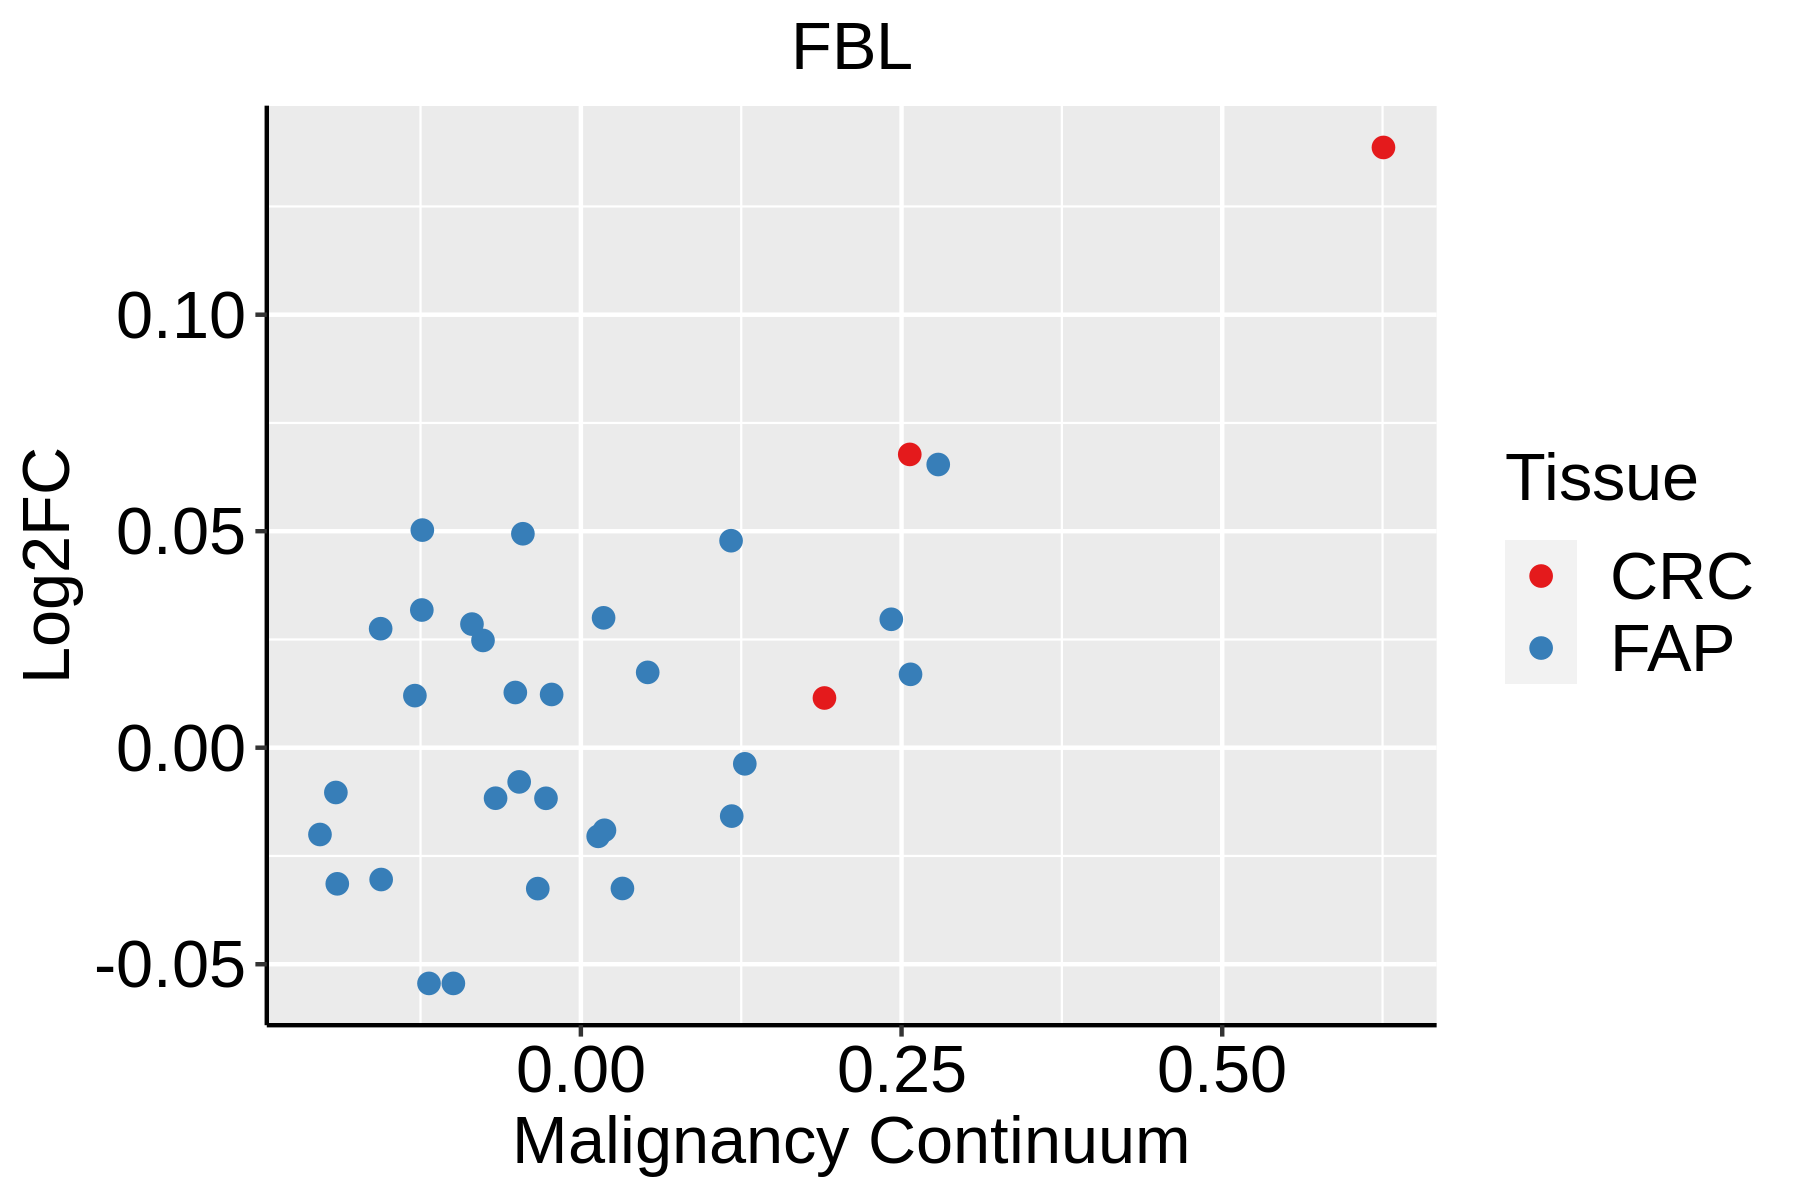 | FAP: Familial adenomatous polyposis |
| CRC: Colorectal cancer | ||
| Colorectum (HTA11) |  | AD: Adenomas |
| SER: Sessile serrated lesions | ||
| MSI-H: Microsatellite-high colorectal cancer | ||
| MSS: Microsatellite stable colorectal cancer | ||
| Endometrium | 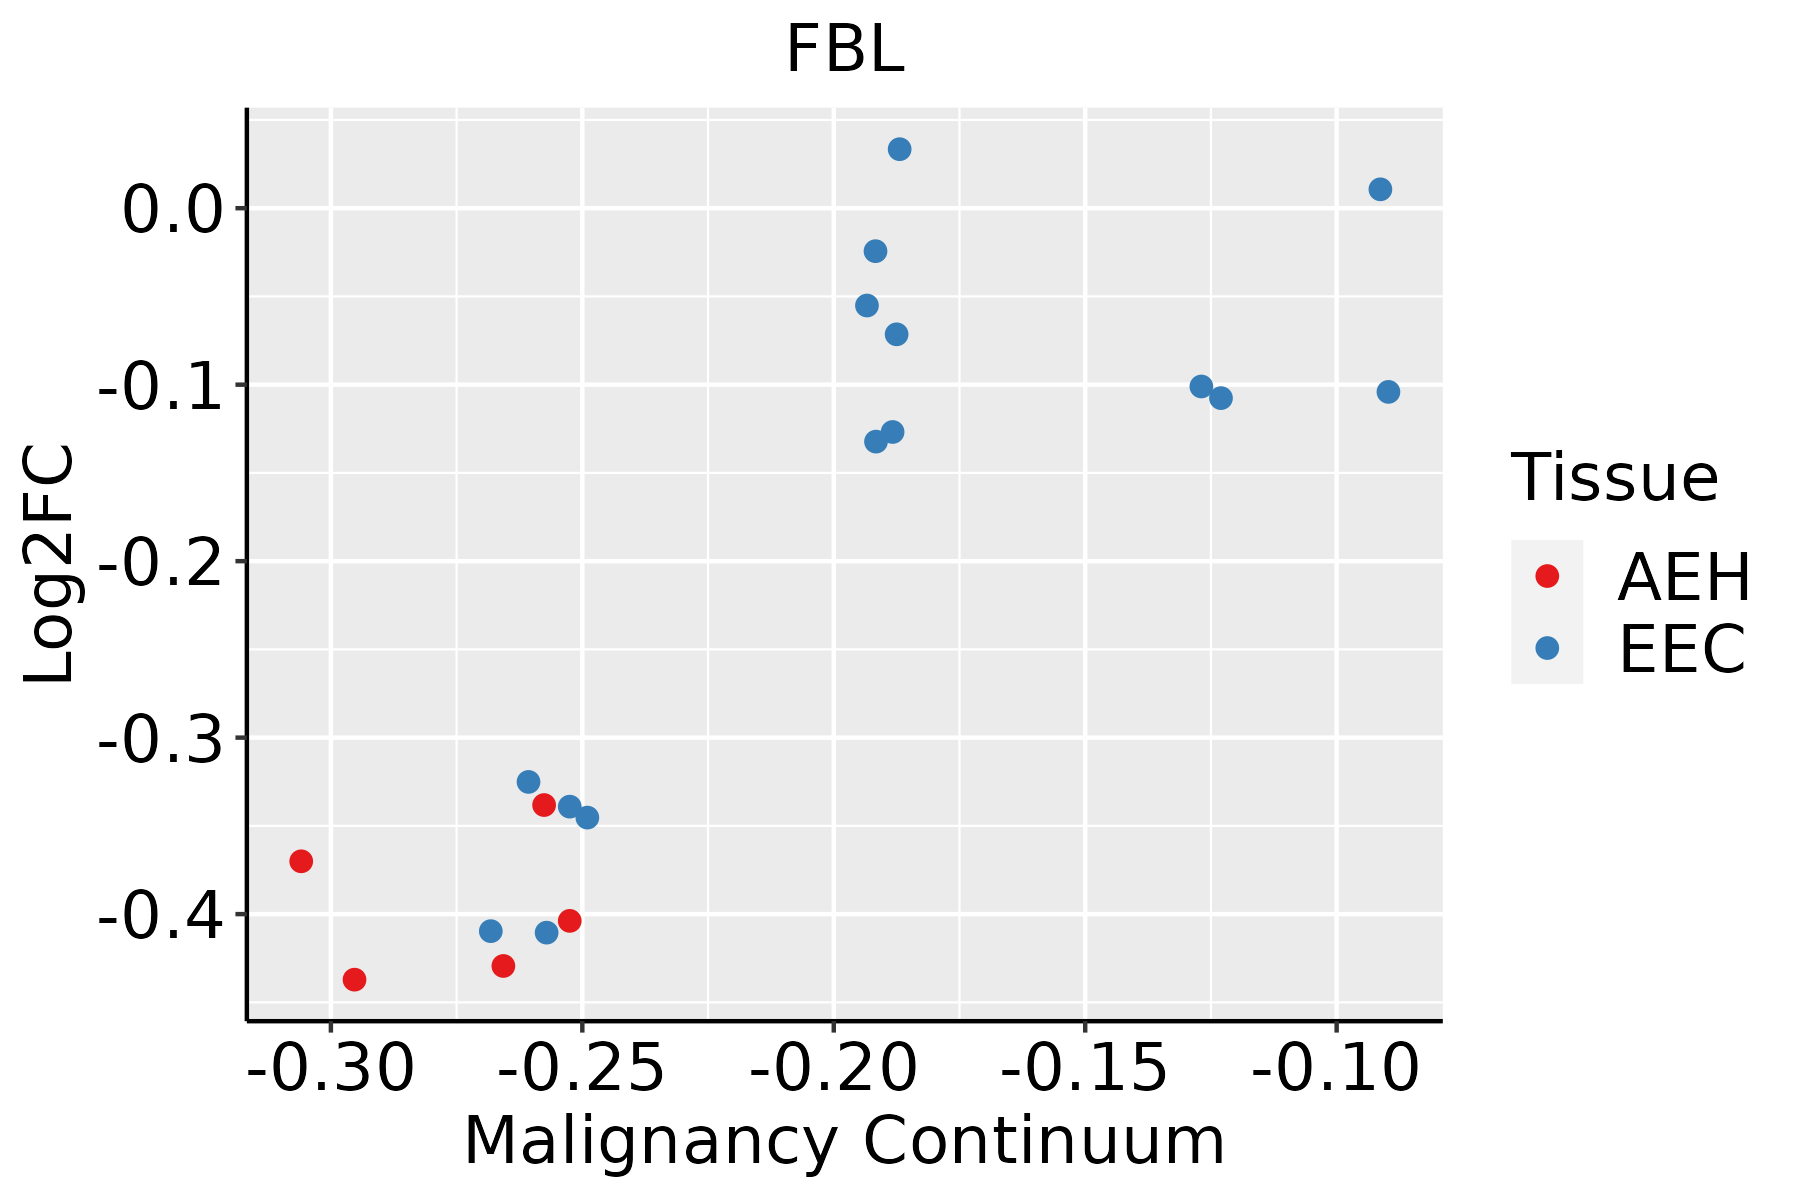 | AEH: Atypical endometrial hyperplasia |
| EEC: Endometrioid Cancer | ||
| Esophagus | 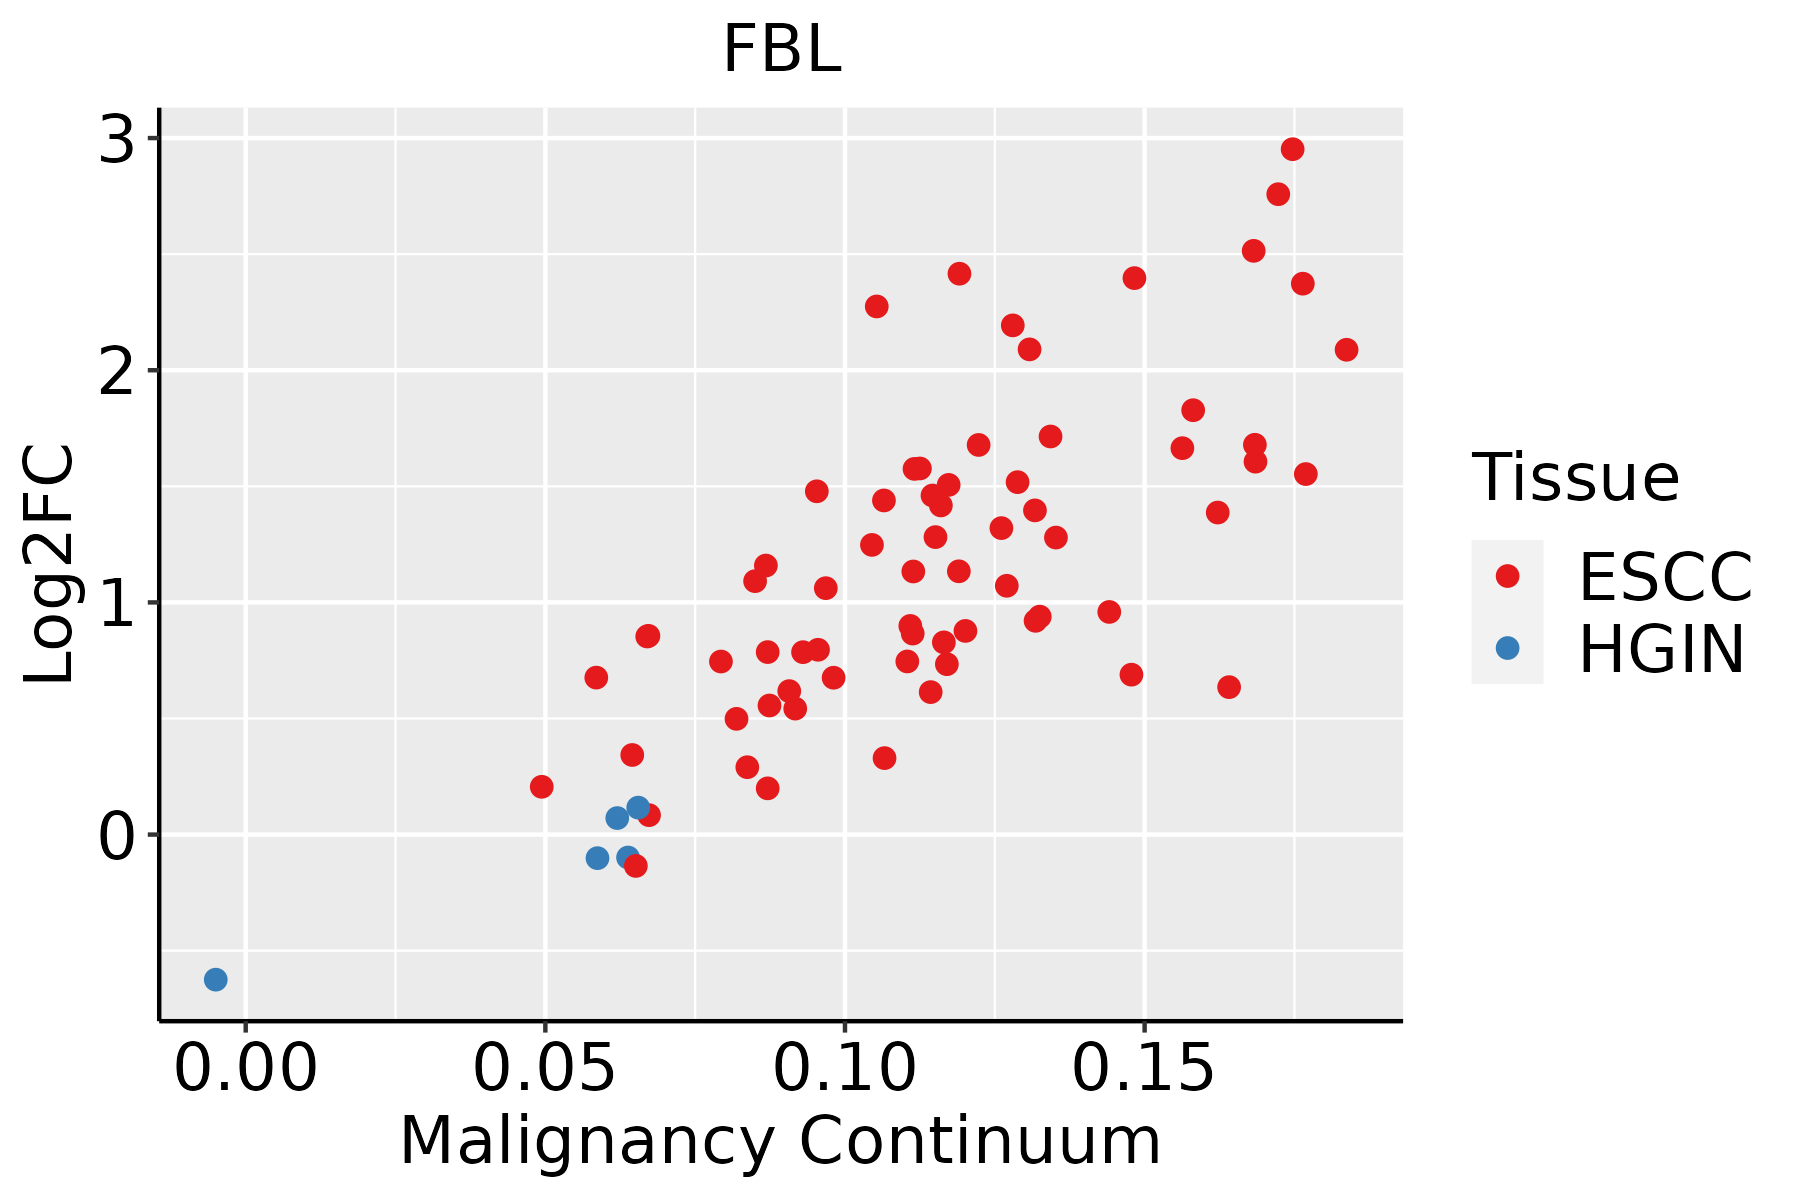 | ESCC: Esophageal squamous cell carcinoma |
| HGIN: High-grade intraepithelial neoplasias | ||
| LGIN: Low-grade intraepithelial neoplasias | ||
| Liver | 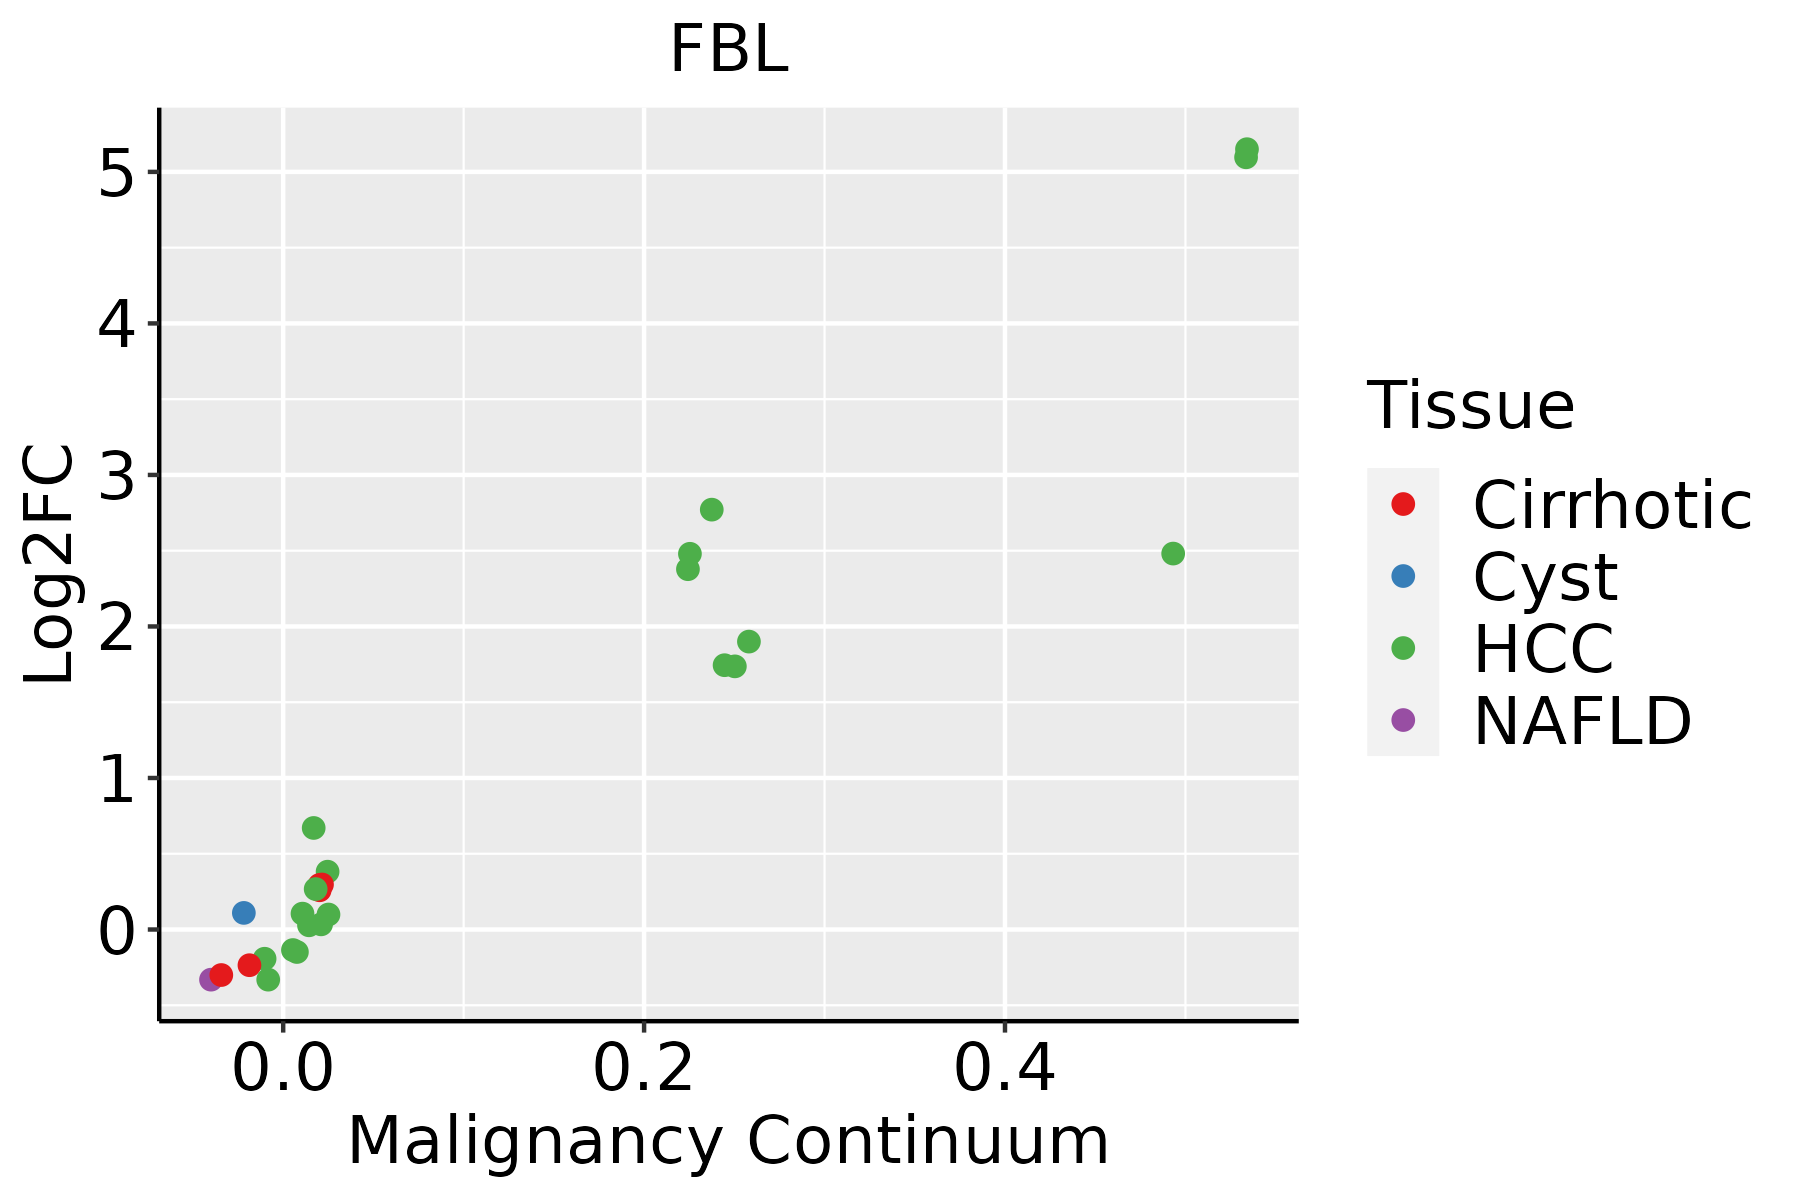 | HCC: Hepatocellular carcinoma |
| NAFLD: Non-alcoholic fatty liver disease | ||
| Oral Cavity | 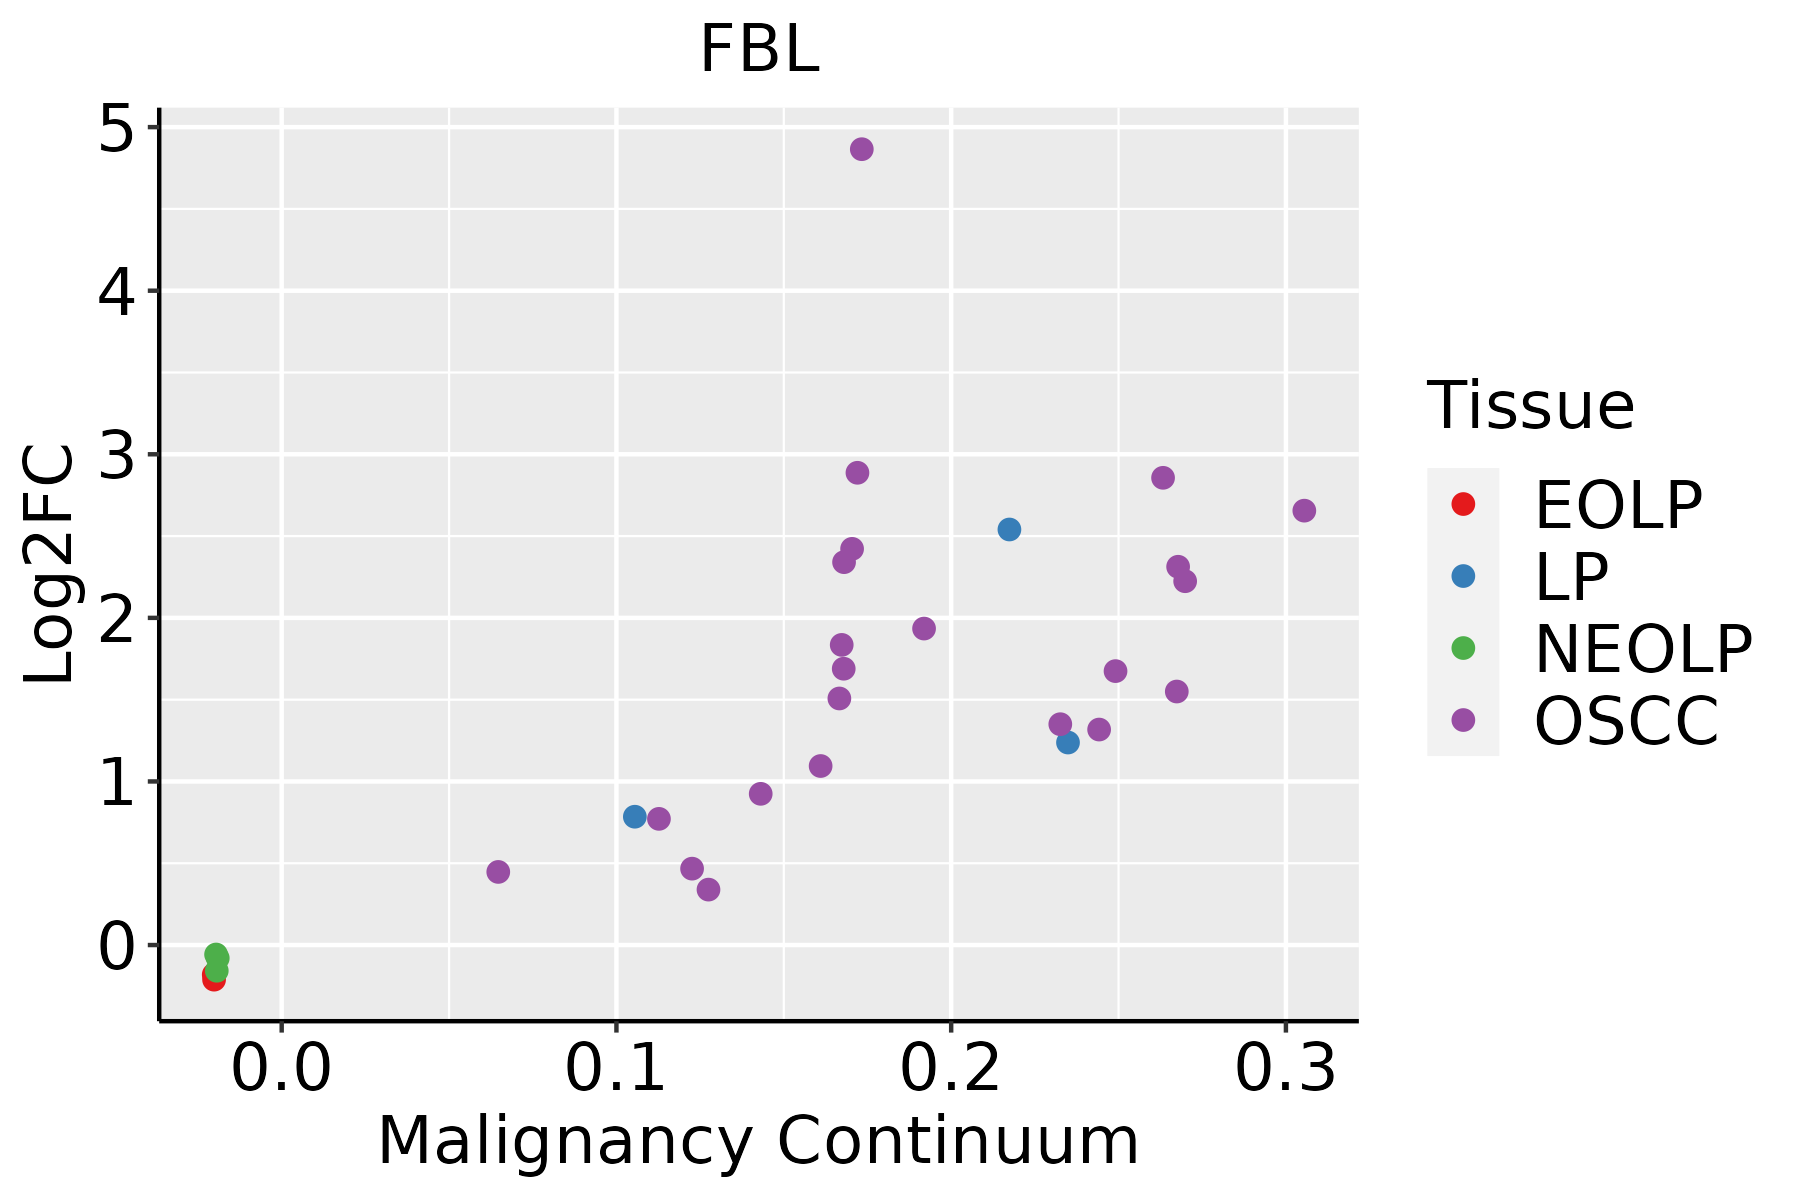 | EOLP: Erosive Oral lichen planus |
| LP: leukoplakia | ||
| NEOLP: Non-erosive oral lichen planus | ||
| OSCC: Oral squamous cell carcinoma | ||
| Prostate | 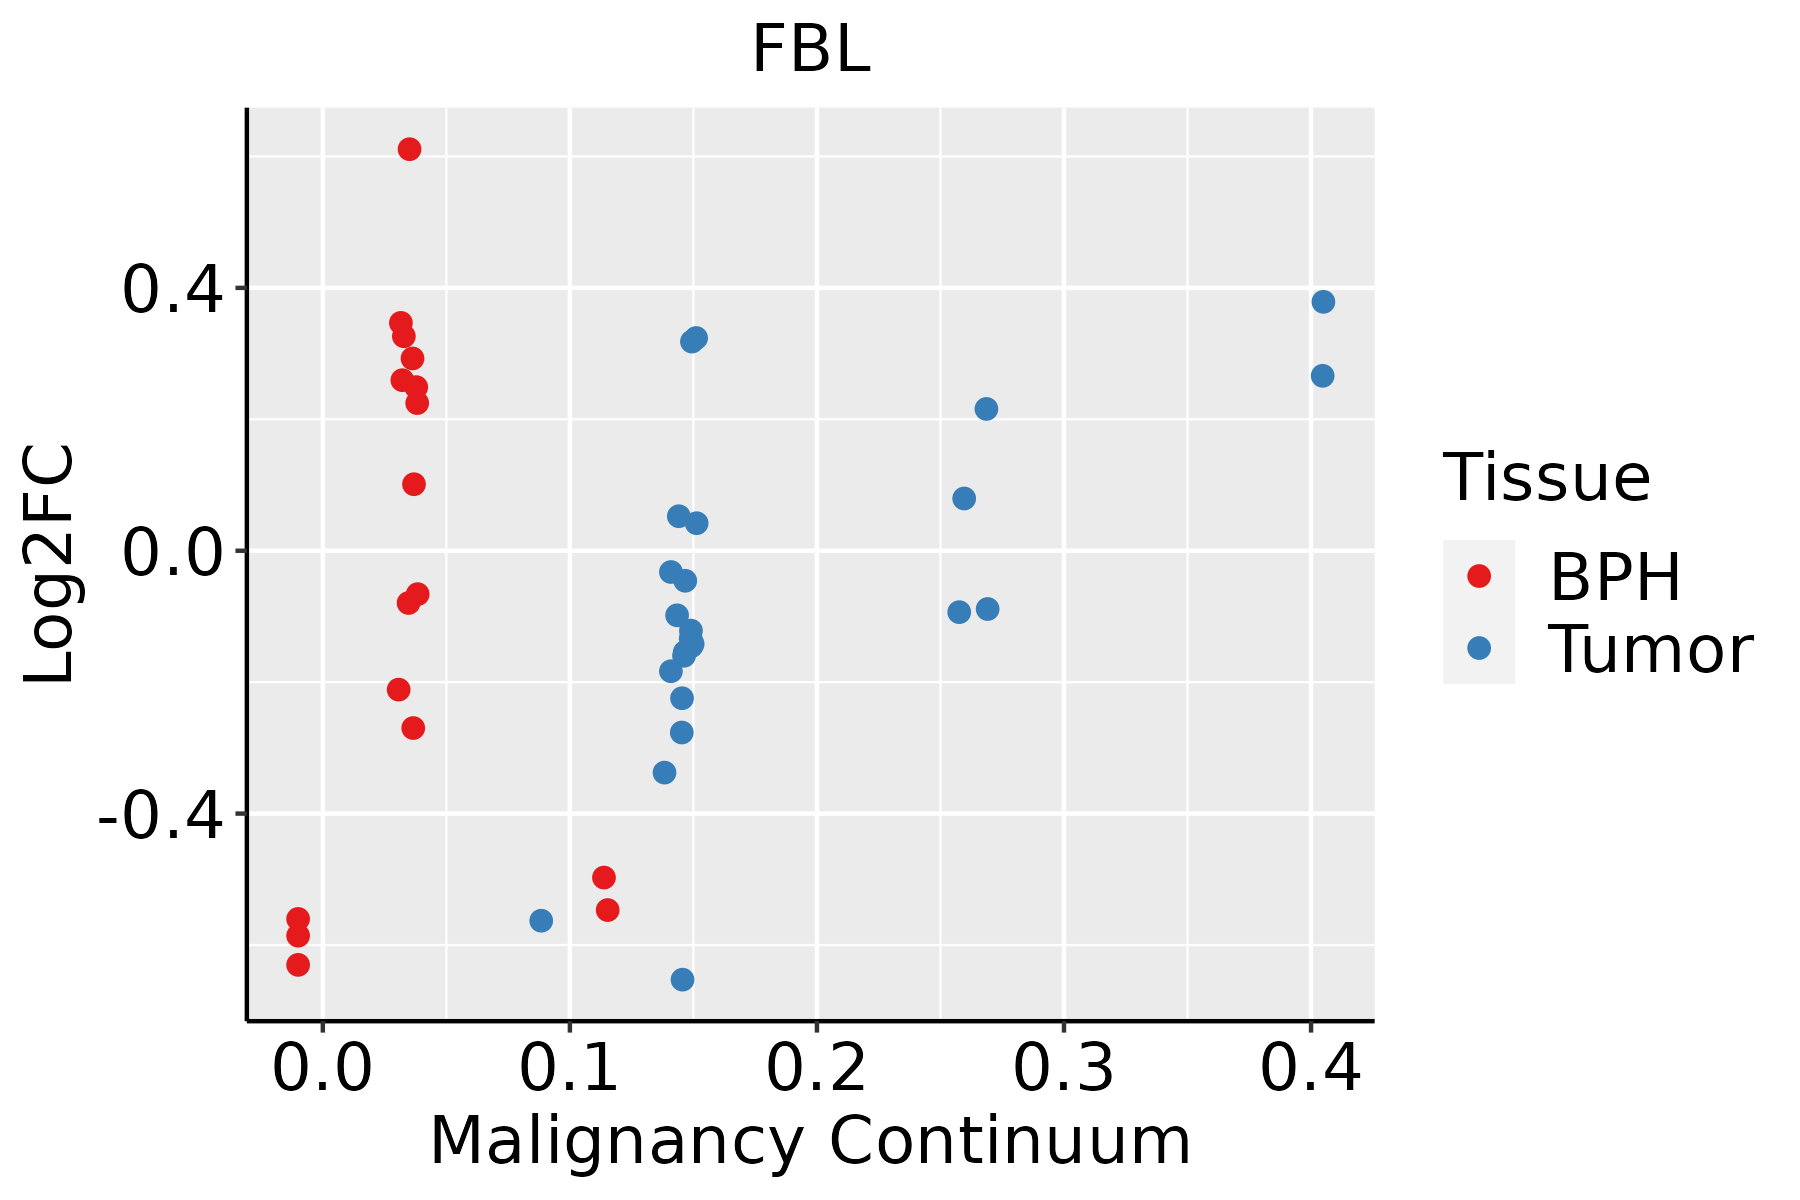 | BPH: Benign Prostatic Hyperplasia |
| Skin | 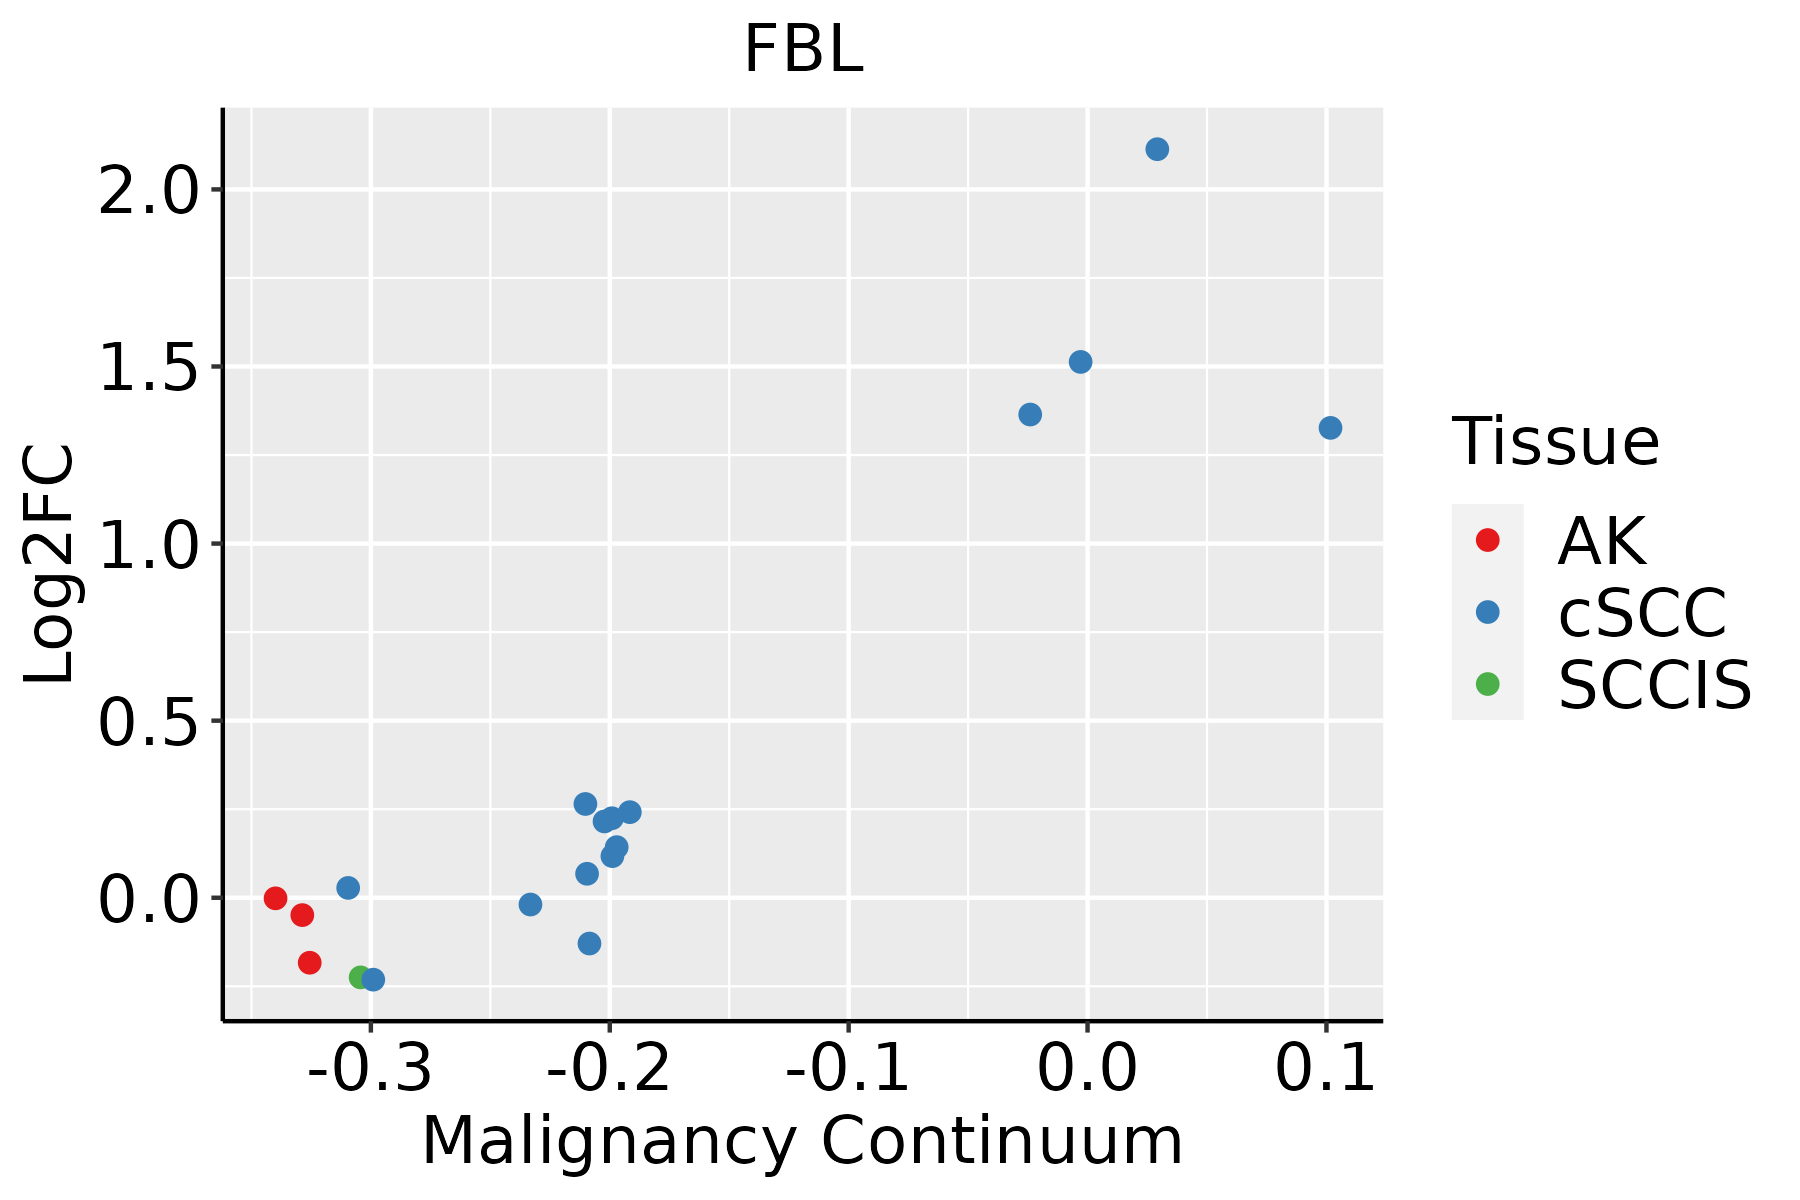 | AK: Actinic keratosis |
| cSCC: Cutaneous squamous cell carcinoma | ||
| SCCIS:squamous cell carcinoma in situ | ||
| Thyroid |  | ATC: Anaplastic thyroid cancer |
| HT: Hashimoto's thyroiditis | ||
| PTC: Papillary thyroid cancer |
| ∗log2FC in expression of this searched gene in stem-like cells from each diseased tissue sample relative to stem-like cells in normal samples in each tissue plotted against the malignancy continuum. Samples are colored based on if they are from different disease stage. |
Top |
Malignant transformation related pathway analysis |
| Find out the enriched GO biological processes and KEGG pathways involved in transition from healthy to precancer to cancer |
| Tissue | Disease Stage | Enriched GO biological Processes |
| Colorectum | AD |  |
| Colorectum | SER |  |
| Colorectum | MSS |  |
| Colorectum | MSI-H |  |
| Colorectum | FAP |  |
| ∗Top 15 enriched GO BP terms are showed in the bar plot of each disease state in each tissue. Each row represents a significant GO biological process which is colored according to the -log10(p.adjust). |
| Page: 1 2 3 4 5 6 7 8 9 |
| GO ID | Tissue | Disease Stage | Description | Gene Ratio | Bg Ratio | pvalue | p.adjust | Count |
| GO:00226139 | Breast | Precancer | ribonucleoprotein complex biogenesis | 79/1080 | 463/18723 | 2.11e-18 | 1.03e-15 | 79 |
| GO:00422549 | Breast | Precancer | ribosome biogenesis | 52/1080 | 299/18723 | 7.35e-13 | 1.51e-10 | 52 |
| GO:00063646 | Breast | Precancer | rRNA processing | 35/1080 | 225/18723 | 7.90e-08 | 4.60e-06 | 35 |
| GO:00160726 | Breast | Precancer | rRNA metabolic process | 36/1080 | 236/18723 | 8.59e-08 | 4.84e-06 | 36 |
| GO:00344705 | Breast | Precancer | ncRNA processing | 42/1080 | 395/18723 | 9.91e-05 | 1.83e-03 | 42 |
| GO:00016496 | Breast | Precancer | osteoblast differentiation | 27/1080 | 229/18723 | 3.35e-04 | 4.73e-03 | 27 |
| GO:00346604 | Breast | Precancer | ncRNA metabolic process | 45/1080 | 485/18723 | 1.15e-03 | 1.26e-02 | 45 |
| GO:00064039 | Breast | Precancer | RNA localization | 23/1080 | 201/18723 | 1.34e-03 | 1.41e-02 | 23 |
| GO:00015036 | Breast | Precancer | ossification | 36/1080 | 408/18723 | 7.53e-03 | 4.98e-02 | 36 |
| GO:002261314 | Breast | IDC | ribonucleoprotein complex biogenesis | 83/1434 | 463/18723 | 2.01e-13 | 5.20e-11 | 83 |
| GO:004225414 | Breast | IDC | ribosome biogenesis | 52/1434 | 299/18723 | 1.90e-08 | 1.32e-06 | 52 |
| GO:004578514 | Breast | IDC | positive regulation of cell adhesion | 62/1434 | 437/18723 | 1.70e-06 | 7.16e-05 | 62 |
| GO:000636414 | Breast | IDC | rRNA processing | 35/1434 | 225/18723 | 4.59e-05 | 1.03e-03 | 35 |
| GO:001607214 | Breast | IDC | rRNA metabolic process | 36/1434 | 236/18723 | 5.48e-05 | 1.17e-03 | 36 |
| GO:000164912 | Breast | IDC | osteoblast differentiation | 35/1434 | 229/18723 | 6.64e-05 | 1.35e-03 | 35 |
| GO:000150311 | Breast | IDC | ossification | 50/1434 | 408/18723 | 6.51e-04 | 8.04e-03 | 50 |
| GO:001081114 | Breast | IDC | positive regulation of cell-substrate adhesion | 20/1434 | 123/18723 | 1.05e-03 | 1.16e-02 | 20 |
| GO:000640313 | Breast | IDC | RNA localization | 27/1434 | 201/18723 | 3.04e-03 | 2.60e-02 | 27 |
| GO:00108109 | Breast | IDC | regulation of cell-substrate adhesion | 28/1434 | 221/18723 | 5.88e-03 | 4.24e-02 | 28 |
| GO:002261324 | Breast | DCIS | ribonucleoprotein complex biogenesis | 83/1390 | 463/18723 | 3.65e-14 | 1.09e-11 | 83 |
| Page: 1 2 3 4 5 6 7 8 9 10 11 12 13 14 15 16 17 18 19 20 21 22 23 24 25 26 27 28 29 30 31 32 33 34 35 36 37 38 39 40 |
| Pathway ID | Tissue | Disease Stage | Description | Gene Ratio | Bg Ratio | pvalue | p.adjust | qvalue | Count |
| Page: 1 |
Top |
Cell-cell communication analysis |
| Identification of potential cell-cell interactions between two cell types and their ligand-receptor pairs for different disease states |
| Ligand | Receptor | LRpair | Pathway | Tissue | Disease Stage |
| Page: 1 |
Top |
Single-cell gene regulatory network inference analysis |
| Find out the significant the regulons (TFs) and the target genes of each regulon across cell types for different disease states |
| TF | Cell Type | Tissue | Disease Stage | Target Gene | RSS | Regulon Activity |
| ∗The dot plots of a searched regulon are shown for all cell subpopulations in each disease state of each tissue based on the regulon specific score inferred using pySCENIC and by calculating the average expression. |
| Page: 1 |
Top |
Somatic mutation of malignant transformation related genes |
| Annotation of somatic variants for genes involved in malignant transformation |
| Hugo Symbol | Variant Class | Variant Classification | dbSNP RS | HGVSc | HGVSp | HGVSp Short | SWISSPROT | BIOTYPE | SIFT | PolyPhen | Tumor Sample Barcode | Tissue | Histology | Sex | Age | Stage | Therapy Types | Drugs | Outcome |
| FBL | SNV | Missense_Mutation | c.823N>A | p.Ala275Thr | p.A275T | P22087 | protein_coding | tolerated(0.08) | benign(0.375) | TCGA-A8-A09Z-01 | Breast | breast invasive carcinoma | Female | >=65 | I/II | Unknown | Unknown | SD | |
| FBL | SNV | Missense_Mutation | novel | c.214N>G | p.Arg72Gly | p.R72G | P22087 | protein_coding | tolerated(0.88) | benign(0) | TCGA-BH-A0BL-01 | Breast | breast invasive carcinoma | Female | <65 | I/II | Chemotherapy | adriamycin | CR |
| FBL | SNV | Missense_Mutation | c.637N>T | p.Val213Leu | p.V213L | P22087 | protein_coding | deleterious(0) | benign(0.015) | TCGA-D8-A13Z-01 | Breast | breast invasive carcinoma | Female | <65 | I/II | Chemotherapy | doxorubicine | SD | |
| FBL | SNV | Missense_Mutation | rs754522515 | c.653N>A | p.Arg218Gln | p.R218Q | P22087 | protein_coding | deleterious(0.02) | possibly_damaging(0.872) | TCGA-E2-A152-01 | Breast | breast invasive carcinoma | Female | <65 | I/II | Targeted Molecular therapy | trastuzumab | PD |
| FBL | insertion | In_Frame_Ins | novel | c.400_401insTCCAACACATGAACTTTGGGGGACACACTAGAACCGTAG | p.Tyr134delinsPheGlnHisMetAsnPheGlyGlyHisThrArgThrValAsp | p.Y134delinsFQHMNFGGHTRTVD | P22087 | protein_coding | TCGA-A8-A0A6-01 | Breast | breast invasive carcinoma | Female | <65 | III/IV | Chemotherapy | epirubicin | CR | ||
| FBL | SNV | Missense_Mutation | c.206A>T | p.Asn69Ile | p.N69I | P22087 | protein_coding | tolerated(0.12) | benign(0.001) | TCGA-AA-3672-01 | Colorectum | colon adenocarcinoma | Female | >=65 | III/IV | Unknown | Unknown | SD | |
| FBL | SNV | Missense_Mutation | rs762429726 | c.61C>T | p.Arg21Cys | p.R21C | P22087 | protein_coding | tolerated_low_confidence(0.06) | possibly_damaging(0.876) | TCGA-AA-3864-01 | Colorectum | colon adenocarcinoma | Male | >=65 | I/II | Unknown | Unknown | SD |
| FBL | SNV | Missense_Mutation | novel | c.960G>T | p.Lys320Asn | p.K320N | P22087 | protein_coding | deleterious_low_confidence(0) | possibly_damaging(0.855) | TCGA-CA-6717-01 | Colorectum | colon adenocarcinoma | Male | <65 | I/II | Chemotherapy | oxaliplatin | CR |
| FBL | SNV | Missense_Mutation | c.476N>G | p.Pro159Arg | p.P159R | P22087 | protein_coding | deleterious(0.02) | possibly_damaging(0.841) | TCGA-CK-4951-01 | Colorectum | colon adenocarcinoma | Female | >=65 | I/II | Unknown | Unknown | PD | |
| FBL | SNV | Missense_Mutation | novel | c.445C>A | p.Leu149Met | p.L149M | P22087 | protein_coding | tolerated(0.11) | possibly_damaging(0.535) | TCGA-CM-6171-01 | Colorectum | colon adenocarcinoma | Female | >=65 | I/II | Unknown | Unknown | SD |
| Page: 1 2 3 4 |
Top |
Related drugs of malignant transformation related genes |
| Identification of chemicals and drugs interact with genes involved in malignant transfromation |
| (DGIdb 4.0) |
| Entrez ID | Symbol | Category | Interaction Types | Drug Claim Name | Drug Name | PMIDs |
| Page: 1 |

Copyright 2023-Present -The University of Texas Health Science Center at Houston |