
|
|||||
|
 | |
| |
| |
| |
| |
| |
|
Gene: FAT2 |
Gene summary for FAT2 |
| Gene information | Species | Human | Gene symbol | FAT2 | Gene ID | 2196 |
| Gene name | FAT atypical cadherin 2 | |
| Gene Alias | CDHF8 | |
| Cytomap | 5q33.1 | |
| Gene Type | protein-coding | GO ID | GO:0001667 | UniProtAcc | Q6PIA2 |
Top |
Malignant transformation analysis |
| Identification of the aberrant gene expression in precancerous and cancerous lesions by comparing the gene expression of stem-like cells in diseased tissues with normal stem cells |
| Entrez ID | Symbol | Replicates | Species | Organ | Tissue | Adj P-value | Log2FC | Malignancy |
| 2196 | FAT2 | CCI_1 | Human | Cervix | CC | 1.74e-04 | 6.34e-01 | 0.528 |
| 2196 | FAT2 | CCI_2 | Human | Cervix | CC | 1.15e-11 | 1.27e+00 | 0.5249 |
| 2196 | FAT2 | CCI_3 | Human | Cervix | CC | 3.53e-29 | 1.83e+00 | 0.516 |
| 2196 | FAT2 | sample3 | Human | Cervix | CC | 9.92e-05 | 2.12e-01 | 0.1387 |
| 2196 | FAT2 | T3 | Human | Cervix | CC | 4.61e-04 | 2.04e-01 | 0.1389 |
| 2196 | FAT2 | LZE4T | Human | Esophagus | ESCC | 9.89e-08 | 3.20e-01 | 0.0811 |
| 2196 | FAT2 | LZE8T | Human | Esophagus | ESCC | 1.14e-16 | 5.91e-01 | 0.067 |
| 2196 | FAT2 | P2T-E | Human | Esophagus | ESCC | 3.84e-14 | 4.48e-01 | 0.1177 |
| 2196 | FAT2 | P4T-E | Human | Esophagus | ESCC | 5.26e-04 | 1.43e-01 | 0.1323 |
| 2196 | FAT2 | P5T-E | Human | Esophagus | ESCC | 1.87e-11 | 3.16e-01 | 0.1327 |
| 2196 | FAT2 | P11T-E | Human | Esophagus | ESCC | 8.43e-21 | 1.42e+00 | 0.1426 |
| 2196 | FAT2 | P12T-E | Human | Esophagus | ESCC | 3.84e-05 | 2.04e-01 | 0.1122 |
| 2196 | FAT2 | P15T-E | Human | Esophagus | ESCC | 2.72e-16 | 5.19e-01 | 0.1149 |
| 2196 | FAT2 | P16T-E | Human | Esophagus | ESCC | 9.67e-08 | 4.34e-02 | 0.1153 |
| 2196 | FAT2 | P17T-E | Human | Esophagus | ESCC | 1.92e-09 | 4.10e-01 | 0.1278 |
| 2196 | FAT2 | P20T-E | Human | Esophagus | ESCC | 3.25e-10 | 1.96e-01 | 0.1124 |
| 2196 | FAT2 | P21T-E | Human | Esophagus | ESCC | 8.42e-17 | 3.28e-01 | 0.1617 |
| 2196 | FAT2 | P22T-E | Human | Esophagus | ESCC | 5.23e-26 | 5.14e-01 | 0.1236 |
| 2196 | FAT2 | P23T-E | Human | Esophagus | ESCC | 8.45e-05 | 1.18e-01 | 0.108 |
| 2196 | FAT2 | P24T-E | Human | Esophagus | ESCC | 1.23e-04 | 2.78e-01 | 0.1287 |
| Page: 1 2 3 4 5 |
| Tissue | Expression Dynamics | Abbreviation |
| Cervix | 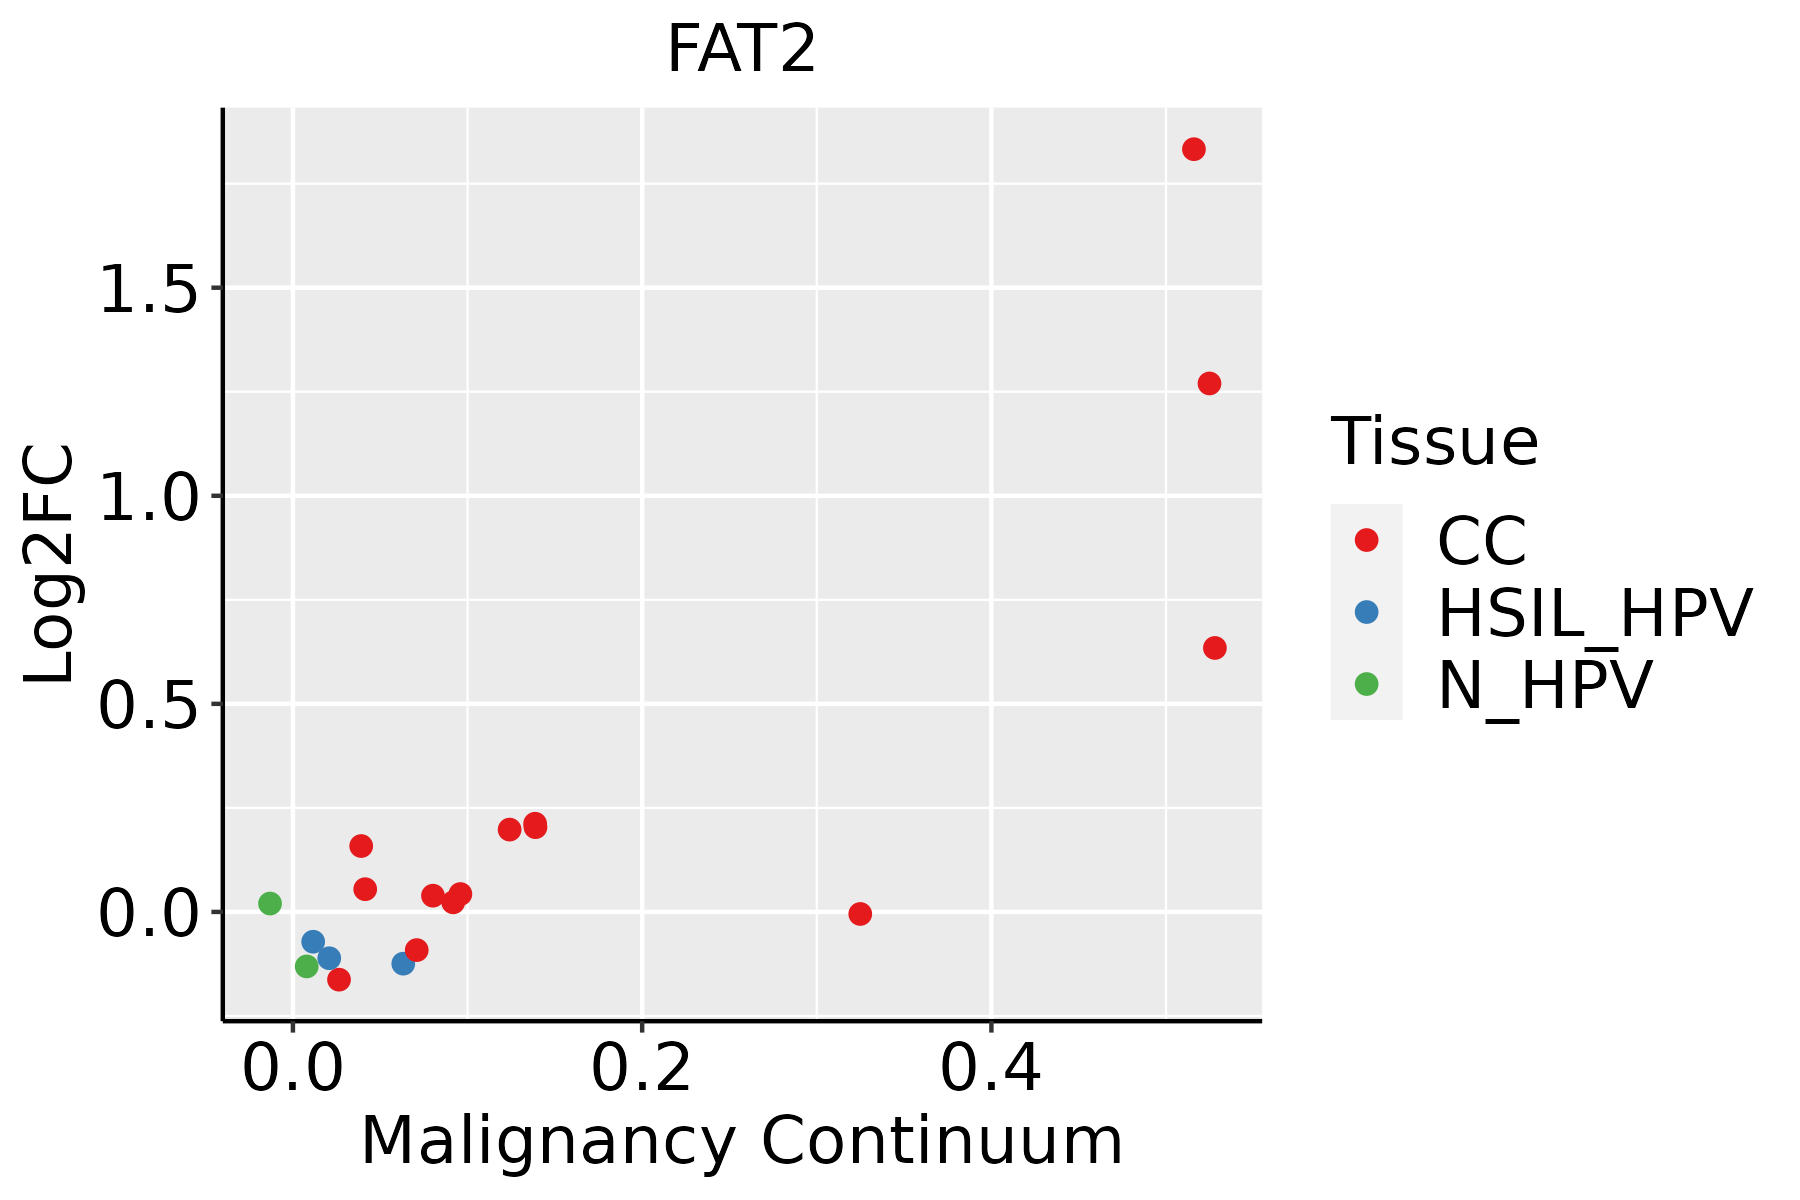 | CC: Cervix cancer |
| HSIL_HPV: HPV-infected high-grade squamous intraepithelial lesions | ||
| N_HPV: HPV-infected normal cervix | ||
| Esophagus | 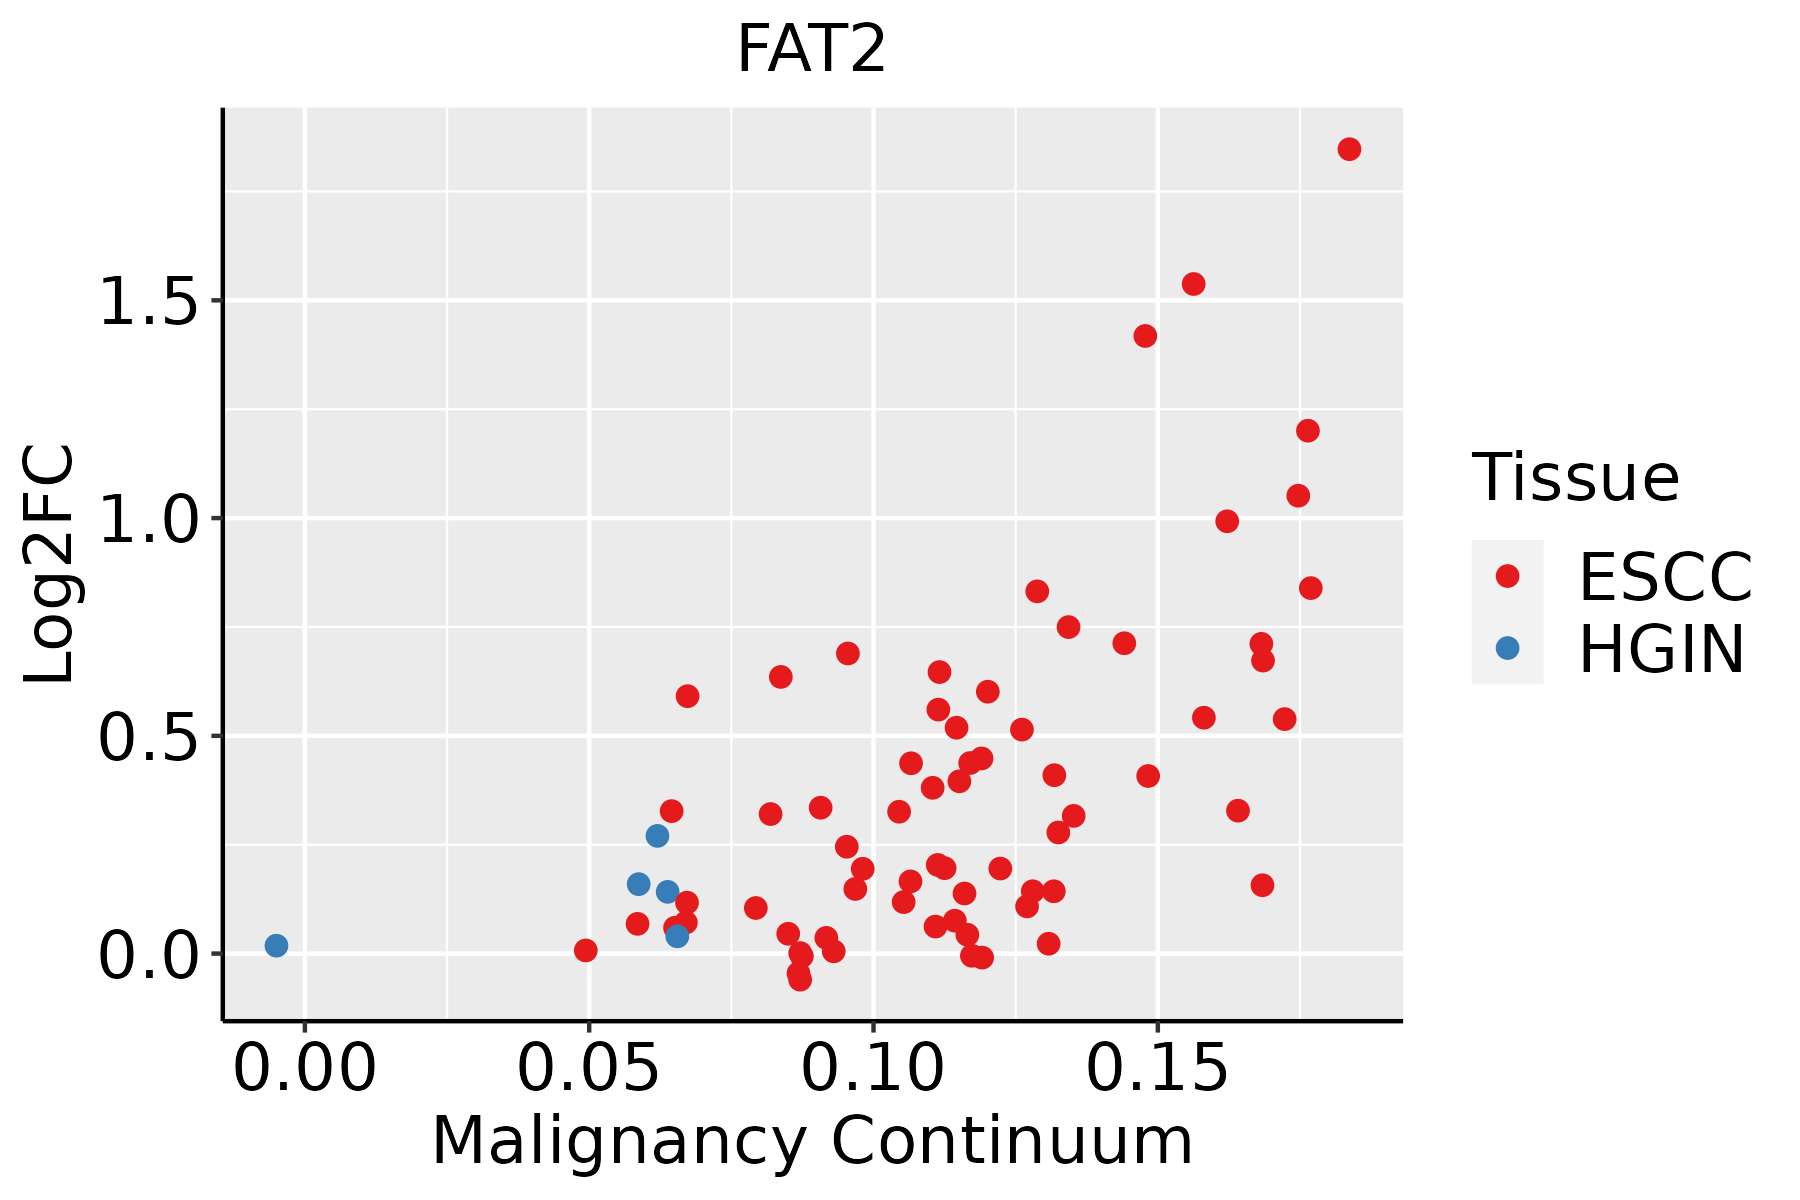 | ESCC: Esophageal squamous cell carcinoma |
| HGIN: High-grade intraepithelial neoplasias | ||
| LGIN: Low-grade intraepithelial neoplasias | ||
| Oral Cavity | 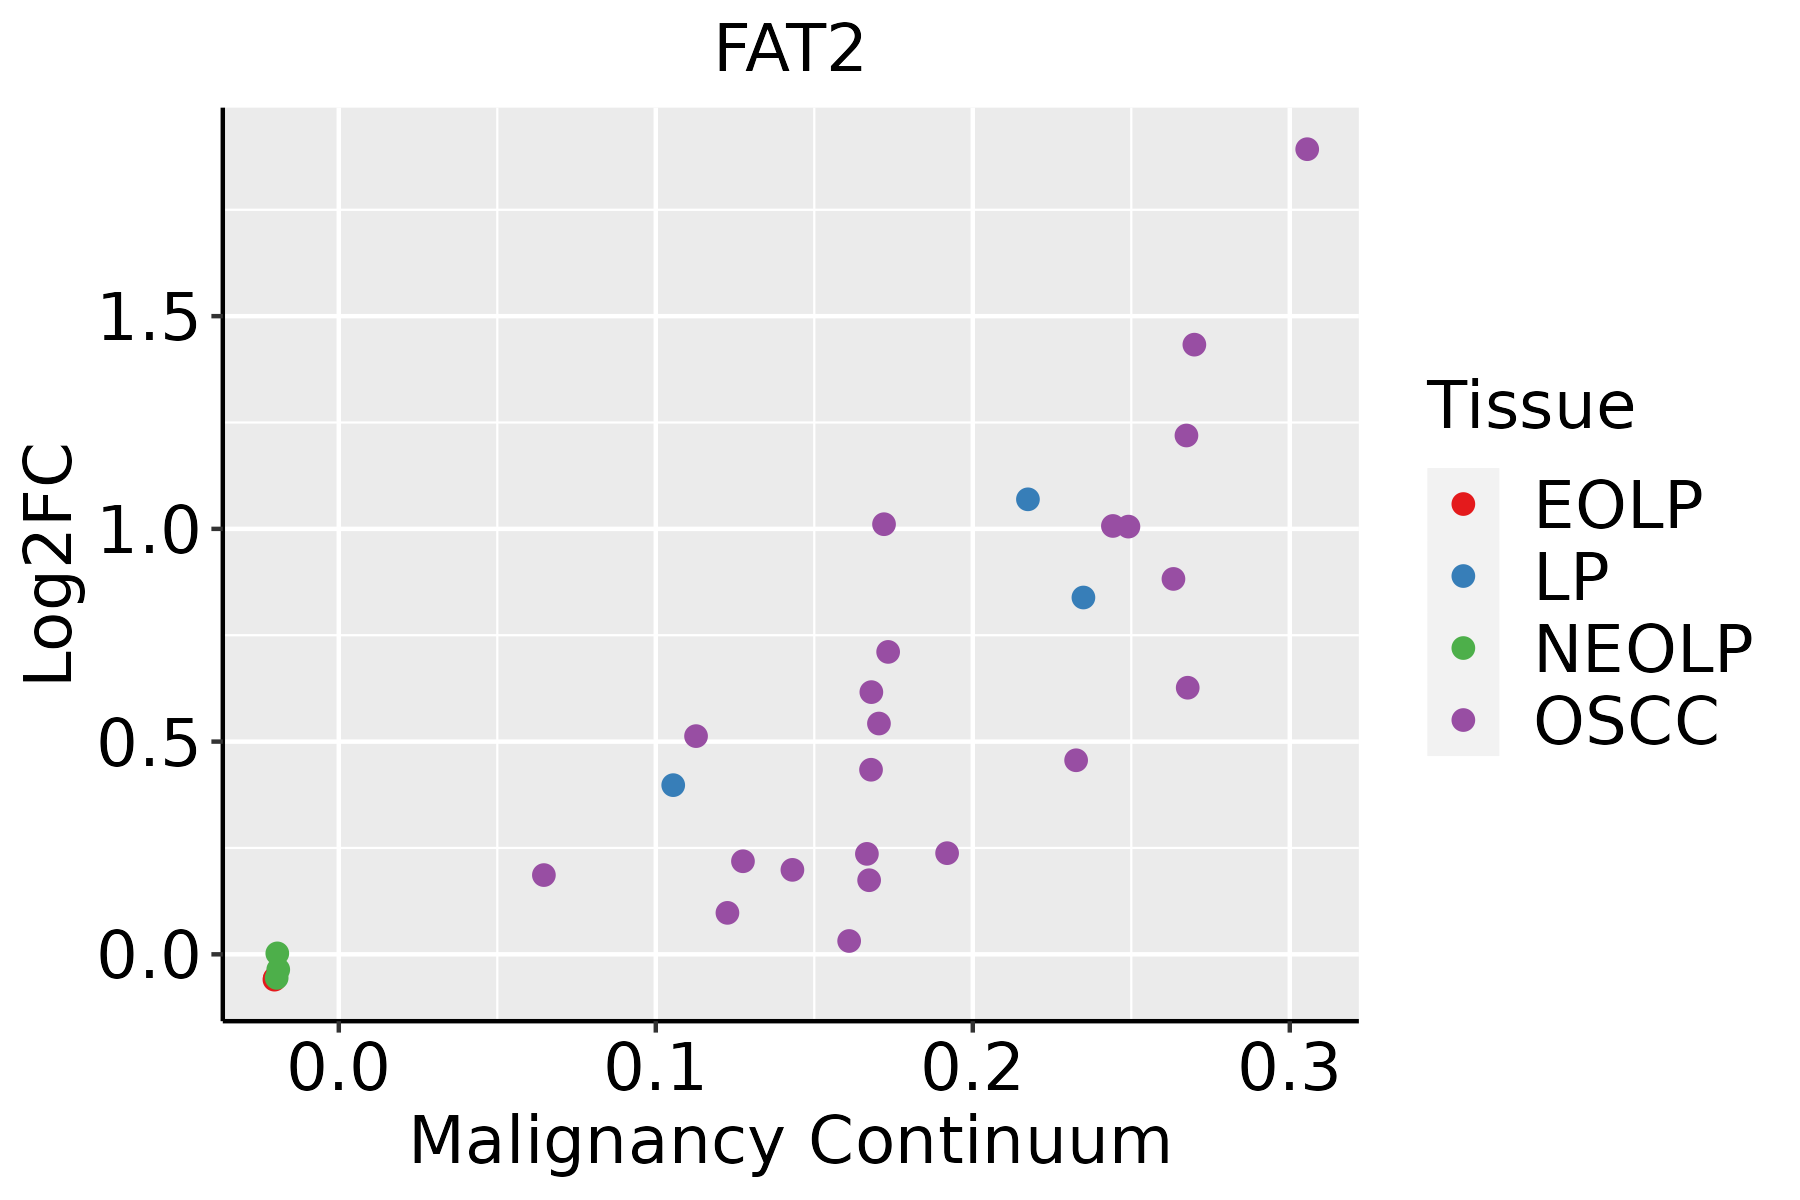 | EOLP: Erosive Oral lichen planus |
| LP: leukoplakia | ||
| NEOLP: Non-erosive oral lichen planus | ||
| OSCC: Oral squamous cell carcinoma | ||
| Skin | 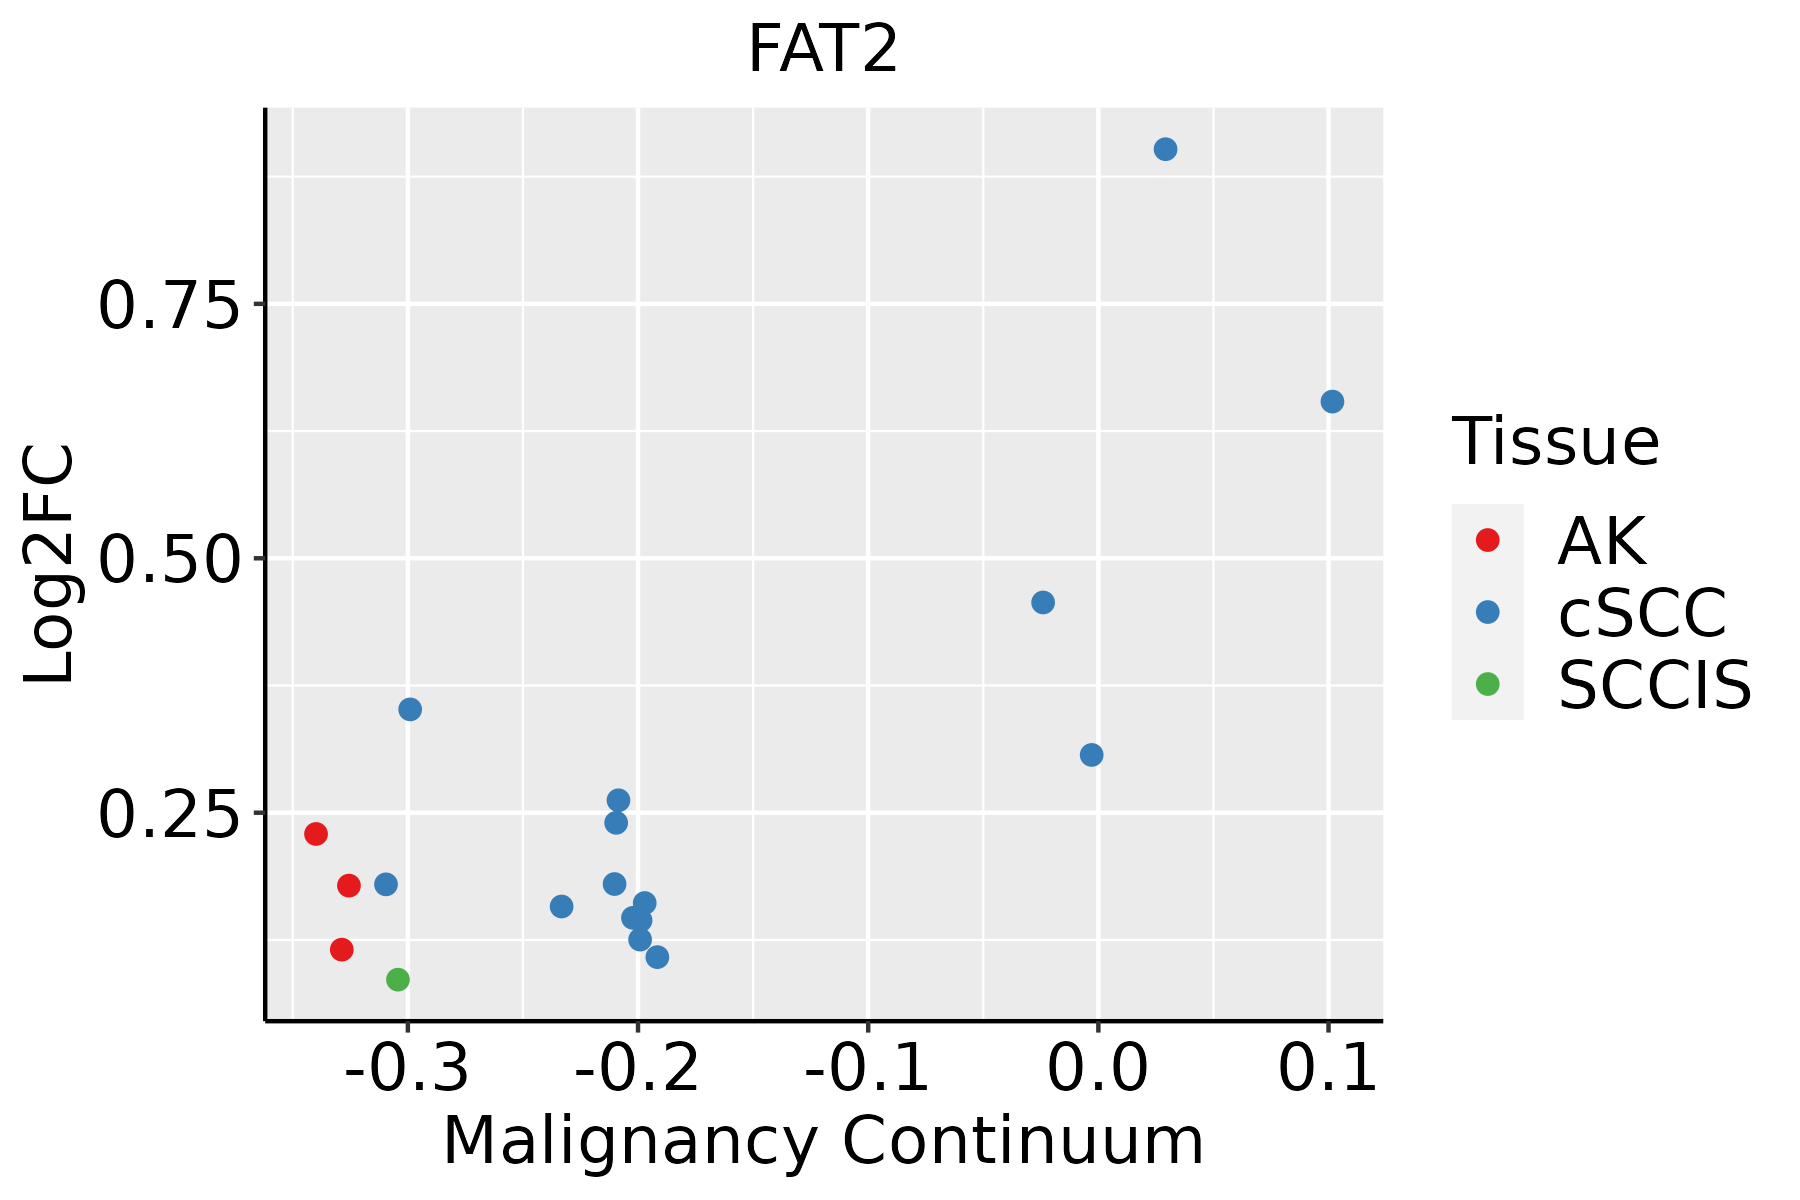 | AK: Actinic keratosis |
| cSCC: Cutaneous squamous cell carcinoma | ||
| SCCIS:squamous cell carcinoma in situ |
| ∗log2FC in expression of this searched gene in stem-like cells from each diseased tissue sample relative to stem-like cells in normal samples in each tissue plotted against the malignancy continuum. Samples are colored based on if they are from different disease stage. |
Top |
Malignant transformation related pathway analysis |
| Find out the enriched GO biological processes and KEGG pathways involved in transition from healthy to precancer to cancer |
| Tissue | Disease Stage | Enriched GO biological Processes |
| Colorectum | AD |  |
| Colorectum | SER |  |
| Colorectum | MSS |  |
| Colorectum | MSI-H |  |
| Colorectum | FAP |  |
| ∗Top 15 enriched GO BP terms are showed in the bar plot of each disease state in each tissue. Each row represents a significant GO biological process which is colored according to the -log10(p.adjust). |
| Page: 1 2 3 4 5 6 7 8 9 |
| GO ID | Tissue | Disease Stage | Description | Gene Ratio | Bg Ratio | pvalue | p.adjust | Count |
| GO:00315898 | Cervix | CC | cell-substrate adhesion | 96/2311 | 363/18723 | 1.48e-13 | 8.85e-11 | 96 |
| GO:009013210 | Cervix | CC | epithelium migration | 90/2311 | 360/18723 | 2.45e-11 | 6.11e-09 | 90 |
| GO:00016679 | Cervix | CC | ameboidal-type cell migration | 110/2311 | 475/18723 | 2.66e-11 | 6.36e-09 | 110 |
| GO:001063110 | Cervix | CC | epithelial cell migration | 89/2311 | 357/18723 | 3.72e-11 | 8.54e-09 | 89 |
| GO:009013010 | Cervix | CC | tissue migration | 90/2311 | 365/18723 | 5.42e-11 | 1.05e-08 | 90 |
| GO:003158919 | Esophagus | ESCC | cell-substrate adhesion | 221/8552 | 363/18723 | 3.06e-09 | 6.62e-08 | 221 |
| GO:000166720 | Esophagus | ESCC | ameboidal-type cell migration | 250/8552 | 475/18723 | 1.22e-03 | 5.97e-03 | 250 |
| GO:001063120 | Esophagus | ESCC | epithelial cell migration | 187/8552 | 357/18723 | 6.05e-03 | 2.23e-02 | 187 |
| GO:009013220 | Esophagus | ESCC | epithelium migration | 188/8552 | 360/18723 | 6.96e-03 | 2.54e-02 | 188 |
| GO:009013020 | Esophagus | ESCC | tissue migration | 190/8552 | 365/18723 | 7.91e-03 | 2.82e-02 | 190 |
| GO:003158917 | Oral cavity | OSCC | cell-substrate adhesion | 193/7305 | 363/18723 | 2.48e-08 | 4.82e-07 | 193 |
| GO:000166719 | Oral cavity | OSCC | ameboidal-type cell migration | 228/7305 | 475/18723 | 3.46e-05 | 3.10e-04 | 228 |
| GO:001063118 | Oral cavity | OSCC | epithelial cell migration | 174/7305 | 357/18723 | 1.04e-04 | 7.70e-04 | 174 |
| GO:009013218 | Oral cavity | OSCC | epithelium migration | 175/7305 | 360/18723 | 1.18e-04 | 8.54e-04 | 175 |
| GO:009013018 | Oral cavity | OSCC | tissue migration | 176/7305 | 365/18723 | 1.92e-04 | 1.29e-03 | 176 |
| GO:003158918 | Oral cavity | LP | cell-substrate adhesion | 111/4623 | 363/18723 | 5.94e-03 | 3.53e-02 | 111 |
| GO:003158920 | Skin | AK | cell-substrate adhesion | 74/1910 | 363/18723 | 4.40e-09 | 3.30e-07 | 74 |
| GO:001063124 | Skin | AK | epithelial cell migration | 70/1910 | 357/18723 | 5.88e-08 | 2.95e-06 | 70 |
| GO:009013224 | Skin | AK | epithelium migration | 70/1910 | 360/18723 | 8.28e-08 | 3.89e-06 | 70 |
| GO:009013024 | Skin | AK | tissue migration | 70/1910 | 365/18723 | 1.45e-07 | 6.29e-06 | 70 |
| Page: 1 2 |
| Pathway ID | Tissue | Disease Stage | Description | Gene Ratio | Bg Ratio | pvalue | p.adjust | qvalue | Count |
| Page: 1 |
Top |
Cell-cell communication analysis |
| Identification of potential cell-cell interactions between two cell types and their ligand-receptor pairs for different disease states |
| Ligand | Receptor | LRpair | Pathway | Tissue | Disease Stage |
| Page: 1 |
Top |
Single-cell gene regulatory network inference analysis |
| Find out the significant the regulons (TFs) and the target genes of each regulon across cell types for different disease states |
| TF | Cell Type | Tissue | Disease Stage | Target Gene | RSS | Regulon Activity |
| ∗The dot plots of a searched regulon are shown for all cell subpopulations in each disease state of each tissue based on the regulon specific score inferred using pySCENIC and by calculating the average expression. |
| Page: 1 |
Top |
Somatic mutation of malignant transformation related genes |
| Annotation of somatic variants for genes involved in malignant transformation |
| Hugo Symbol | Variant Class | Variant Classification | dbSNP RS | HGVSc | HGVSp | HGVSp Short | SWISSPROT | BIOTYPE | SIFT | PolyPhen | Tumor Sample Barcode | Tissue | Histology | Sex | Age | Stage | Therapy Types | Drugs | Outcome |
| FAT2 | SNV | Missense_Mutation | novel | c.12226N>T | p.His4076Tyr | p.H4076Y | Q9NYQ8 | protein_coding | deleterious(0.01) | possibly_damaging(0.469) | TCGA-5L-AAT1-01 | Breast | breast invasive carcinoma | Female | <65 | III/IV | Hormone Therapy | letrozol | SD |
| FAT2 | SNV | Missense_Mutation | c.7928T>A | p.Val2643Asp | p.V2643D | Q9NYQ8 | protein_coding | deleterious(0) | probably_damaging(1) | TCGA-A1-A0SG-01 | Breast | breast invasive carcinoma | Female | <65 | I/II | Chemotherapy | SD | ||
| FAT2 | SNV | Missense_Mutation | c.5269N>G | p.Met1757Val | p.M1757V | Q9NYQ8 | protein_coding | tolerated(1) | benign(0) | TCGA-A2-A0SV-01 | Breast | breast invasive carcinoma | Female | <65 | III/IV | Other, specify in notesBisphosphonate therapy | zometa | PD | |
| FAT2 | SNV | Missense_Mutation | novel | c.5582N>T | p.His1861Leu | p.H1861L | Q9NYQ8 | protein_coding | tolerated(0.09) | benign(0.082) | TCGA-A7-A3IZ-01 | Breast | breast invasive carcinoma | Female | <65 | I/II | Chemotherapy | cytoxan | SD |
| FAT2 | SNV | Missense_Mutation | c.3607N>C | p.Glu1203Gln | p.E1203Q | Q9NYQ8 | protein_coding | deleterious(0) | possibly_damaging(0.893) | TCGA-A8-A09G-01 | Breast | breast invasive carcinoma | Female | >=65 | III/IV | Unknown | Unknown | SD | |
| FAT2 | SNV | Missense_Mutation | c.7356N>C | p.Leu2452Phe | p.L2452F | Q9NYQ8 | protein_coding | deleterious(0) | probably_damaging(1) | TCGA-AC-A23H-01 | Breast | breast invasive carcinoma | Female | >=65 | I/II | Unknown | Unknown | PD | |
| FAT2 | SNV | Missense_Mutation | rs750499129 | c.5887N>C | p.Asp1963His | p.D1963H | Q9NYQ8 | protein_coding | tolerated(0.1) | benign(0.125) | TCGA-AC-A23H-01 | Breast | breast invasive carcinoma | Female | >=65 | I/II | Unknown | Unknown | PD |
| FAT2 | SNV | Missense_Mutation | c.1798N>C | p.Glu600Gln | p.E600Q | Q9NYQ8 | protein_coding | tolerated(0.45) | possibly_damaging(0.571) | TCGA-AC-A23H-01 | Breast | breast invasive carcinoma | Female | >=65 | I/II | Unknown | Unknown | PD | |
| FAT2 | SNV | Missense_Mutation | c.1580N>C | p.Arg527Thr | p.R527T | Q9NYQ8 | protein_coding | deleterious(0) | probably_damaging(0.998) | TCGA-AC-A23H-01 | Breast | breast invasive carcinoma | Female | >=65 | I/II | Unknown | Unknown | PD | |
| FAT2 | SNV | Missense_Mutation | novel | c.8539N>T | p.Leu2847Phe | p.L2847F | Q9NYQ8 | protein_coding | tolerated(0.05) | probably_damaging(0.967) | TCGA-AN-A046-01 | Breast | breast invasive carcinoma | Female | >=65 | I/II | Unknown | Unknown | SD |
| Page: 1 2 3 4 5 6 7 8 9 10 11 12 13 14 15 16 17 18 19 20 21 22 23 24 25 26 27 28 29 30 31 32 33 34 35 36 37 38 39 40 41 42 43 44 45 46 47 48 49 50 51 52 53 |
Top |
Related drugs of malignant transformation related genes |
| Identification of chemicals and drugs interact with genes involved in malignant transfromation |
| (DGIdb 4.0) |
| Entrez ID | Symbol | Category | Interaction Types | Drug Claim Name | Drug Name | PMIDs |
| Page: 1 |

Copyright 2023-Present -The University of Texas Health Science Center at Houston |