
|
|||||
|
 | |
| |
| |
| |
| |
| |
|
Gene: FASTKD3 |
Gene summary for FASTKD3 |
| Gene information | Species | Human | Gene symbol | FASTKD3 | Gene ID | 79072 |
| Gene name | FAST kinase domains 3 | |
| Gene Alias | FASTKD3 | |
| Cytomap | 5p15.31 | |
| Gene Type | protein-coding | GO ID | GO:0000959 | UniProtAcc | Q14CZ7 |
Top |
Malignant transformation analysis |
| Identification of the aberrant gene expression in precancerous and cancerous lesions by comparing the gene expression of stem-like cells in diseased tissues with normal stem cells |
| Entrez ID | Symbol | Replicates | Species | Organ | Tissue | Adj P-value | Log2FC | Malignancy |
| 79072 | FASTKD3 | P2T-E | Human | Esophagus | ESCC | 1.31e-03 | 9.17e-02 | 0.1177 |
| 79072 | FASTKD3 | P4T-E | Human | Esophagus | ESCC | 1.27e-12 | 1.89e-01 | 0.1323 |
| 79072 | FASTKD3 | P5T-E | Human | Esophagus | ESCC | 6.50e-06 | 1.55e-01 | 0.1327 |
| 79072 | FASTKD3 | P8T-E | Human | Esophagus | ESCC | 2.92e-12 | 3.14e-01 | 0.0889 |
| 79072 | FASTKD3 | P10T-E | Human | Esophagus | ESCC | 3.82e-05 | 1.64e-01 | 0.116 |
| 79072 | FASTKD3 | P12T-E | Human | Esophagus | ESCC | 2.19e-08 | 1.76e-01 | 0.1122 |
| 79072 | FASTKD3 | P15T-E | Human | Esophagus | ESCC | 8.85e-05 | 9.67e-02 | 0.1149 |
| 79072 | FASTKD3 | P20T-E | Human | Esophagus | ESCC | 7.91e-08 | 1.57e-01 | 0.1124 |
| 79072 | FASTKD3 | P21T-E | Human | Esophagus | ESCC | 2.37e-05 | 1.21e-01 | 0.1617 |
| 79072 | FASTKD3 | P22T-E | Human | Esophagus | ESCC | 3.62e-03 | 6.47e-02 | 0.1236 |
| 79072 | FASTKD3 | P23T-E | Human | Esophagus | ESCC | 1.72e-10 | 1.80e-01 | 0.108 |
| 79072 | FASTKD3 | P26T-E | Human | Esophagus | ESCC | 1.42e-05 | 1.41e-01 | 0.1276 |
| 79072 | FASTKD3 | P27T-E | Human | Esophagus | ESCC | 1.29e-07 | 1.67e-01 | 0.1055 |
| 79072 | FASTKD3 | P28T-E | Human | Esophagus | ESCC | 5.34e-07 | 1.62e-01 | 0.1149 |
| 79072 | FASTKD3 | P30T-E | Human | Esophagus | ESCC | 3.15e-02 | 1.68e-01 | 0.137 |
| 79072 | FASTKD3 | P31T-E | Human | Esophagus | ESCC | 6.37e-03 | 1.41e-01 | 0.1251 |
| 79072 | FASTKD3 | P32T-E | Human | Esophagus | ESCC | 2.04e-20 | 4.60e-01 | 0.1666 |
| 79072 | FASTKD3 | P36T-E | Human | Esophagus | ESCC | 5.11e-04 | 1.08e-01 | 0.1187 |
| 79072 | FASTKD3 | P37T-E | Human | Esophagus | ESCC | 2.26e-04 | 1.29e-01 | 0.1371 |
| 79072 | FASTKD3 | P47T-E | Human | Esophagus | ESCC | 3.25e-02 | 9.15e-02 | 0.1067 |
| Page: 1 2 |
| Tissue | Expression Dynamics | Abbreviation |
| Esophagus | 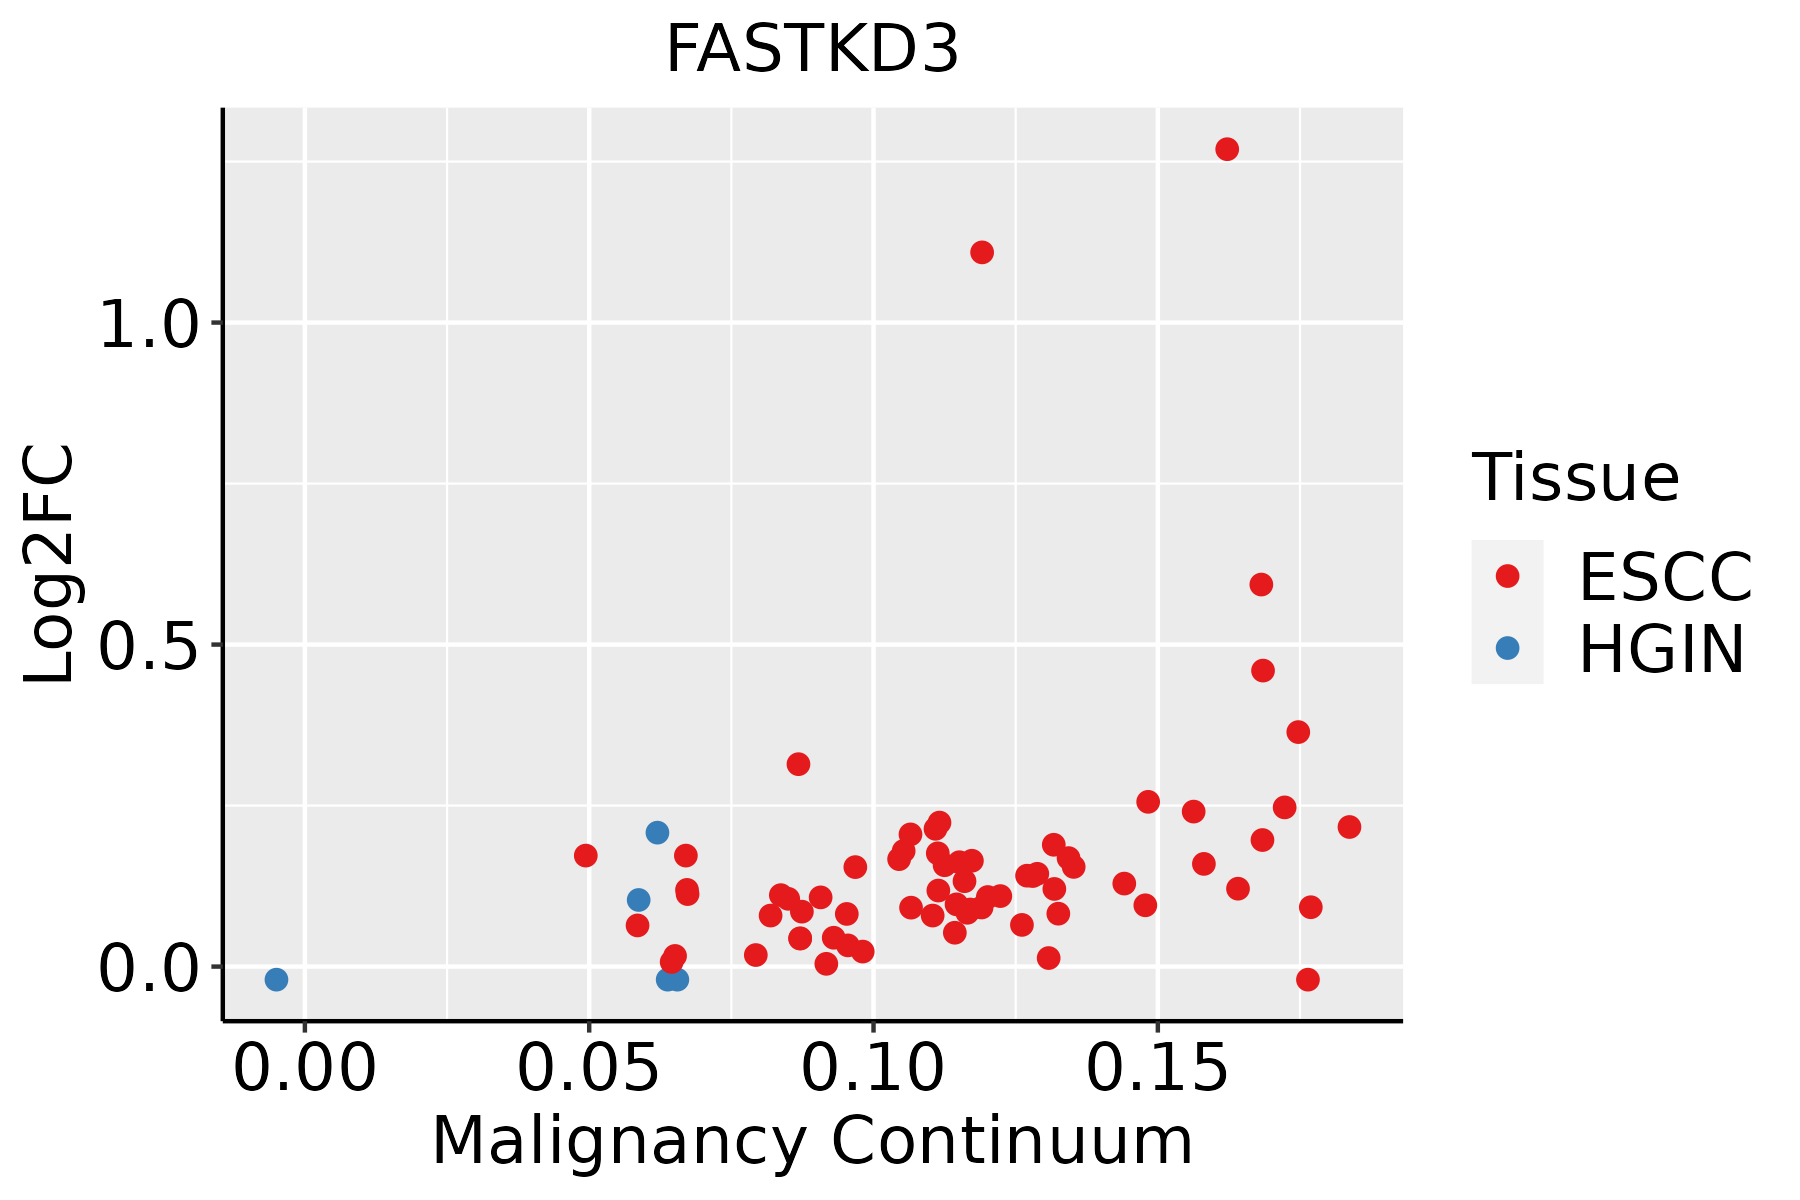 | ESCC: Esophageal squamous cell carcinoma |
| HGIN: High-grade intraepithelial neoplasias | ||
| LGIN: Low-grade intraepithelial neoplasias |
| ∗log2FC in expression of this searched gene in stem-like cells from each diseased tissue sample relative to stem-like cells in normal samples in each tissue plotted against the malignancy continuum. Samples are colored based on if they are from different disease stage. |
Top |
Malignant transformation related pathway analysis |
| Find out the enriched GO biological processes and KEGG pathways involved in transition from healthy to precancer to cancer |
| Tissue | Disease Stage | Enriched GO biological Processes |
| Colorectum | AD |  |
| Colorectum | SER |  |
| Colorectum | MSS |  |
| Colorectum | MSI-H |  |
| Colorectum | FAP |  |
| ∗Top 15 enriched GO BP terms are showed in the bar plot of each disease state in each tissue. Each row represents a significant GO biological process which is colored according to the -log10(p.adjust). |
| Page: 1 2 3 4 5 6 7 8 9 |
| GO ID | Tissue | Disease Stage | Description | Gene Ratio | Bg Ratio | pvalue | p.adjust | Count |
| GO:1903311110 | Esophagus | ESCC | regulation of mRNA metabolic process | 210/8552 | 288/18723 | 3.25e-21 | 5.56e-19 | 210 |
| GO:0006401110 | Esophagus | ESCC | RNA catabolic process | 204/8552 | 278/18723 | 3.39e-21 | 5.66e-19 | 204 |
| GO:0033108110 | Esophagus | ESCC | mitochondrial respiratory chain complex assembly | 83/8552 | 93/18723 | 9.56e-19 | 1.05e-16 | 83 |
| GO:014005313 | Esophagus | ESCC | mitochondrial gene expression | 93/8552 | 108/18723 | 1.96e-18 | 2.03e-16 | 93 |
| GO:0034655110 | Esophagus | ESCC | nucleobase-containing compound catabolic process | 272/8552 | 407/18723 | 2.92e-18 | 2.90e-16 | 272 |
| GO:0006402110 | Esophagus | ESCC | mRNA catabolic process | 170/8552 | 232/18723 | 8.70e-18 | 8.00e-16 | 170 |
| GO:0006417111 | Esophagus | ESCC | regulation of translation | 304/8552 | 468/18723 | 1.53e-17 | 1.33e-15 | 304 |
| GO:003254314 | Esophagus | ESCC | mitochondrial translation | 68/8552 | 76/18723 | 1.02e-15 | 6.86e-14 | 68 |
| GO:004670018 | Esophagus | ESCC | heterocycle catabolic process | 286/8552 | 445/18723 | 1.12e-15 | 7.47e-14 | 286 |
| GO:0045727111 | Esophagus | ESCC | positive regulation of translation | 107/8552 | 136/18723 | 2.79e-15 | 1.68e-13 | 107 |
| GO:004427019 | Esophagus | ESCC | cellular nitrogen compound catabolic process | 288/8552 | 451/18723 | 3.03e-15 | 1.79e-13 | 288 |
| GO:0034250111 | Esophagus | ESCC | positive regulation of cellular amide metabolic process | 123/8552 | 162/18723 | 3.32e-15 | 1.93e-13 | 123 |
| GO:001943918 | Esophagus | ESCC | aromatic compound catabolic process | 295/8552 | 467/18723 | 1.09e-14 | 5.98e-13 | 295 |
| GO:190136118 | Esophagus | ESCC | organic cyclic compound catabolic process | 307/8552 | 495/18723 | 9.99e-14 | 4.80e-12 | 307 |
| GO:001700413 | Esophagus | ESCC | cytochrome complex assembly | 34/8552 | 36/18723 | 5.08e-10 | 1.31e-08 | 34 |
| GO:006101319 | Esophagus | ESCC | regulation of mRNA catabolic process | 115/8552 | 166/18723 | 5.90e-10 | 1.49e-08 | 115 |
| GO:004348719 | Esophagus | ESCC | regulation of RNA stability | 117/8552 | 170/18723 | 7.91e-10 | 1.94e-08 | 117 |
| GO:004348819 | Esophagus | ESCC | regulation of mRNA stability | 109/8552 | 158/18723 | 2.40e-09 | 5.35e-08 | 109 |
| GO:000853512 | Esophagus | ESCC | respiratory chain complex IV assembly | 24/8552 | 26/18723 | 6.87e-07 | 8.99e-06 | 24 |
| GO:003361712 | Esophagus | ESCC | mitochondrial cytochrome c oxidase assembly | 21/8552 | 22/18723 | 8.75e-07 | 1.13e-05 | 21 |
| Page: 1 2 |
| Pathway ID | Tissue | Disease Stage | Description | Gene Ratio | Bg Ratio | pvalue | p.adjust | qvalue | Count |
| Page: 1 |
Top |
Cell-cell communication analysis |
| Identification of potential cell-cell interactions between two cell types and their ligand-receptor pairs for different disease states |
| Ligand | Receptor | LRpair | Pathway | Tissue | Disease Stage |
| Page: 1 |
Top |
Single-cell gene regulatory network inference analysis |
| Find out the significant the regulons (TFs) and the target genes of each regulon across cell types for different disease states |
| TF | Cell Type | Tissue | Disease Stage | Target Gene | RSS | Regulon Activity |
| ∗The dot plots of a searched regulon are shown for all cell subpopulations in each disease state of each tissue based on the regulon specific score inferred using pySCENIC and by calculating the average expression. |
| Page: 1 |
Top |
Somatic mutation of malignant transformation related genes |
| Annotation of somatic variants for genes involved in malignant transformation |
| Hugo Symbol | Variant Class | Variant Classification | dbSNP RS | HGVSc | HGVSp | HGVSp Short | SWISSPROT | BIOTYPE | SIFT | PolyPhen | Tumor Sample Barcode | Tissue | Histology | Sex | Age | Stage | Therapy Types | Drugs | Outcome |
| FASTKD3 | SNV | Missense_Mutation | c.341N>T | p.Glu114Val | p.E114V | Q14CZ7 | protein_coding | deleterious(0) | possibly_damaging(0.844) | TCGA-AN-A0AR-01 | Breast | breast invasive carcinoma | Female | <65 | I/II | Unknown | Unknown | SD | |
| FASTKD3 | SNV | Missense_Mutation | c.550N>A | p.Ala184Thr | p.A184T | Q14CZ7 | protein_coding | tolerated(0.05) | possibly_damaging(0.827) | TCGA-AN-A0XV-01 | Breast | breast invasive carcinoma | Female | >=65 | III/IV | Unknown | Unknown | SD | |
| FASTKD3 | SNV | Missense_Mutation | novel | c.1960C>G | p.Gln654Glu | p.Q654E | Q14CZ7 | protein_coding | deleterious(0.02) | benign(0.115) | TCGA-BH-A2L8-01 | Breast | breast invasive carcinoma | Female | <65 | I/II | Chemotherapy | cytoxan | CR |
| FASTKD3 | SNV | Missense_Mutation | novel | c.1799G>T | p.Arg600Met | p.R600M | Q14CZ7 | protein_coding | deleterious(0) | probably_damaging(0.999) | TCGA-2W-A8YY-01 | Cervix | cervical & endocervical cancer | Female | <65 | I/II | Chemotherapy | cisplatin | CR |
| FASTKD3 | SNV | Missense_Mutation | c.550N>A | p.Ala184Thr | p.A184T | Q14CZ7 | protein_coding | tolerated(0.05) | possibly_damaging(0.827) | TCGA-FU-A3HZ-01 | Cervix | cervical & endocervical cancer | Female | <65 | I/II | Chemotherapy | cisplatin | CR | |
| FASTKD3 | SNV | Missense_Mutation | c.1361N>T | p.Ser454Leu | p.S454L | Q14CZ7 | protein_coding | deleterious(0.02) | possibly_damaging(0.881) | TCGA-JW-A5VL-01 | Cervix | cervical & endocervical cancer | Female | <65 | I/II | Unknown | Unknown | SD | |
| FASTKD3 | SNV | Missense_Mutation | novel | c.1623N>C | p.Lys541Asn | p.K541N | Q14CZ7 | protein_coding | tolerated(0.09) | possibly_damaging(0.717) | TCGA-VS-A8QH-01 | Cervix | cervical & endocervical cancer | Female | >=65 | I/II | Chemotherapy | gemcitabine | PD |
| FASTKD3 | SNV | Missense_Mutation | c.1571C>A | p.Pro524Gln | p.P524Q | Q14CZ7 | protein_coding | deleterious(0.01) | probably_damaging(0.978) | TCGA-AA-3492-01 | Colorectum | colon adenocarcinoma | Female | >=65 | I/II | Unknown | Unknown | SD | |
| FASTKD3 | SNV | Missense_Mutation | novel | c.1067N>G | p.Glu356Gly | p.E356G | Q14CZ7 | protein_coding | deleterious(0) | probably_damaging(0.933) | TCGA-AA-3861-01 | Colorectum | colon adenocarcinoma | Male | >=65 | I/II | Unknown | Unknown | SD |
| FASTKD3 | SNV | Missense_Mutation | c.1197A>C | p.Gln399His | p.Q399H | Q14CZ7 | protein_coding | tolerated(0.14) | benign(0.003) | TCGA-AA-3977-01 | Colorectum | colon adenocarcinoma | Male | >=65 | I/II | Unknown | Unknown | SD |
| Page: 1 2 3 4 5 6 7 8 9 |
Top |
Related drugs of malignant transformation related genes |
| Identification of chemicals and drugs interact with genes involved in malignant transfromation |
| (DGIdb 4.0) |
| Entrez ID | Symbol | Category | Interaction Types | Drug Claim Name | Drug Name | PMIDs |
| Page: 1 |

Copyright 2023-Present -The University of Texas Health Science Center at Houston |