
|
|||||
|
 | |
| |
| |
| |
| |
| |
|
Gene: FASTK |
Gene summary for FASTK |
| Gene information | Species | Human | Gene symbol | FASTK | Gene ID | 10922 |
| Gene name | Fas activated serine/threonine kinase | |
| Gene Alias | FAST | |
| Cytomap | 7q36.1 | |
| Gene Type | protein-coding | GO ID | GO:0000959 | UniProtAcc | Q14296 |
Top |
Malignant transformation analysis |
| Identification of the aberrant gene expression in precancerous and cancerous lesions by comparing the gene expression of stem-like cells in diseased tissues with normal stem cells |
| Entrez ID | Symbol | Replicates | Species | Organ | Tissue | Adj P-value | Log2FC | Malignancy |
| 10922 | FASTK | HTA11_2487_2000001011 | Human | Colorectum | SER | 1.91e-04 | 2.80e-01 | -0.1808 |
| 10922 | FASTK | HTA11_1938_2000001011 | Human | Colorectum | AD | 9.57e-04 | 3.32e-01 | -0.0811 |
| 10922 | FASTK | HTA11_78_2000001011 | Human | Colorectum | AD | 2.73e-02 | 1.85e-01 | -0.1088 |
| 10922 | FASTK | HTA11_347_2000001011 | Human | Colorectum | AD | 1.61e-13 | 3.16e-01 | -0.1954 |
| 10922 | FASTK | HTA11_2112_2000001011 | Human | Colorectum | SER | 1.65e-04 | 5.59e-01 | -0.2196 |
| 10922 | FASTK | HTA11_3361_2000001011 | Human | Colorectum | AD | 3.46e-03 | 2.50e-01 | -0.1207 |
| 10922 | FASTK | HTA11_83_2000001011 | Human | Colorectum | SER | 7.84e-04 | 2.60e-01 | -0.1526 |
| 10922 | FASTK | HTA11_696_2000001011 | Human | Colorectum | AD | 2.74e-11 | 3.64e-01 | -0.1464 |
| 10922 | FASTK | HTA11_866_2000001011 | Human | Colorectum | AD | 4.32e-03 | 1.64e-01 | -0.1001 |
| 10922 | FASTK | HTA11_1391_2000001011 | Human | Colorectum | AD | 9.18e-07 | 3.99e-01 | -0.059 |
| 10922 | FASTK | HTA11_5216_2000001011 | Human | Colorectum | SER | 1.93e-02 | 4.15e-01 | -0.1462 |
| 10922 | FASTK | HTA11_10711_2000001011 | Human | Colorectum | AD | 8.21e-05 | 2.71e-01 | 0.0338 |
| 10922 | FASTK | HTA11_7696_3000711011 | Human | Colorectum | AD | 2.12e-10 | 3.39e-01 | 0.0674 |
| 10922 | FASTK | HTA11_6818_2000001021 | Human | Colorectum | AD | 1.25e-04 | 3.60e-01 | 0.0588 |
| 10922 | FASTK | HTA11_99999970781_79442 | Human | Colorectum | MSS | 2.20e-02 | 1.31e-01 | 0.294 |
| 10922 | FASTK | HTA11_99999971662_82457 | Human | Colorectum | MSS | 5.72e-04 | 2.06e-01 | 0.3859 |
| 10922 | FASTK | HTA11_99999974143_84620 | Human | Colorectum | MSS | 1.68e-08 | 3.70e-01 | 0.3005 |
| 10922 | FASTK | LZE2T | Human | Esophagus | ESCC | 5.77e-04 | 3.86e-01 | 0.082 |
| 10922 | FASTK | LZE4T | Human | Esophagus | ESCC | 3.76e-11 | 2.74e-01 | 0.0811 |
| 10922 | FASTK | LZE7T | Human | Esophagus | ESCC | 3.81e-16 | 7.19e-01 | 0.0667 |
| Page: 1 2 3 4 5 6 7 8 |
| Tissue | Expression Dynamics | Abbreviation |
| Colorectum (GSE201348) |  | FAP: Familial adenomatous polyposis |
| CRC: Colorectal cancer | ||
| Colorectum (HTA11) |  | AD: Adenomas |
| SER: Sessile serrated lesions | ||
| MSI-H: Microsatellite-high colorectal cancer | ||
| MSS: Microsatellite stable colorectal cancer | ||
| Esophagus | 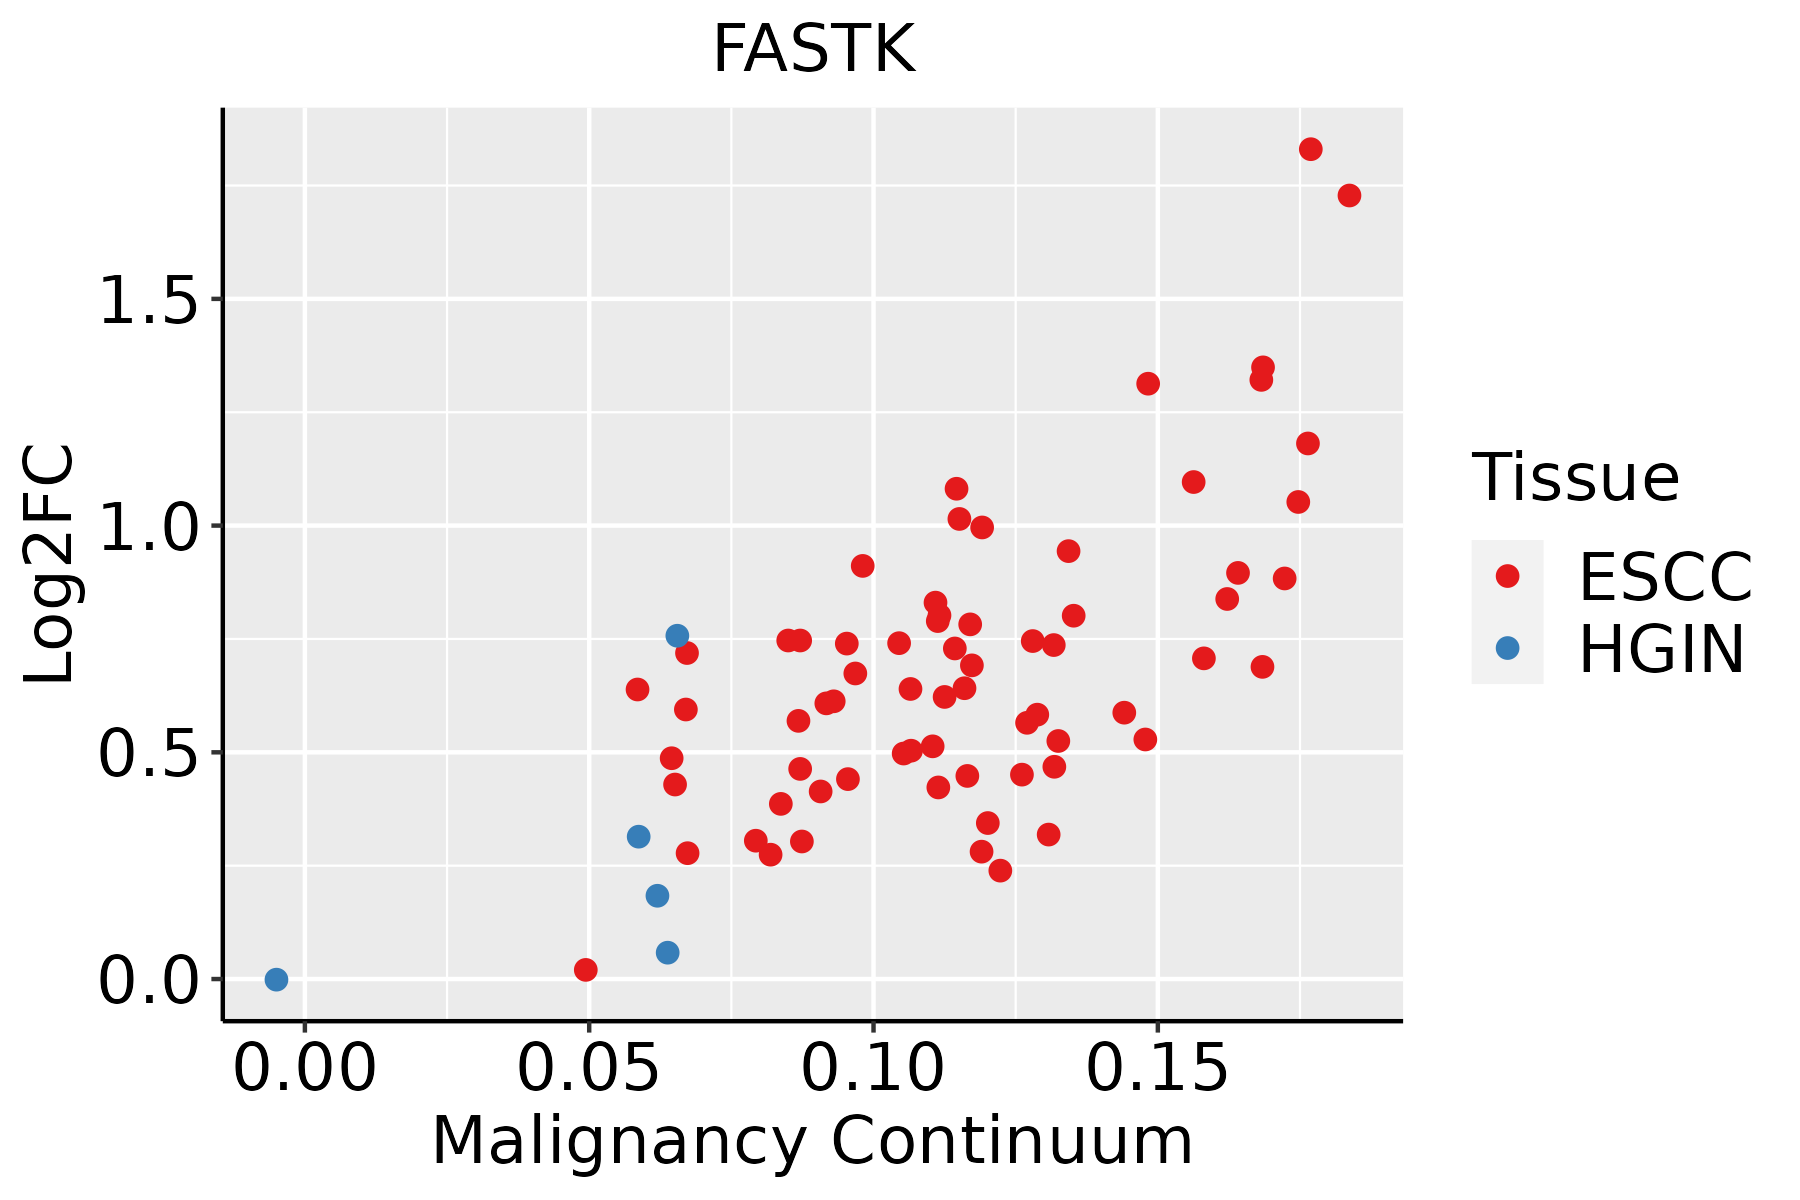 | ESCC: Esophageal squamous cell carcinoma |
| HGIN: High-grade intraepithelial neoplasias | ||
| LGIN: Low-grade intraepithelial neoplasias | ||
| Liver |  | HCC: Hepatocellular carcinoma |
| NAFLD: Non-alcoholic fatty liver disease | ||
| Oral Cavity | 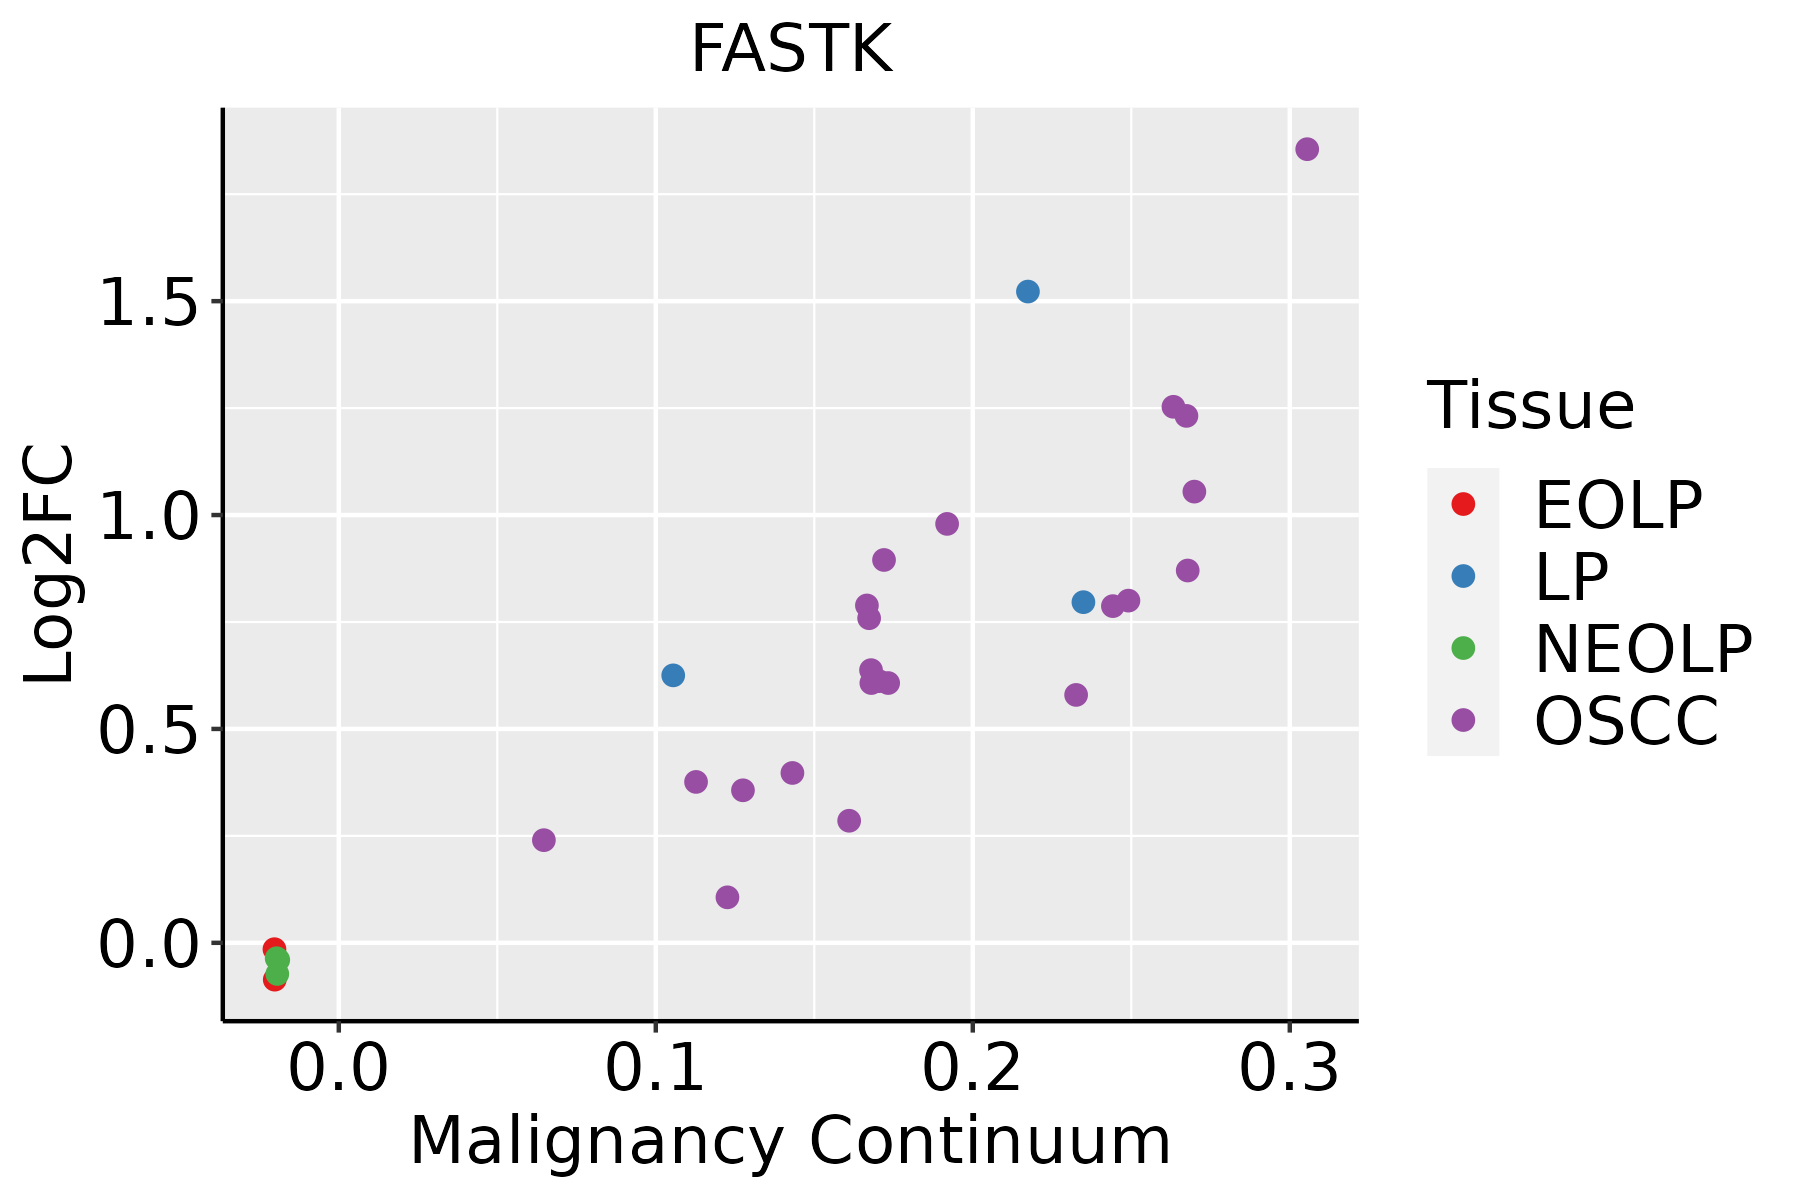 | EOLP: Erosive Oral lichen planus |
| LP: leukoplakia | ||
| NEOLP: Non-erosive oral lichen planus | ||
| OSCC: Oral squamous cell carcinoma | ||
| Skin |  | AK: Actinic keratosis |
| cSCC: Cutaneous squamous cell carcinoma | ||
| SCCIS:squamous cell carcinoma in situ | ||
| Thyroid | 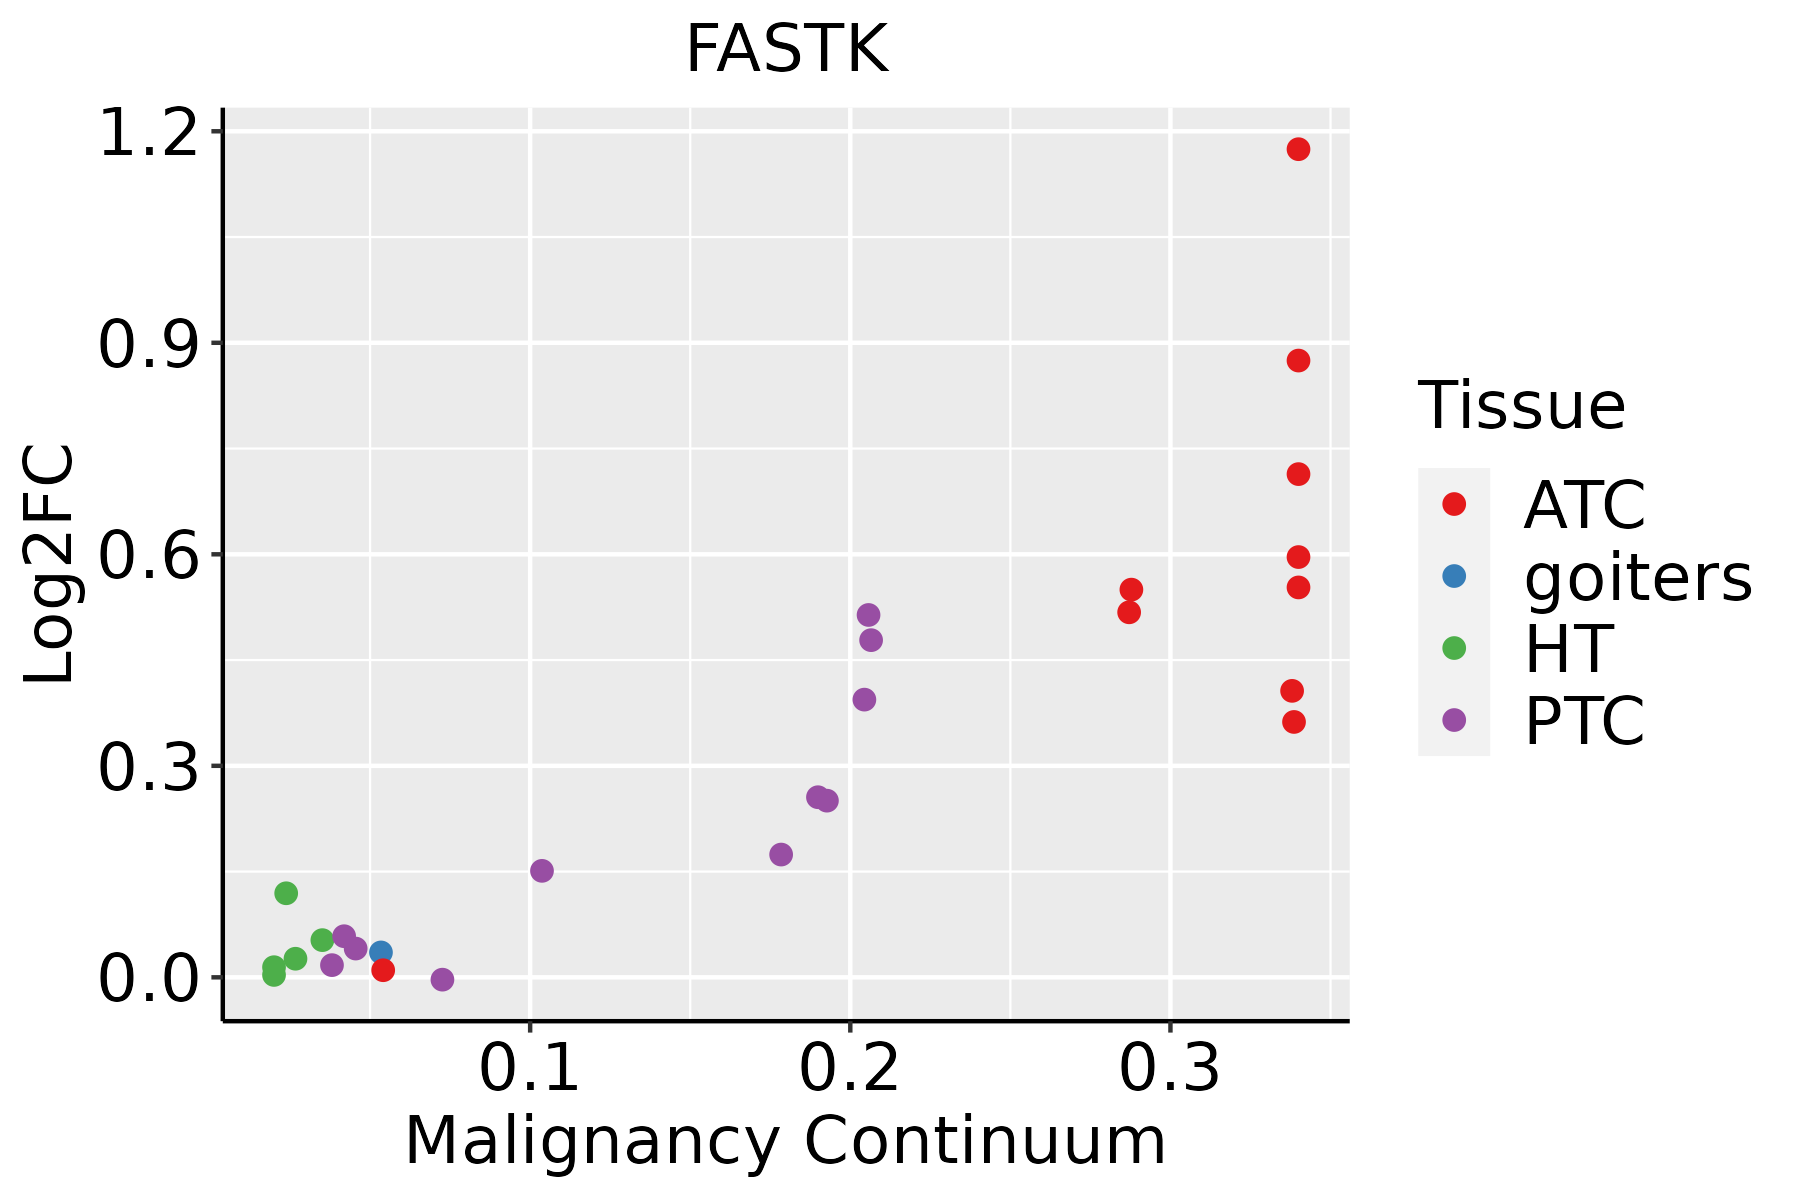 | ATC: Anaplastic thyroid cancer |
| HT: Hashimoto's thyroiditis | ||
| PTC: Papillary thyroid cancer |
| ∗log2FC in expression of this searched gene in stem-like cells from each diseased tissue sample relative to stem-like cells in normal samples in each tissue plotted against the malignancy continuum. Samples are colored based on if they are from different disease stage. |
Top |
Malignant transformation related pathway analysis |
| Find out the enriched GO biological processes and KEGG pathways involved in transition from healthy to precancer to cancer |
| Tissue | Disease Stage | Enriched GO biological Processes |
| Colorectum | AD |  |
| Colorectum | SER |  |
| Colorectum | MSS |  |
| Colorectum | MSI-H |  |
| Colorectum | FAP |  |
| ∗Top 15 enriched GO BP terms are showed in the bar plot of each disease state in each tissue. Each row represents a significant GO biological process which is colored according to the -log10(p.adjust). |
| Page: 1 2 3 4 5 6 7 8 9 |
| GO ID | Tissue | Disease Stage | Description | Gene Ratio | Bg Ratio | pvalue | p.adjust | Count |
| GO:0008380 | Colorectum | AD | RNA splicing | 169/3918 | 434/18723 | 3.59e-18 | 2.04e-15 | 169 |
| GO:1903311 | Colorectum | AD | regulation of mRNA metabolic process | 117/3918 | 288/18723 | 1.69e-14 | 4.23e-12 | 117 |
| GO:0043484 | Colorectum | AD | regulation of RNA splicing | 70/3918 | 148/18723 | 6.47e-13 | 1.16e-10 | 70 |
| GO:0006401 | Colorectum | AD | RNA catabolic process | 102/3918 | 278/18723 | 8.64e-10 | 6.76e-08 | 102 |
| GO:0044270 | Colorectum | AD | cellular nitrogen compound catabolic process | 147/3918 | 451/18723 | 3.35e-09 | 2.23e-07 | 147 |
| GO:0046700 | Colorectum | AD | heterocycle catabolic process | 145/3918 | 445/18723 | 4.37e-09 | 2.84e-07 | 145 |
| GO:0006402 | Colorectum | AD | mRNA catabolic process | 87/3918 | 232/18723 | 4.40e-09 | 2.84e-07 | 87 |
| GO:0034655 | Colorectum | AD | nucleobase-containing compound catabolic process | 133/3918 | 407/18723 | 1.56e-08 | 9.12e-07 | 133 |
| GO:0019439 | Colorectum | AD | aromatic compound catabolic process | 146/3918 | 467/18723 | 7.48e-08 | 3.84e-06 | 146 |
| GO:1901361 | Colorectum | AD | organic cyclic compound catabolic process | 153/3918 | 495/18723 | 8.23e-08 | 4.18e-06 | 153 |
| GO:0061013 | Colorectum | AD | regulation of mRNA catabolic process | 64/3918 | 166/18723 | 1.44e-07 | 6.59e-06 | 64 |
| GO:0043487 | Colorectum | AD | regulation of RNA stability | 63/3918 | 170/18723 | 9.17e-07 | 3.12e-05 | 63 |
| GO:0043488 | Colorectum | AD | regulation of mRNA stability | 59/3918 | 158/18723 | 1.50e-06 | 4.66e-05 | 59 |
| GO:00083801 | Colorectum | SER | RNA splicing | 123/2897 | 434/18723 | 3.84e-12 | 8.41e-10 | 123 |
| GO:00434841 | Colorectum | SER | regulation of RNA splicing | 49/2897 | 148/18723 | 7.02e-08 | 4.49e-06 | 49 |
| GO:19033111 | Colorectum | SER | regulation of mRNA metabolic process | 78/2897 | 288/18723 | 2.61e-07 | 1.43e-05 | 78 |
| GO:00442701 | Colorectum | SER | cellular nitrogen compound catabolic process | 99/2897 | 451/18723 | 1.46e-04 | 2.86e-03 | 99 |
| GO:00467001 | Colorectum | SER | heterocycle catabolic process | 97/2897 | 445/18723 | 2.20e-04 | 3.89e-03 | 97 |
| GO:19013611 | Colorectum | SER | organic cyclic compound catabolic process | 104/2897 | 495/18723 | 5.46e-04 | 7.63e-03 | 104 |
| GO:00346551 | Colorectum | SER | nucleobase-containing compound catabolic process | 88/2897 | 407/18723 | 5.53e-04 | 7.71e-03 | 88 |
| Page: 1 2 3 4 5 6 7 8 9 10 11 12 13 14 15 |
| Pathway ID | Tissue | Disease Stage | Description | Gene Ratio | Bg Ratio | pvalue | p.adjust | qvalue | Count |
| Page: 1 |
Top |
Cell-cell communication analysis |
| Identification of potential cell-cell interactions between two cell types and their ligand-receptor pairs for different disease states |
| Ligand | Receptor | LRpair | Pathway | Tissue | Disease Stage |
| Page: 1 |
Top |
Single-cell gene regulatory network inference analysis |
| Find out the significant the regulons (TFs) and the target genes of each regulon across cell types for different disease states |
| TF | Cell Type | Tissue | Disease Stage | Target Gene | RSS | Regulon Activity |
| ∗The dot plots of a searched regulon are shown for all cell subpopulations in each disease state of each tissue based on the regulon specific score inferred using pySCENIC and by calculating the average expression. |
| Page: 1 |
Top |
Somatic mutation of malignant transformation related genes |
| Annotation of somatic variants for genes involved in malignant transformation |
| Hugo Symbol | Variant Class | Variant Classification | dbSNP RS | HGVSc | HGVSp | HGVSp Short | SWISSPROT | BIOTYPE | SIFT | PolyPhen | Tumor Sample Barcode | Tissue | Histology | Sex | Age | Stage | Therapy Types | Drugs | Outcome |
| FASTK | SNV | Missense_Mutation | novel | c.1490C>G | p.Ser497Trp | p.S497W | Q14296 | protein_coding | deleterious(0) | probably_damaging(1) | TCGA-C8-A138-01 | Breast | breast invasive carcinoma | Female | <65 | III/IV | Unknown | Unknown | SD |
| FASTK | SNV | Missense_Mutation | c.1298N>A | p.Leu433Gln | p.L433Q | Q14296 | protein_coding | deleterious(0.02) | probably_damaging(0.977) | TCGA-E9-A1ND-01 | Breast | breast invasive carcinoma | Female | >=65 | I/II | Hormone Therapy | aromasin | SD | |
| FASTK | SNV | Missense_Mutation | novel | c.94C>T | p.Pro32Ser | p.P32S | Q14296 | protein_coding | tolerated_low_confidence(0.1) | benign(0.011) | TCGA-2W-A8YY-01 | Cervix | cervical & endocervical cancer | Female | <65 | I/II | Chemotherapy | cisplatin | CR |
| FASTK | SNV | Missense_Mutation | rs374560885 | c.1541N>T | p.Pro514Leu | p.P514L | Q14296 | protein_coding | tolerated(0.05) | benign(0.007) | TCGA-JW-A5VI-01 | Cervix | cervical & endocervical cancer | Female | <65 | I/II | Chemotherapy | topotecan | PD |
| FASTK | SNV | Missense_Mutation | rs774195132 | c.1627N>T | p.Arg543Cys | p.R543C | Q14296 | protein_coding | tolerated_low_confidence(0.25) | benign(0) | TCGA-A6-5657-01 | Colorectum | colon adenocarcinoma | Male | >=65 | III/IV | Ancillary | leucovorin | SD |
| FASTK | SNV | Missense_Mutation | novel | c.1229N>A | p.Arg410His | p.R410H | Q14296 | protein_coding | tolerated(0.18) | benign(0.086) | TCGA-AZ-4315-01 | Colorectum | colon adenocarcinoma | Male | <65 | I/II | Unknown | Unknown | SD |
| FASTK | SNV | Missense_Mutation | c.328N>T | p.Arg110Cys | p.R110C | Q14296 | protein_coding | tolerated_low_confidence(0.22) | benign(0) | TCGA-CK-4951-01 | Colorectum | colon adenocarcinoma | Female | >=65 | I/II | Unknown | Unknown | PD | |
| FASTK | deletion | In_Frame_Del | novel | c.456_458delCTT | p.Phe153del | p.F153del | Q14296 | protein_coding | TCGA-5M-AAT4-01 | Colorectum | colon adenocarcinoma | Male | >=65 | III/IV | Unknown | Unknown | PD | ||
| FASTK | deletion | Frame_Shift_Del | c.1224delN | p.Leu409CysfsTer14 | p.L409Cfs*14 | Q14296 | protein_coding | TCGA-CK-5916-01 | Colorectum | colon adenocarcinoma | Female | >=65 | I/II | Unknown | Unknown | PD | |||
| FASTK | SNV | Missense_Mutation | novel | c.1411C>G | p.Arg471Gly | p.R471G | Q14296 | protein_coding | tolerated(0.39) | benign(0) | TCGA-2E-A9G8-01 | Endometrium | uterine corpus endometrioid carcinoma | Female | <65 | III/IV | Chemotherapy | taxol | CR |
| Page: 1 2 3 4 5 |
Top |
Related drugs of malignant transformation related genes |
| Identification of chemicals and drugs interact with genes involved in malignant transfromation |
| (DGIdb 4.0) |
| Entrez ID | Symbol | Category | Interaction Types | Drug Claim Name | Drug Name | PMIDs |
| Page: 1 |

Copyright 2023-Present -The University of Texas Health Science Center at Houston |