
|
|||||
|
 | |
| |
| |
| |
| |
| |
|
Gene: FASN |
Gene summary for FASN |
| Gene information | Species | Human | Gene symbol | FASN | Gene ID | 2194 |
| Gene name | fatty acid synthase | |
| Gene Alias | FAS | |
| Cytomap | 17q25.3 | |
| Gene Type | protein-coding | GO ID | GO:0001503 | UniProtAcc | P49327 |
Top |
Malignant transformation analysis |
| Identification of the aberrant gene expression in precancerous and cancerous lesions by comparing the gene expression of stem-like cells in diseased tissues with normal stem cells |
| Entrez ID | Symbol | Replicates | Species | Organ | Tissue | Adj P-value | Log2FC | Malignancy |
| 2194 | FASN | GSM4909290 | Human | Breast | IDC | 4.20e-15 | 5.86e-01 | 0.2096 |
| 2194 | FASN | GSM4909291 | Human | Breast | IDC | 2.23e-03 | 4.39e-01 | 0.1753 |
| 2194 | FASN | GSM4909293 | Human | Breast | IDC | 3.49e-14 | 3.29e-01 | 0.1581 |
| 2194 | FASN | GSM4909298 | Human | Breast | IDC | 1.43e-21 | 4.53e-01 | 0.1551 |
| 2194 | FASN | GSM4909301 | Human | Breast | IDC | 1.66e-10 | 4.91e-01 | 0.1577 |
| 2194 | FASN | GSM4909302 | Human | Breast | IDC | 2.06e-67 | 1.30e+00 | 0.1545 |
| 2194 | FASN | GSM4909303 | Human | Breast | IDC | 1.25e-16 | 1.02e+00 | 0.0438 |
| 2194 | FASN | GSM4909304 | Human | Breast | IDC | 6.59e-65 | 1.10e+00 | 0.1636 |
| 2194 | FASN | GSM4909311 | Human | Breast | IDC | 7.18e-09 | 4.89e-02 | 0.1534 |
| 2194 | FASN | GSM4909317 | Human | Breast | IDC | 4.72e-14 | 5.98e-01 | 0.1355 |
| 2194 | FASN | GSM4909319 | Human | Breast | IDC | 1.20e-17 | 1.43e-01 | 0.1563 |
| 2194 | FASN | ctrl6 | Human | Breast | Precancer | 1.79e-02 | -3.03e-01 | -0.0061 |
| 2194 | FASN | M1 | Human | Breast | IDC | 1.33e-06 | 4.62e-01 | 0.1577 |
| 2194 | FASN | M5 | Human | Breast | IDC | 3.45e-02 | 6.75e-01 | 0.1598 |
| 2194 | FASN | NCCBC11 | Human | Breast | DCIS | 1.52e-19 | 1.18e+00 | 0.1232 |
| 2194 | FASN | P2 | Human | Breast | IDC | 4.72e-11 | 7.30e-01 | 0.21 |
| 2194 | FASN | DCIS2 | Human | Breast | DCIS | 1.49e-26 | -8.49e-02 | 0.0085 |
| 2194 | FASN | HTA11_3410_2000001011 | Human | Colorectum | AD | 8.29e-05 | 1.42e-01 | 0.0155 |
| 2194 | FASN | HTA11_2487_2000001011 | Human | Colorectum | SER | 5.95e-04 | 2.64e-01 | -0.1808 |
| 2194 | FASN | HTA11_78_2000001011 | Human | Colorectum | AD | 3.22e-02 | 1.85e-01 | -0.1088 |
| Page: 1 2 3 4 5 6 7 8 |
| Tissue | Expression Dynamics | Abbreviation |
| Breast | 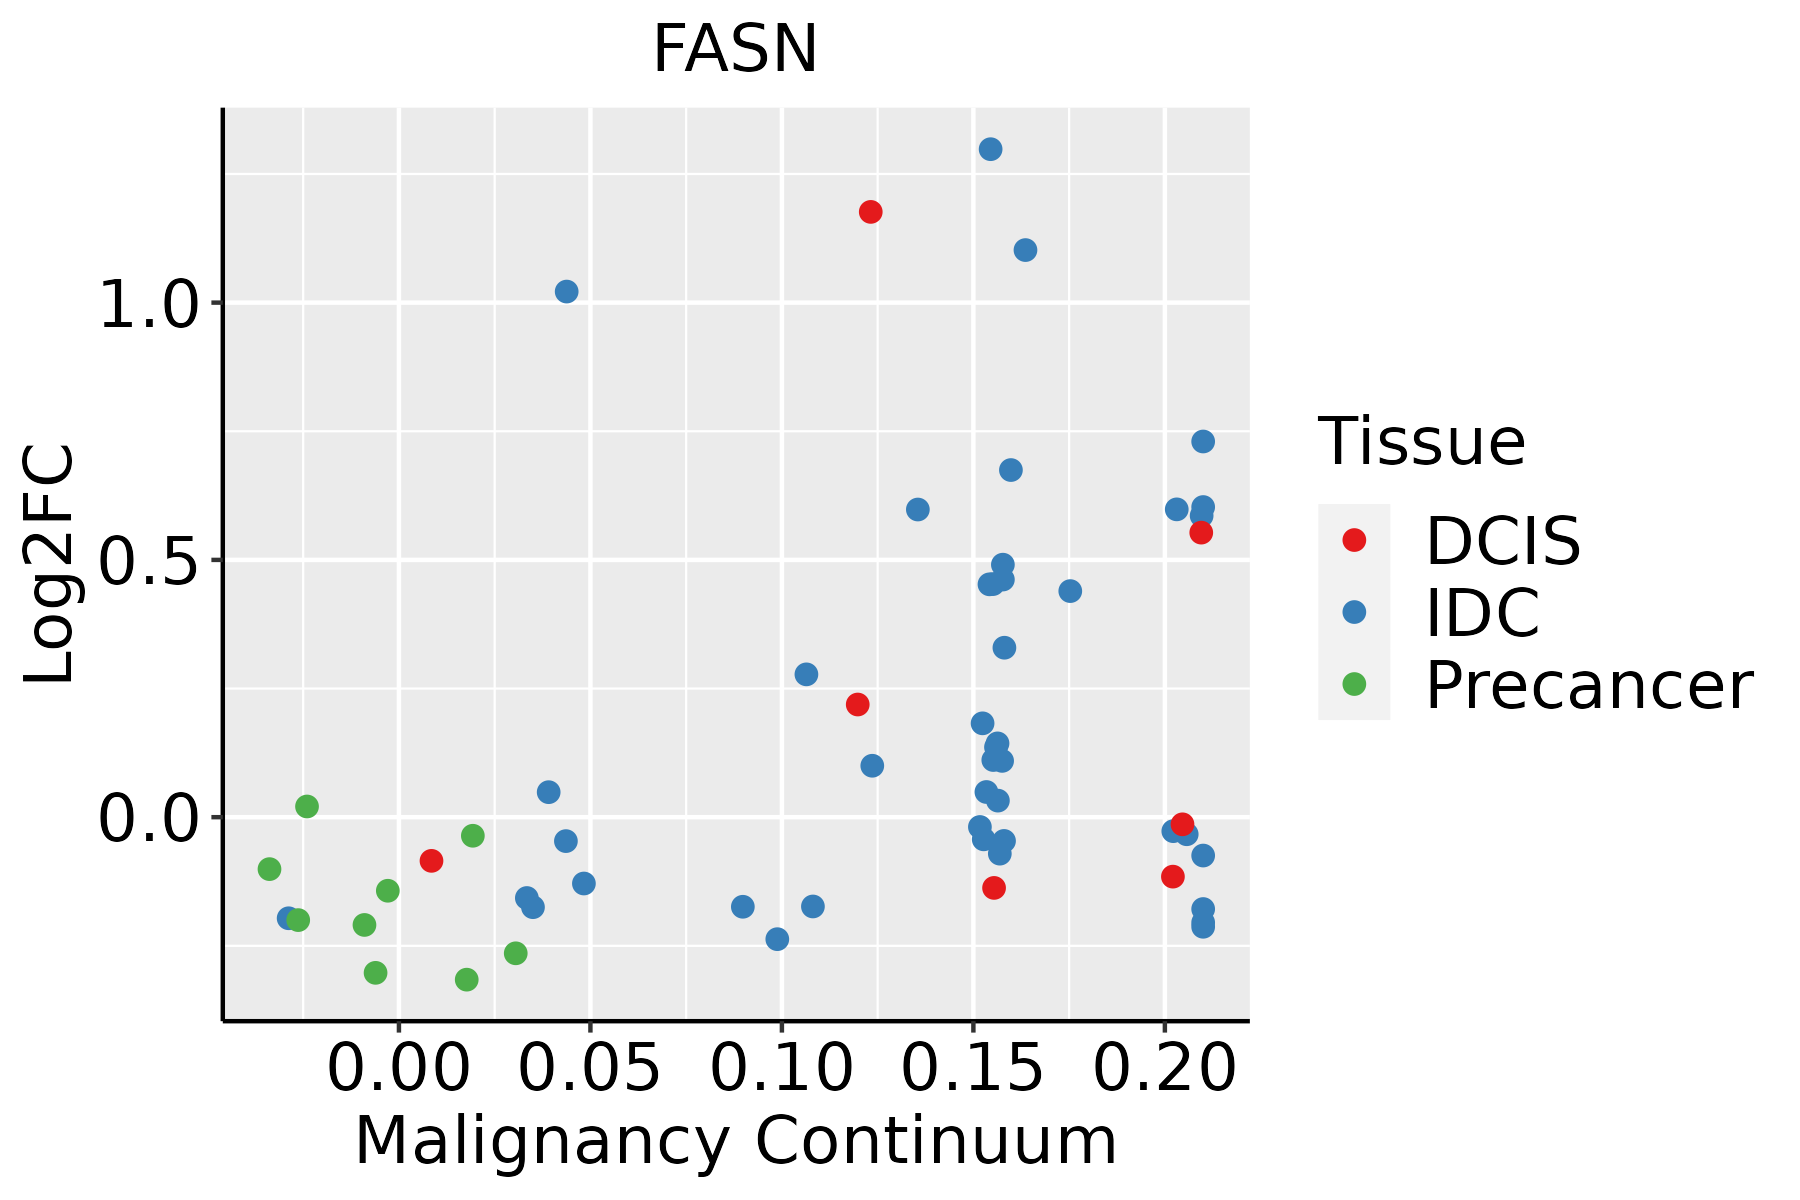 | IDC: Invasive ductal carcinoma |
| DCIS: Ductal carcinoma in situ | ||
| Precancer(BRCA1-mut): Precancerous lesion from BRCA1 mutation carriers | ||
| Colorectum (GSE201348) |  | FAP: Familial adenomatous polyposis |
| CRC: Colorectal cancer | ||
| Colorectum (HTA11) |  | AD: Adenomas |
| SER: Sessile serrated lesions | ||
| MSI-H: Microsatellite-high colorectal cancer | ||
| MSS: Microsatellite stable colorectal cancer | ||
| Esophagus | 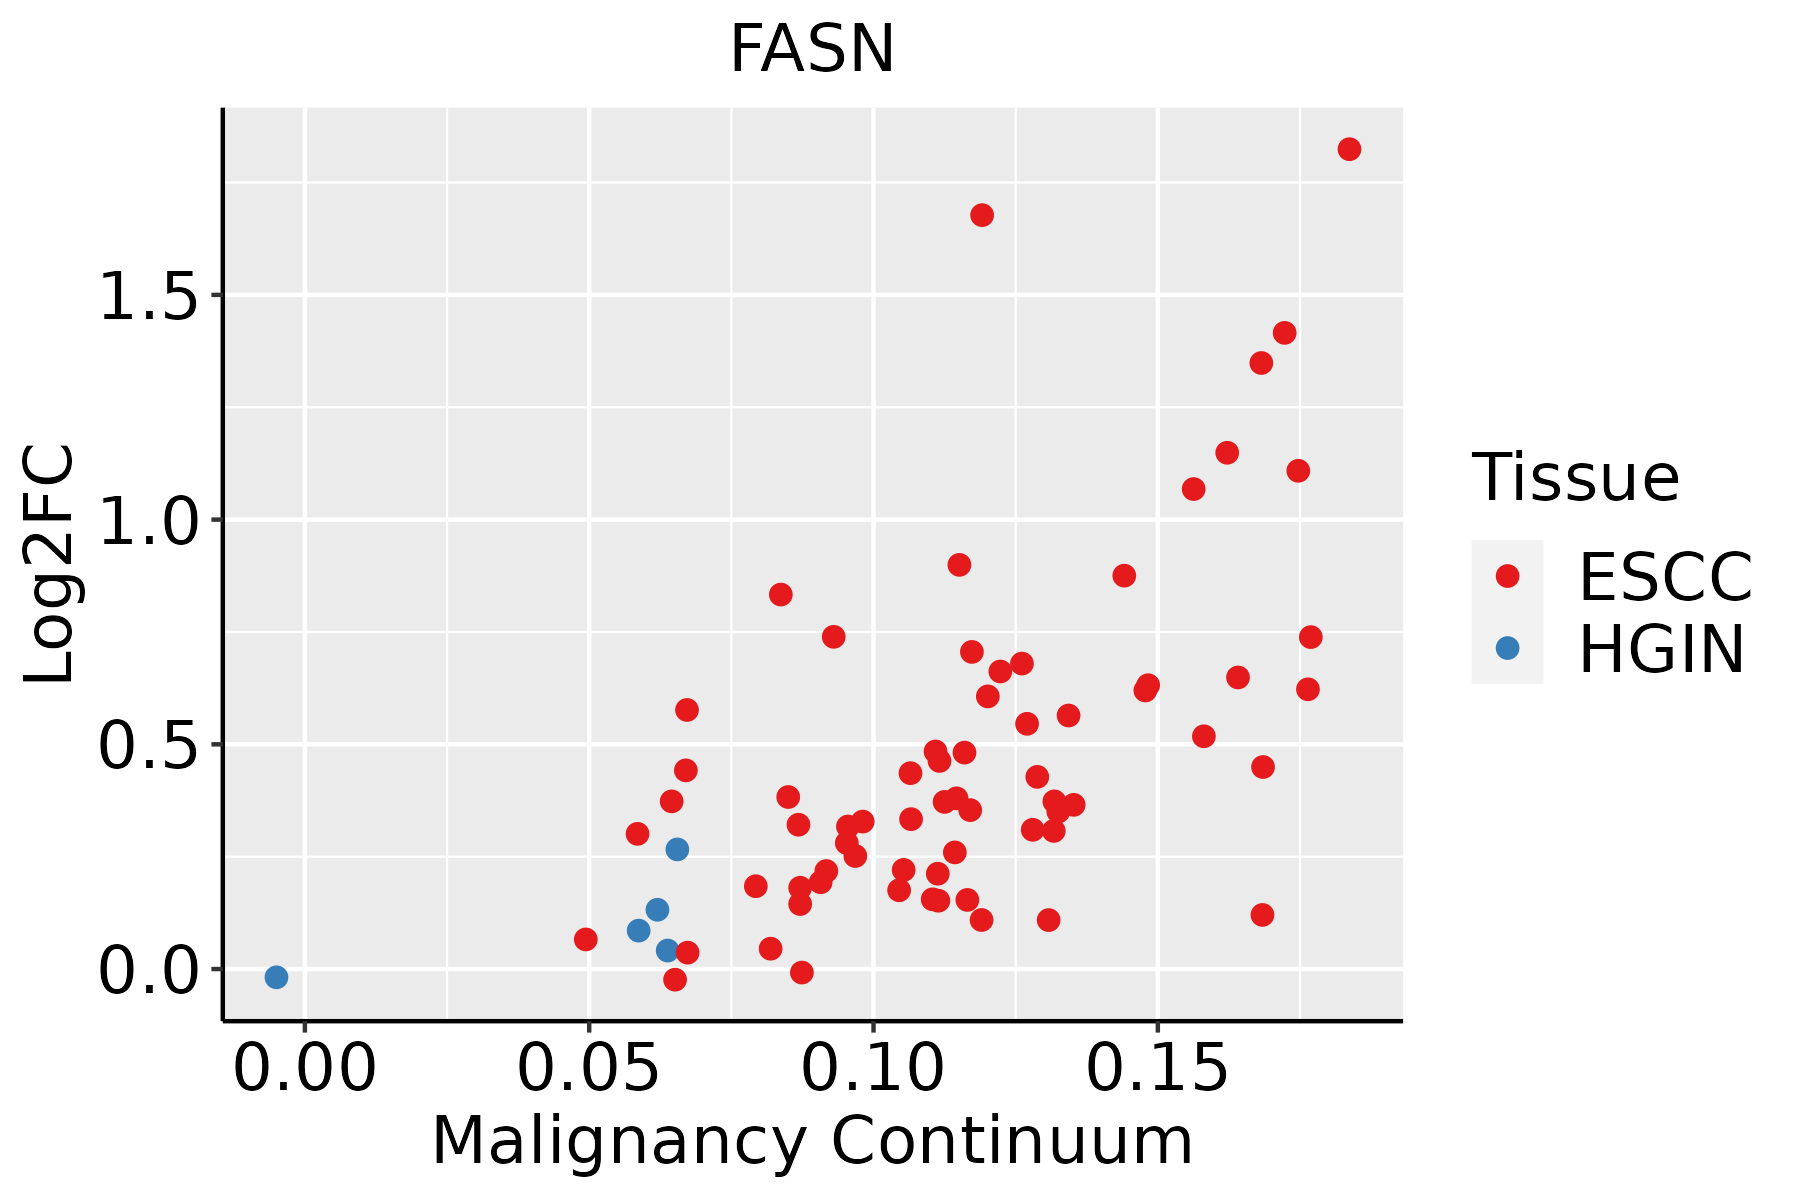 | ESCC: Esophageal squamous cell carcinoma |
| HGIN: High-grade intraepithelial neoplasias | ||
| LGIN: Low-grade intraepithelial neoplasias | ||
| Liver | 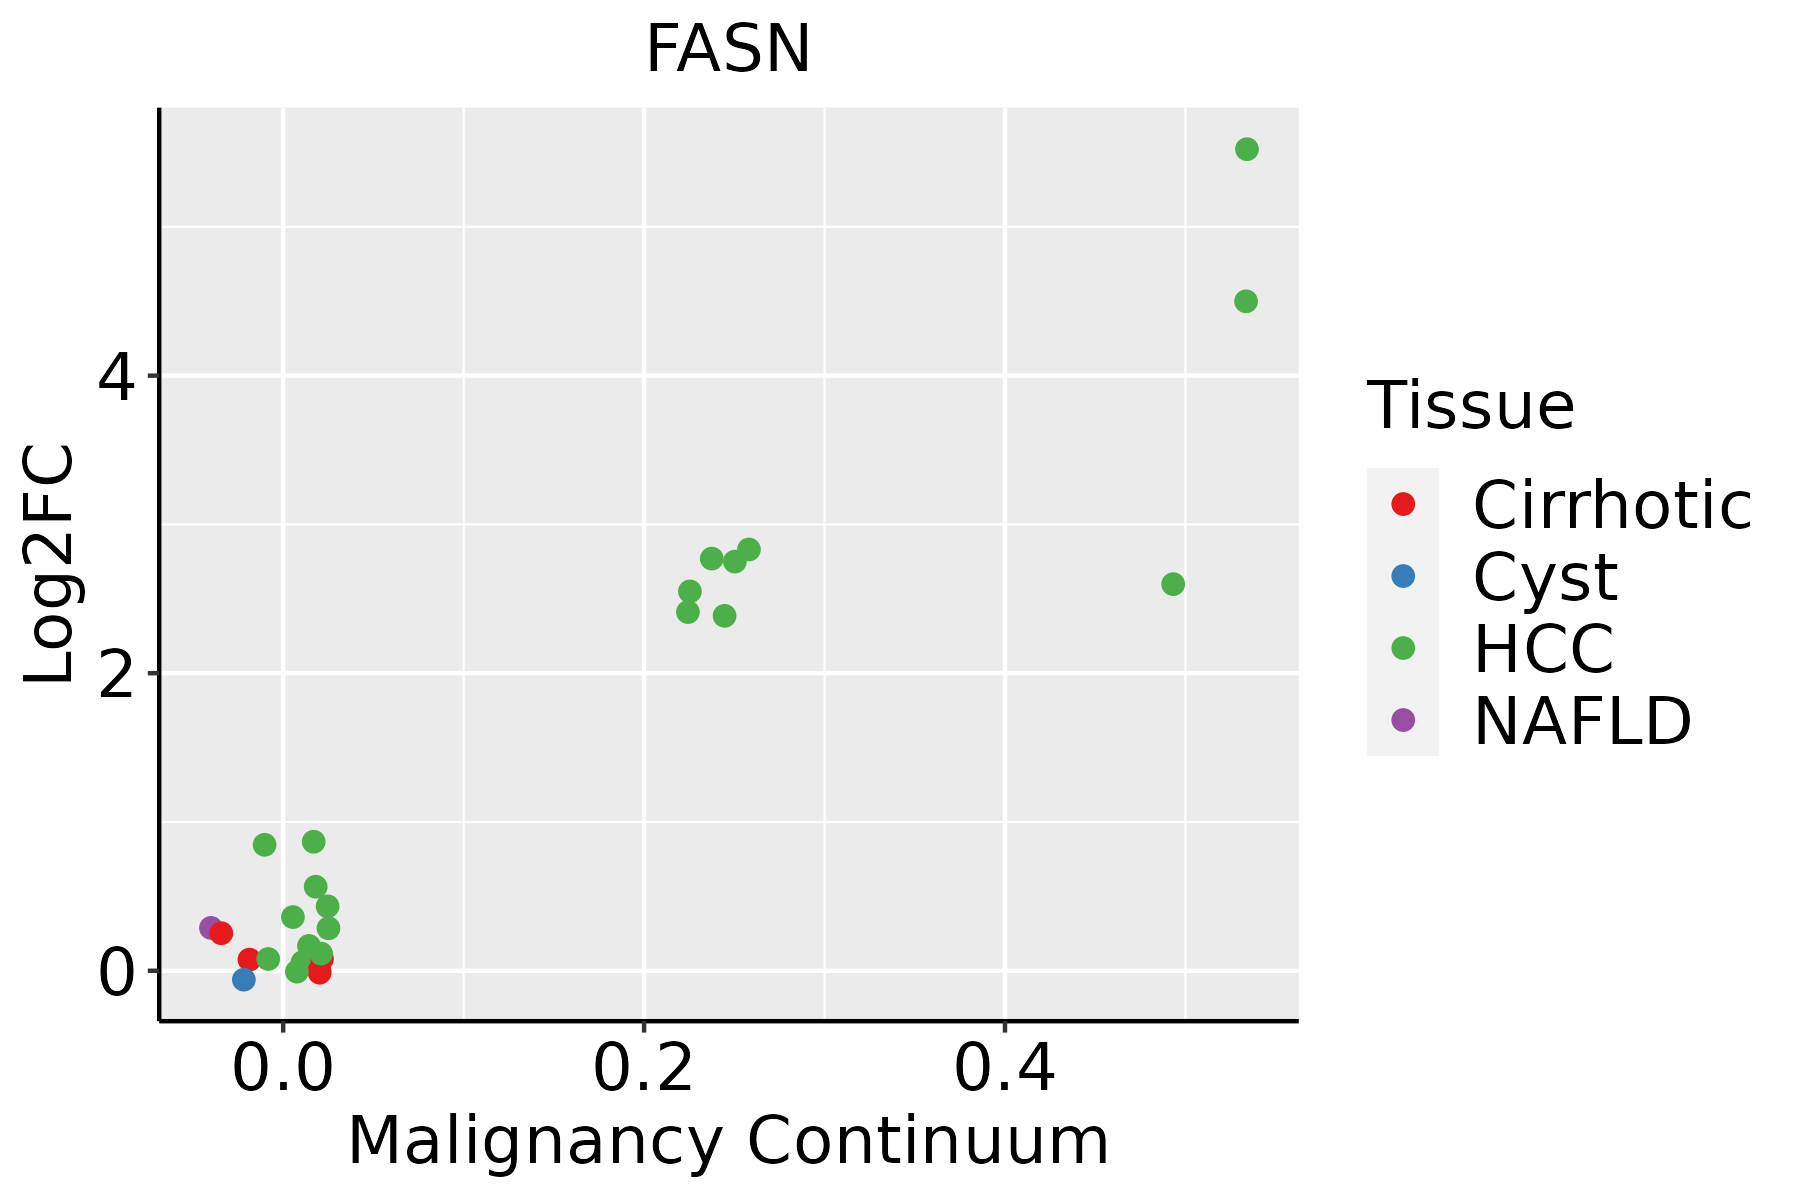 | HCC: Hepatocellular carcinoma |
| NAFLD: Non-alcoholic fatty liver disease | ||
| Lung | 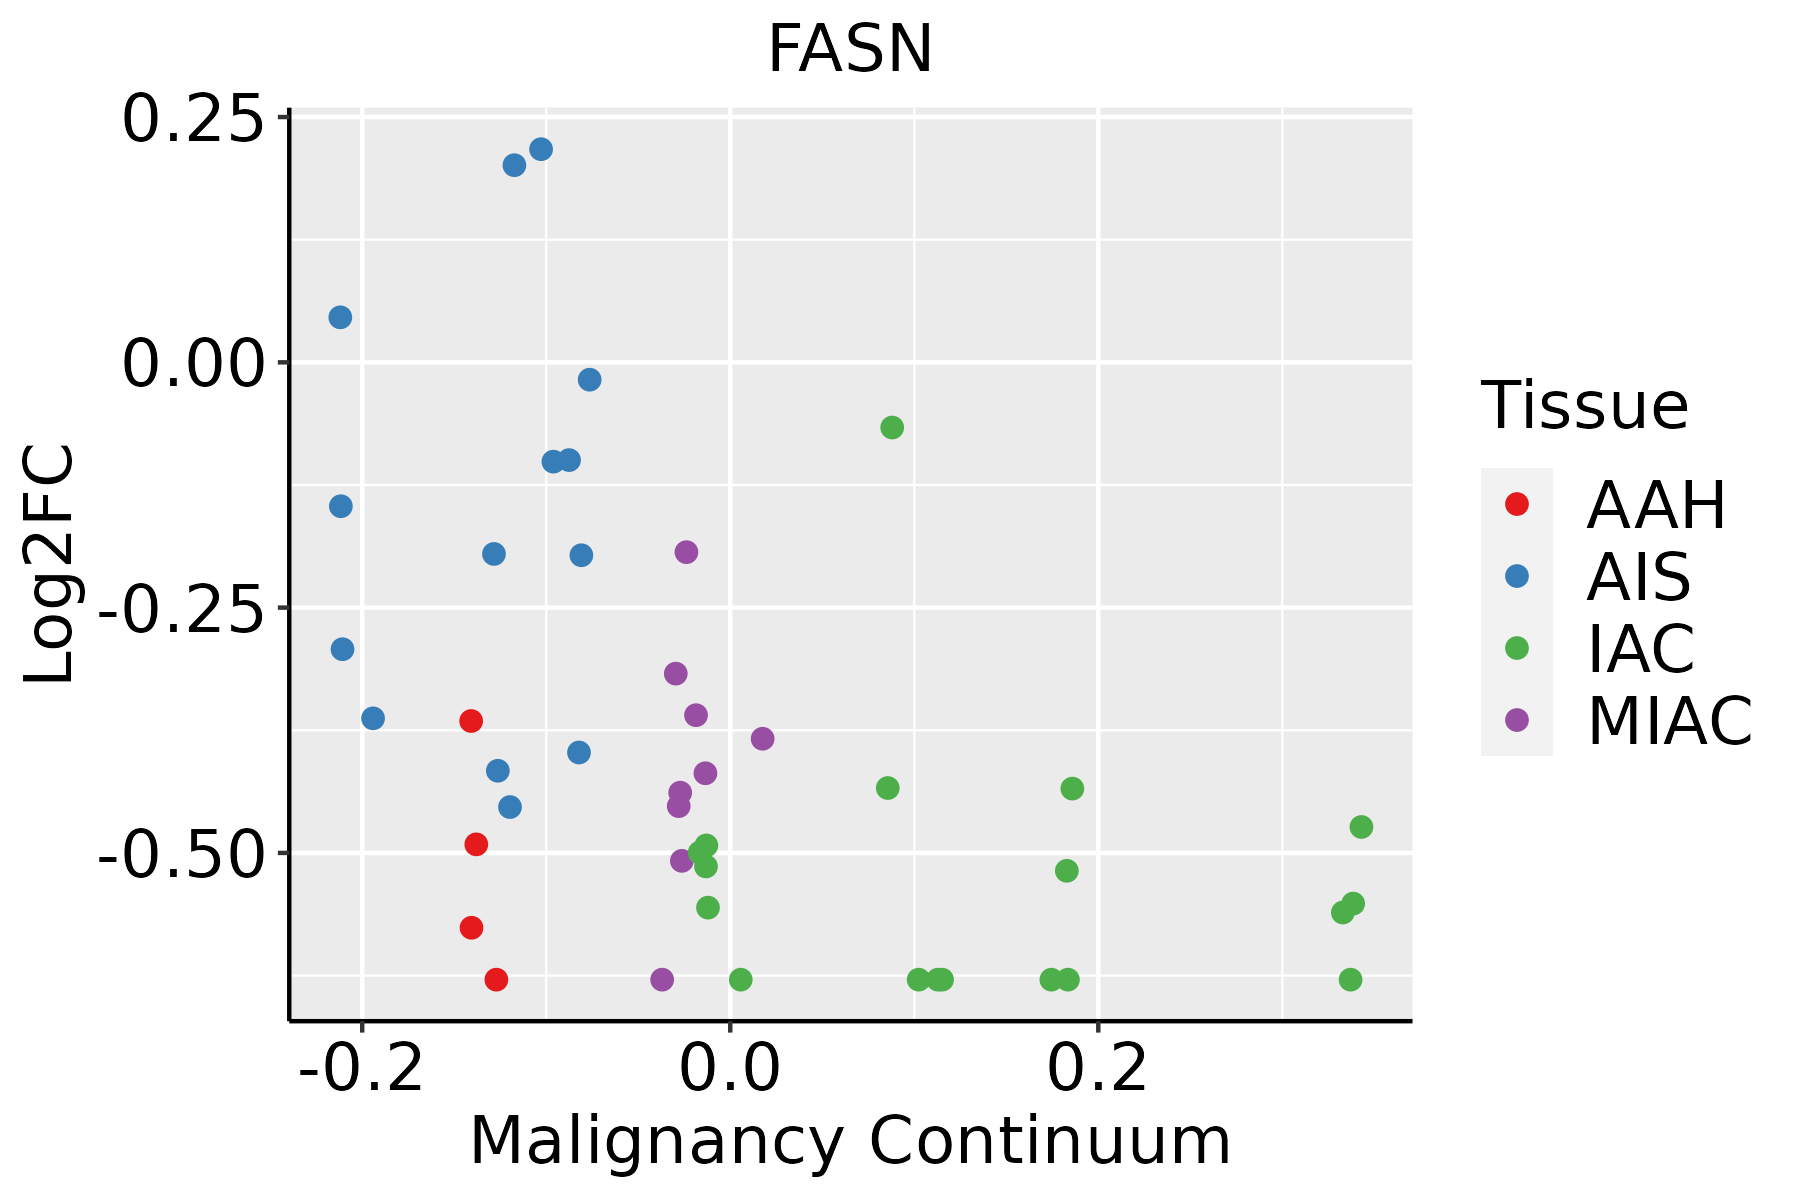 | AAH: Atypical adenomatous hyperplasia |
| AIS: Adenocarcinoma in situ | ||
| IAC: Invasive lung adenocarcinoma | ||
| MIA: Minimally invasive adenocarcinoma | ||
| Oral Cavity |  | EOLP: Erosive Oral lichen planus |
| LP: leukoplakia | ||
| NEOLP: Non-erosive oral lichen planus | ||
| OSCC: Oral squamous cell carcinoma | ||
| Prostate |  | BPH: Benign Prostatic Hyperplasia |
| Skin |  | AK: Actinic keratosis |
| cSCC: Cutaneous squamous cell carcinoma | ||
| SCCIS:squamous cell carcinoma in situ | ||
| Thyroid | 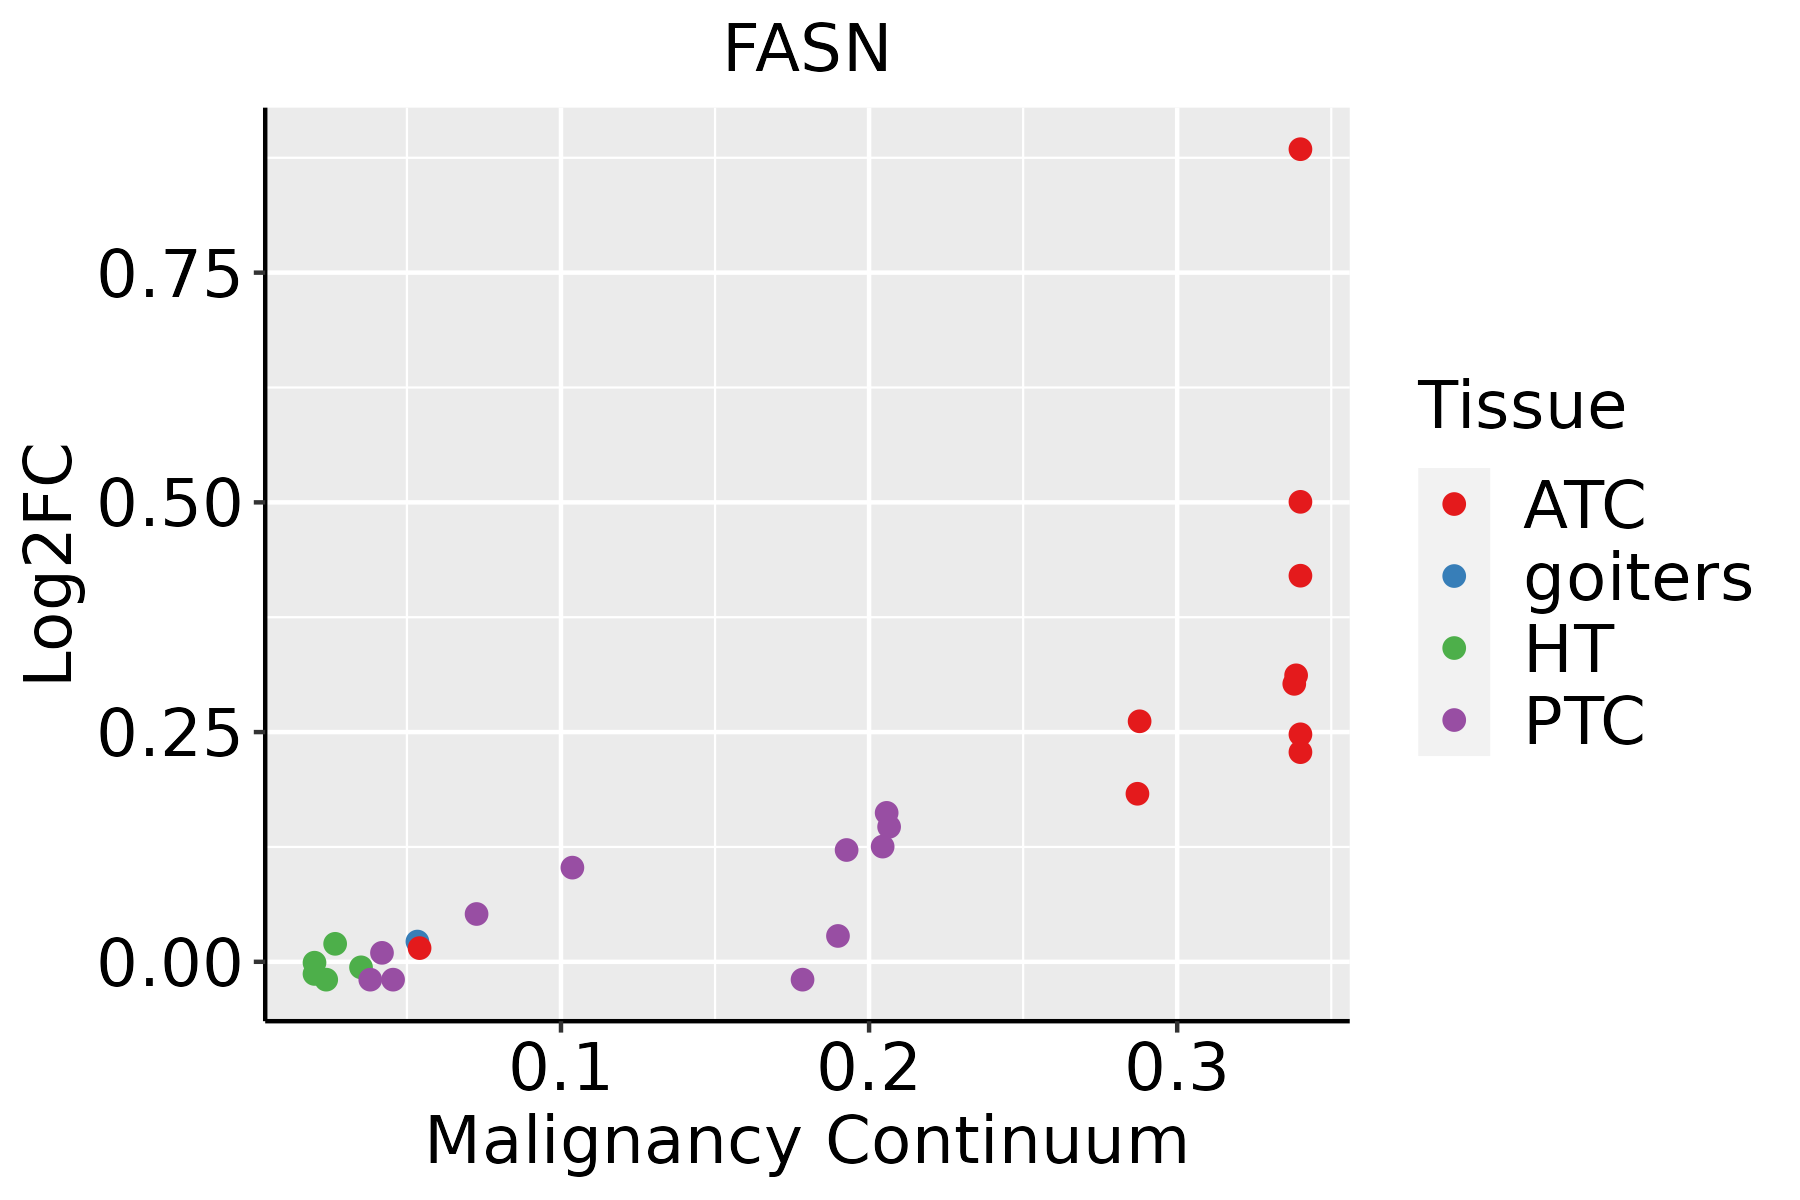 | ATC: Anaplastic thyroid cancer |
| HT: Hashimoto's thyroiditis | ||
| PTC: Papillary thyroid cancer |
| ∗log2FC in expression of this searched gene in stem-like cells from each diseased tissue sample relative to stem-like cells in normal samples in each tissue plotted against the malignancy continuum. Samples are colored based on if they are from different disease stage. |
Top |
Malignant transformation related pathway analysis |
| Find out the enriched GO biological processes and KEGG pathways involved in transition from healthy to precancer to cancer |
| Tissue | Disease Stage | Enriched GO biological Processes |
| Colorectum | AD |  |
| Colorectum | SER |  |
| Colorectum | MSS |  |
| Colorectum | MSI-H |  |
| Colorectum | FAP |  |
| ∗Top 15 enriched GO BP terms are showed in the bar plot of each disease state in each tissue. Each row represents a significant GO biological process which is colored according to the -log10(p.adjust). |
| Page: 1 2 3 4 5 6 7 8 9 |
| GO ID | Tissue | Disease Stage | Description | Gene Ratio | Bg Ratio | pvalue | p.adjust | Count |
| GO:00196938 | Breast | Precancer | ribose phosphate metabolic process | 49/1080 | 396/18723 | 3.81e-07 | 1.78e-05 | 49 |
| GO:00091509 | Breast | Precancer | purine ribonucleotide metabolic process | 46/1080 | 368/18723 | 6.47e-07 | 2.71e-05 | 46 |
| GO:00091179 | Breast | Precancer | nucleotide metabolic process | 56/1080 | 489/18723 | 7.40e-07 | 3.00e-05 | 56 |
| GO:00092598 | Breast | Precancer | ribonucleotide metabolic process | 47/1080 | 385/18723 | 9.69e-07 | 3.84e-05 | 47 |
| GO:00067539 | Breast | Precancer | nucleoside phosphate metabolic process | 56/1080 | 497/18723 | 1.24e-06 | 4.70e-05 | 56 |
| GO:00061639 | Breast | Precancer | purine nucleotide metabolic process | 47/1080 | 396/18723 | 2.14e-06 | 7.50e-05 | 47 |
| GO:00300999 | Breast | Precancer | myeloid cell differentiation | 45/1080 | 381/18723 | 4.00e-06 | 1.25e-04 | 45 |
| GO:00487329 | Breast | Precancer | gland development | 49/1080 | 436/18723 | 6.11e-06 | 1.73e-04 | 49 |
| GO:00725219 | Breast | Precancer | purine-containing compound metabolic process | 47/1080 | 416/18723 | 8.19e-06 | 2.20e-04 | 47 |
| GO:00025737 | Breast | Precancer | myeloid leukocyte differentiation | 27/1080 | 208/18723 | 6.72e-05 | 1.35e-03 | 27 |
| GO:00302248 | Breast | Precancer | monocyte differentiation | 9/1080 | 36/18723 | 1.56e-04 | 2.66e-03 | 9 |
| GO:19031313 | Breast | Precancer | mononuclear cell differentiation | 43/1080 | 426/18723 | 2.61e-04 | 3.84e-03 | 43 |
| GO:00016496 | Breast | Precancer | osteoblast differentiation | 27/1080 | 229/18723 | 3.35e-04 | 4.73e-03 | 27 |
| GO:00463946 | Breast | Precancer | carboxylic acid biosynthetic process | 32/1080 | 314/18723 | 1.30e-03 | 1.38e-02 | 32 |
| GO:00723304 | Breast | Precancer | monocarboxylic acid biosynthetic process | 24/1080 | 214/18723 | 1.41e-03 | 1.48e-02 | 24 |
| GO:00160536 | Breast | Precancer | organic acid biosynthetic process | 32/1080 | 316/18723 | 1.44e-03 | 1.50e-02 | 32 |
| GO:00066335 | Breast | Precancer | fatty acid biosynthetic process | 19/1080 | 163/18723 | 2.74e-03 | 2.42e-02 | 19 |
| GO:00020649 | Breast | Precancer | epithelial cell development | 23/1080 | 220/18723 | 4.28e-03 | 3.35e-02 | 23 |
| GO:00308796 | Breast | Precancer | mammary gland development | 16/1080 | 137/18723 | 5.59e-03 | 4.07e-02 | 16 |
| GO:00015036 | Breast | Precancer | ossification | 36/1080 | 408/18723 | 7.53e-03 | 4.98e-02 | 36 |
| Page: 1 2 3 4 5 6 7 8 9 10 11 12 13 14 15 16 17 18 19 20 |
| Pathway ID | Tissue | Disease Stage | Description | Gene Ratio | Bg Ratio | pvalue | p.adjust | qvalue | Count |
| hsa04152 | Colorectum | AD | AMPK signaling pathway | 47/2092 | 121/8465 | 3.74e-04 | 2.82e-03 | 1.80e-03 | 47 |
| hsa041521 | Colorectum | AD | AMPK signaling pathway | 47/2092 | 121/8465 | 3.74e-04 | 2.82e-03 | 1.80e-03 | 47 |
| hsa041522 | Colorectum | MSS | AMPK signaling pathway | 41/1875 | 121/8465 | 1.91e-03 | 9.83e-03 | 6.03e-03 | 41 |
| hsa04910 | Colorectum | MSS | Insulin signaling pathway | 43/1875 | 137/8465 | 7.37e-03 | 2.84e-02 | 1.74e-02 | 43 |
| hsa041523 | Colorectum | MSS | AMPK signaling pathway | 41/1875 | 121/8465 | 1.91e-03 | 9.83e-03 | 6.03e-03 | 41 |
| hsa049101 | Colorectum | MSS | Insulin signaling pathway | 43/1875 | 137/8465 | 7.37e-03 | 2.84e-02 | 1.74e-02 | 43 |
| hsa0415210 | Esophagus | ESCC | AMPK signaling pathway | 80/4205 | 121/8465 | 1.73e-04 | 6.67e-04 | 3.42e-04 | 80 |
| hsa049109 | Esophagus | ESCC | Insulin signaling pathway | 89/4205 | 137/8465 | 1.97e-04 | 7.32e-04 | 3.75e-04 | 89 |
| hsa012129 | Esophagus | ESCC | Fatty acid metabolism | 41/4205 | 57/8465 | 5.13e-04 | 1.75e-03 | 8.98e-04 | 41 |
| hsa0415213 | Esophagus | ESCC | AMPK signaling pathway | 80/4205 | 121/8465 | 1.73e-04 | 6.67e-04 | 3.42e-04 | 80 |
| hsa0491014 | Esophagus | ESCC | Insulin signaling pathway | 89/4205 | 137/8465 | 1.97e-04 | 7.32e-04 | 3.75e-04 | 89 |
| hsa0121214 | Esophagus | ESCC | Fatty acid metabolism | 41/4205 | 57/8465 | 5.13e-04 | 1.75e-03 | 8.98e-04 | 41 |
| hsa0491041 | Liver | HCC | Insulin signaling pathway | 95/4020 | 137/8465 | 1.53e-07 | 1.97e-06 | 1.10e-06 | 95 |
| hsa049362 | Liver | HCC | Alcoholic liver disease | 89/4020 | 142/8465 | 1.73e-04 | 8.53e-04 | 4.75e-04 | 89 |
| hsa0415241 | Liver | HCC | AMPK signaling pathway | 77/4020 | 121/8465 | 2.32e-04 | 1.11e-03 | 6.18e-04 | 77 |
| hsa0491051 | Liver | HCC | Insulin signaling pathway | 95/4020 | 137/8465 | 1.53e-07 | 1.97e-06 | 1.10e-06 | 95 |
| hsa049363 | Liver | HCC | Alcoholic liver disease | 89/4020 | 142/8465 | 1.73e-04 | 8.53e-04 | 4.75e-04 | 89 |
| hsa0415251 | Liver | HCC | AMPK signaling pathway | 77/4020 | 121/8465 | 2.32e-04 | 1.11e-03 | 6.18e-04 | 77 |
| hsa049364 | Lung | IAC | Alcoholic liver disease | 29/1053 | 142/8465 | 4.45e-03 | 2.07e-02 | 1.37e-02 | 29 |
| hsa0493611 | Lung | IAC | Alcoholic liver disease | 29/1053 | 142/8465 | 4.45e-03 | 2.07e-02 | 1.37e-02 | 29 |
| Page: 1 2 |
Top |
Cell-cell communication analysis |
| Identification of potential cell-cell interactions between two cell types and their ligand-receptor pairs for different disease states |
| Ligand | Receptor | LRpair | Pathway | Tissue | Disease Stage |
| Page: 1 |
Top |
Single-cell gene regulatory network inference analysis |
| Find out the significant the regulons (TFs) and the target genes of each regulon across cell types for different disease states |
| TF | Cell Type | Tissue | Disease Stage | Target Gene | RSS | Regulon Activity |
| ∗The dot plots of a searched regulon are shown for all cell subpopulations in each disease state of each tissue based on the regulon specific score inferred using pySCENIC and by calculating the average expression. |
| Page: 1 |
Top |
Somatic mutation of malignant transformation related genes |
| Annotation of somatic variants for genes involved in malignant transformation |
| Hugo Symbol | Variant Class | Variant Classification | dbSNP RS | HGVSc | HGVSp | HGVSp Short | SWISSPROT | BIOTYPE | SIFT | PolyPhen | Tumor Sample Barcode | Tissue | Histology | Sex | Age | Stage | Therapy Types | Drugs | Outcome |
| FASN | SNV | Missense_Mutation | novel | c.2134T>A | p.Trp712Arg | p.W712R | P49327 | protein_coding | deleterious(0) | probably_damaging(1) | TCGA-A2-A3XS-01 | Breast | breast invasive carcinoma | Female | <65 | III/IV | Chemotherapy | cytoxan | PD |
| FASN | SNV | Missense_Mutation | rs771513967 | c.2635N>C | p.Thr879Pro | p.T879P | P49327 | protein_coding | tolerated(0.05) | benign(0.087) | TCGA-A7-A3IY-01 | Breast | breast invasive carcinoma | Female | >=65 | I/II | Hormone Therapy | anastrozole | SD |
| FASN | SNV | Missense_Mutation | c.6337N>A | p.Glu2113Lys | p.E2113K | P49327 | protein_coding | deleterious(0.02) | possibly_damaging(0.873) | TCGA-AC-A23H-01 | Breast | breast invasive carcinoma | Female | >=65 | I/II | Unknown | Unknown | PD | |
| FASN | SNV | Missense_Mutation | c.5925N>C | p.Leu1975Phe | p.L1975F | P49327 | protein_coding | deleterious(0.03) | probably_damaging(1) | TCGA-AC-A23H-01 | Breast | breast invasive carcinoma | Female | >=65 | I/II | Unknown | Unknown | PD | |
| FASN | SNV | Missense_Mutation | c.5531N>A | p.Ala1844Asp | p.A1844D | P49327 | protein_coding | deleterious(0) | probably_damaging(0.989) | TCGA-AC-A23H-01 | Breast | breast invasive carcinoma | Female | >=65 | I/II | Unknown | Unknown | PD | |
| FASN | SNV | Missense_Mutation | novel | c.5236N>G | p.Asn1746Asp | p.N1746D | P49327 | protein_coding | deleterious(0) | probably_damaging(0.999) | TCGA-AC-A2FE-01 | Breast | breast invasive carcinoma | Female | <65 | III/IV | Chemotherapy | adriamycin | PD |
| FASN | SNV | Missense_Mutation | rs759072039 | c.410N>A | p.Arg137Gln | p.R137Q | P49327 | protein_coding | deleterious(0.03) | possibly_damaging(0.664) | TCGA-AC-A5XS-01 | Breast | breast invasive carcinoma | Female | >=65 | I/II | Hormone Therapy | femara | SD |
| FASN | SNV | Missense_Mutation | c.5302N>A | p.Glu1768Lys | p.E1768K | P49327 | protein_coding | deleterious(0) | probably_damaging(0.999) | TCGA-AR-A256-01 | Breast | breast invasive carcinoma | Female | <65 | I/II | Chemotherapy | doxorubicin | PD | |
| FASN | SNV | Missense_Mutation | novel | c.4081N>G | p.Thr1361Ala | p.T1361A | P49327 | protein_coding | tolerated(0.13) | benign(0.08) | TCGA-BH-A18G-01 | Breast | breast invasive carcinoma | Female | >=65 | I/II | Unknown | Unknown | SD |
| FASN | SNV | Missense_Mutation | c.6665N>A | p.Leu2222Gln | p.L2222Q | P49327 | protein_coding | tolerated(0.18) | possibly_damaging(0.732) | TCGA-C8-A26Y-01 | Breast | breast invasive carcinoma | Female | >=65 | I/II | Unknown | Unknown | SD |
| Page: 1 2 3 4 5 6 7 8 9 10 11 12 13 14 15 16 17 18 19 20 21 22 |
Top |
Related drugs of malignant transformation related genes |
| Identification of chemicals and drugs interact with genes involved in malignant transfromation |
| (DGIdb 4.0) |
| Entrez ID | Symbol | Category | Interaction Types | Drug Claim Name | Drug Name | PMIDs |
| 2194 | FASN | DRUGGABLE GENOME, ENZYME, SHORT CHAIN DEHYDROGENASE REDUCTASE | BI-87E7 | CHEMBL523200 | ||
| 2194 | FASN | DRUGGABLE GENOME, ENZYME, SHORT CHAIN DEHYDROGENASE REDUCTASE | GNF-PF-2262 | CHEMBL577862 | ||
| 2194 | FASN | DRUGGABLE GENOME, ENZYME, SHORT CHAIN DEHYDROGENASE REDUCTASE | GNF-PF-1307 | CHEMBL585030 | ||
| 2194 | FASN | DRUGGABLE GENOME, ENZYME, SHORT CHAIN DEHYDROGENASE REDUCTASE | TCMDC-124317 | CHEMBL586937 | ||
| 2194 | FASN | DRUGGABLE GENOME, ENZYME, SHORT CHAIN DEHYDROGENASE REDUCTASE | HEXACHLOROPHENE | HEXACHLOROPHENE | ||
| 2194 | FASN | DRUGGABLE GENOME, ENZYME, SHORT CHAIN DEHYDROGENASE REDUCTASE | Cerulenin | CERULENIN | ||
| 2194 | FASN | DRUGGABLE GENOME, ENZYME, SHORT CHAIN DEHYDROGENASE REDUCTASE | PACLITAXEL | PACLITAXEL | 15657900 | |
| 2194 | FASN | DRUGGABLE GENOME, ENZYME, SHORT CHAIN DEHYDROGENASE REDUCTASE | LORGLUMIDE SODIUM | LORGLUMIDE SODIUM | ||
| 2194 | FASN | DRUGGABLE GENOME, ENZYME, SHORT CHAIN DEHYDROGENASE REDUCTASE | FSA2 | |||
| 2194 | FASN | DRUGGABLE GENOME, ENZYME, SHORT CHAIN DEHYDROGENASE REDUCTASE | PYROGALLOL RED | PYROGALLOL RED |
| Page: 1 2 3 |

Copyright 2023-Present -The University of Texas Health Science Center at Houston |