
|
|||||
|
 | |
| |
| |
| |
| |
| |
|
Gene: FARSB |
Gene summary for FARSB |
| Gene information | Species | Human | Gene symbol | FARSB | Gene ID | 10056 |
| Gene name | phenylalanyl-tRNA synthetase subunit beta | |
| Gene Alias | FARSLB | |
| Cytomap | 2q36.1 | |
| Gene Type | protein-coding | GO ID | GO:0006082 | UniProtAcc | Q9NSD9 |
Top |
Malignant transformation analysis |
| Identification of the aberrant gene expression in precancerous and cancerous lesions by comparing the gene expression of stem-like cells in diseased tissues with normal stem cells |
| Entrez ID | Symbol | Replicates | Species | Organ | Tissue | Adj P-value | Log2FC | Malignancy |
| 10056 | FARSB | HTA11_3410_2000001011 | Human | Colorectum | AD | 1.63e-04 | -3.33e-01 | 0.0155 |
| 10056 | FARSB | HTA11_10711_2000001011 | Human | Colorectum | AD | 4.29e-03 | -4.22e-01 | 0.0338 |
| 10056 | FARSB | HTA11_99999965104_69814 | Human | Colorectum | MSS | 4.56e-04 | 6.12e-01 | 0.281 |
| 10056 | FARSB | HTA11_99999974143_84620 | Human | Colorectum | MSS | 1.26e-04 | -2.79e-01 | 0.3005 |
| 10056 | FARSB | F007 | Human | Colorectum | FAP | 5.51e-05 | -4.74e-01 | 0.1176 |
| 10056 | FARSB | A001-C-207 | Human | Colorectum | FAP | 2.74e-05 | -3.74e-01 | 0.1278 |
| 10056 | FARSB | A015-C-203 | Human | Colorectum | FAP | 1.08e-23 | -4.34e-01 | -0.1294 |
| 10056 | FARSB | A015-C-204 | Human | Colorectum | FAP | 4.61e-07 | -3.64e-01 | -0.0228 |
| 10056 | FARSB | A014-C-040 | Human | Colorectum | FAP | 7.61e-03 | -3.41e-01 | -0.1184 |
| 10056 | FARSB | A002-C-201 | Human | Colorectum | FAP | 1.26e-19 | -5.36e-01 | 0.0324 |
| 10056 | FARSB | A001-C-119 | Human | Colorectum | FAP | 2.36e-13 | -5.66e-01 | -0.1557 |
| 10056 | FARSB | A001-C-108 | Human | Colorectum | FAP | 3.35e-19 | -4.23e-01 | -0.0272 |
| 10056 | FARSB | A002-C-205 | Human | Colorectum | FAP | 2.64e-21 | -4.93e-01 | -0.1236 |
| 10056 | FARSB | A001-C-104 | Human | Colorectum | FAP | 1.61e-06 | -3.51e-01 | 0.0184 |
| 10056 | FARSB | A015-C-005 | Human | Colorectum | FAP | 1.06e-08 | -4.45e-01 | -0.0336 |
| 10056 | FARSB | A015-C-006 | Human | Colorectum | FAP | 9.96e-12 | -3.30e-01 | -0.0994 |
| 10056 | FARSB | A015-C-106 | Human | Colorectum | FAP | 6.53e-07 | -2.15e-01 | -0.0511 |
| 10056 | FARSB | A002-C-114 | Human | Colorectum | FAP | 1.07e-17 | -5.04e-01 | -0.1561 |
| 10056 | FARSB | A015-C-104 | Human | Colorectum | FAP | 6.22e-25 | -4.47e-01 | -0.1899 |
| 10056 | FARSB | A001-C-014 | Human | Colorectum | FAP | 9.92e-12 | -3.68e-01 | 0.0135 |
| Page: 1 2 3 4 5 6 |
| Tissue | Expression Dynamics | Abbreviation |
| Colorectum (GSE201348) |  | FAP: Familial adenomatous polyposis |
| CRC: Colorectal cancer | ||
| Colorectum (HTA11) |  | AD: Adenomas |
| SER: Sessile serrated lesions | ||
| MSI-H: Microsatellite-high colorectal cancer | ||
| MSS: Microsatellite stable colorectal cancer | ||
| Esophagus | 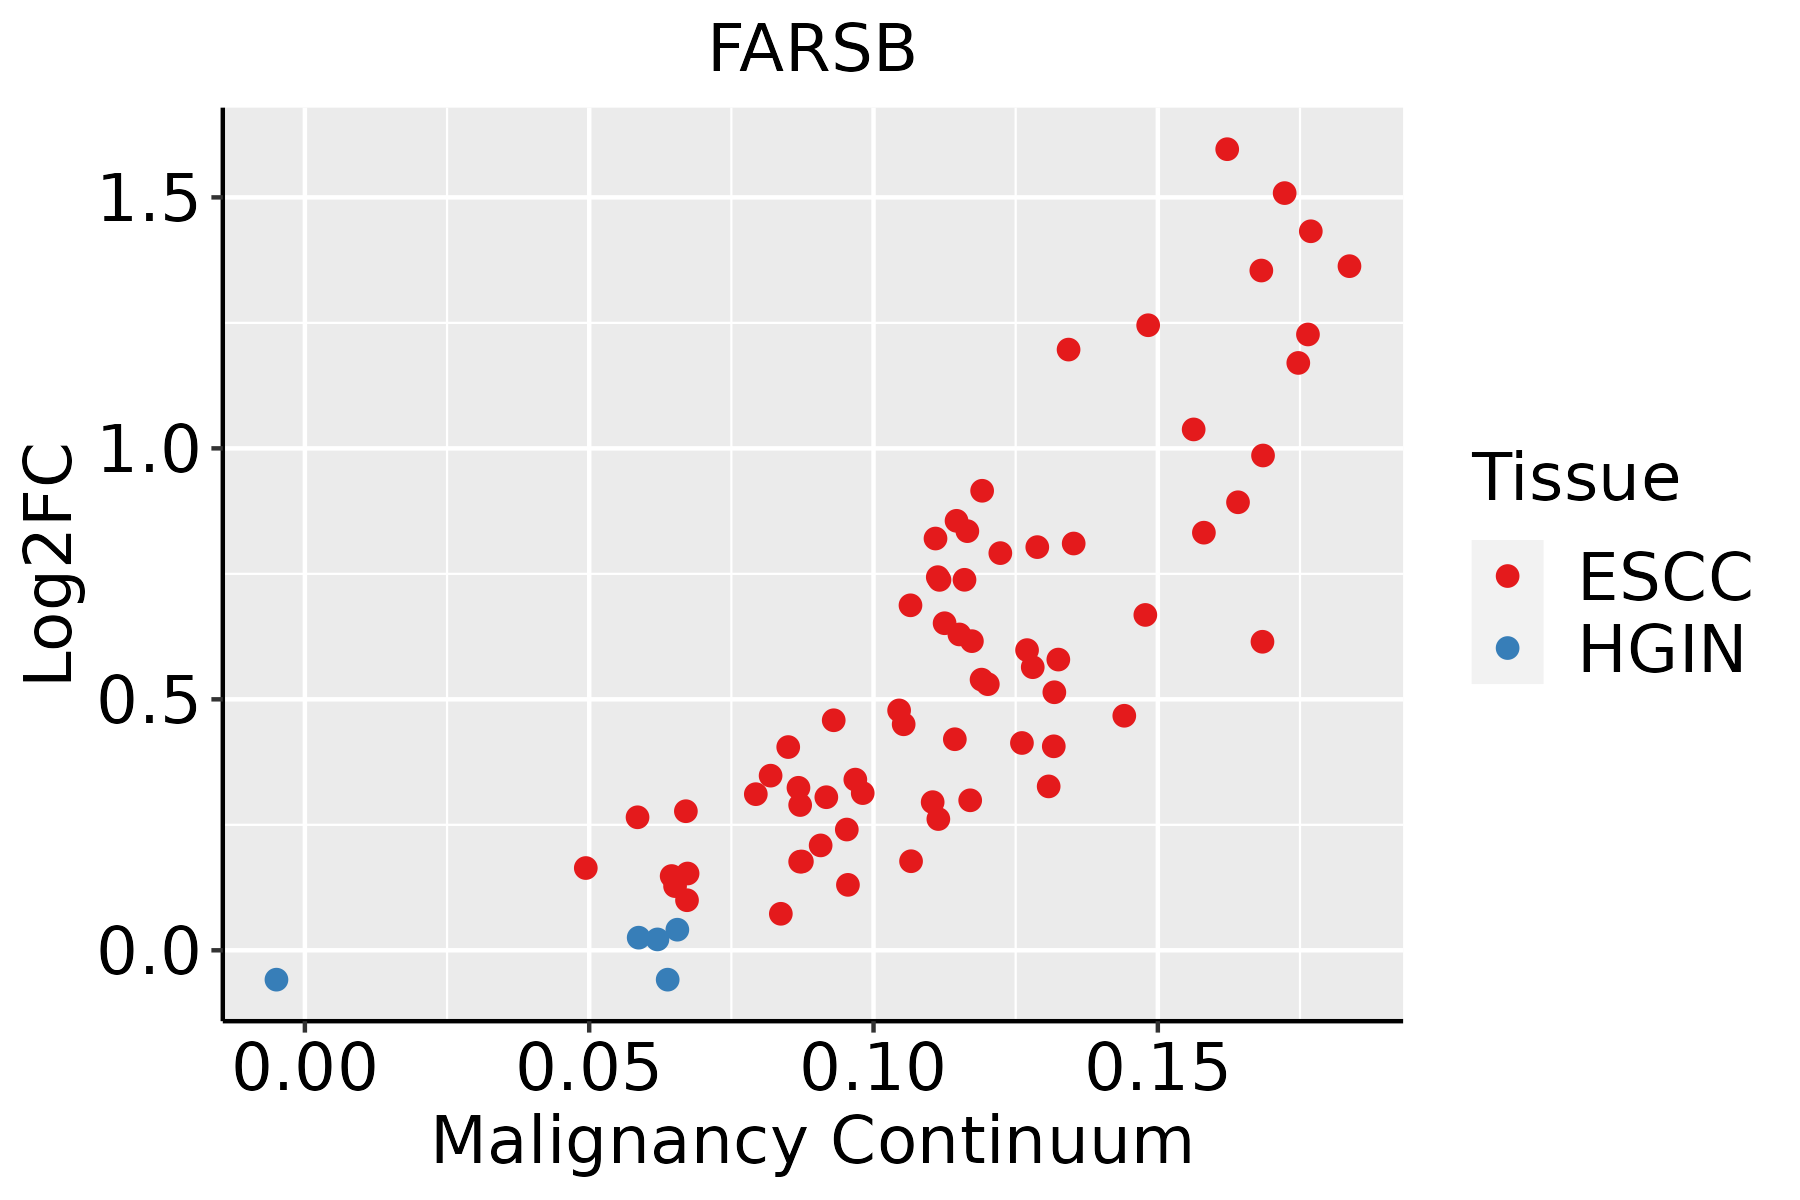 | ESCC: Esophageal squamous cell carcinoma |
| HGIN: High-grade intraepithelial neoplasias | ||
| LGIN: Low-grade intraepithelial neoplasias | ||
| Liver |  | HCC: Hepatocellular carcinoma |
| NAFLD: Non-alcoholic fatty liver disease | ||
| Oral Cavity | 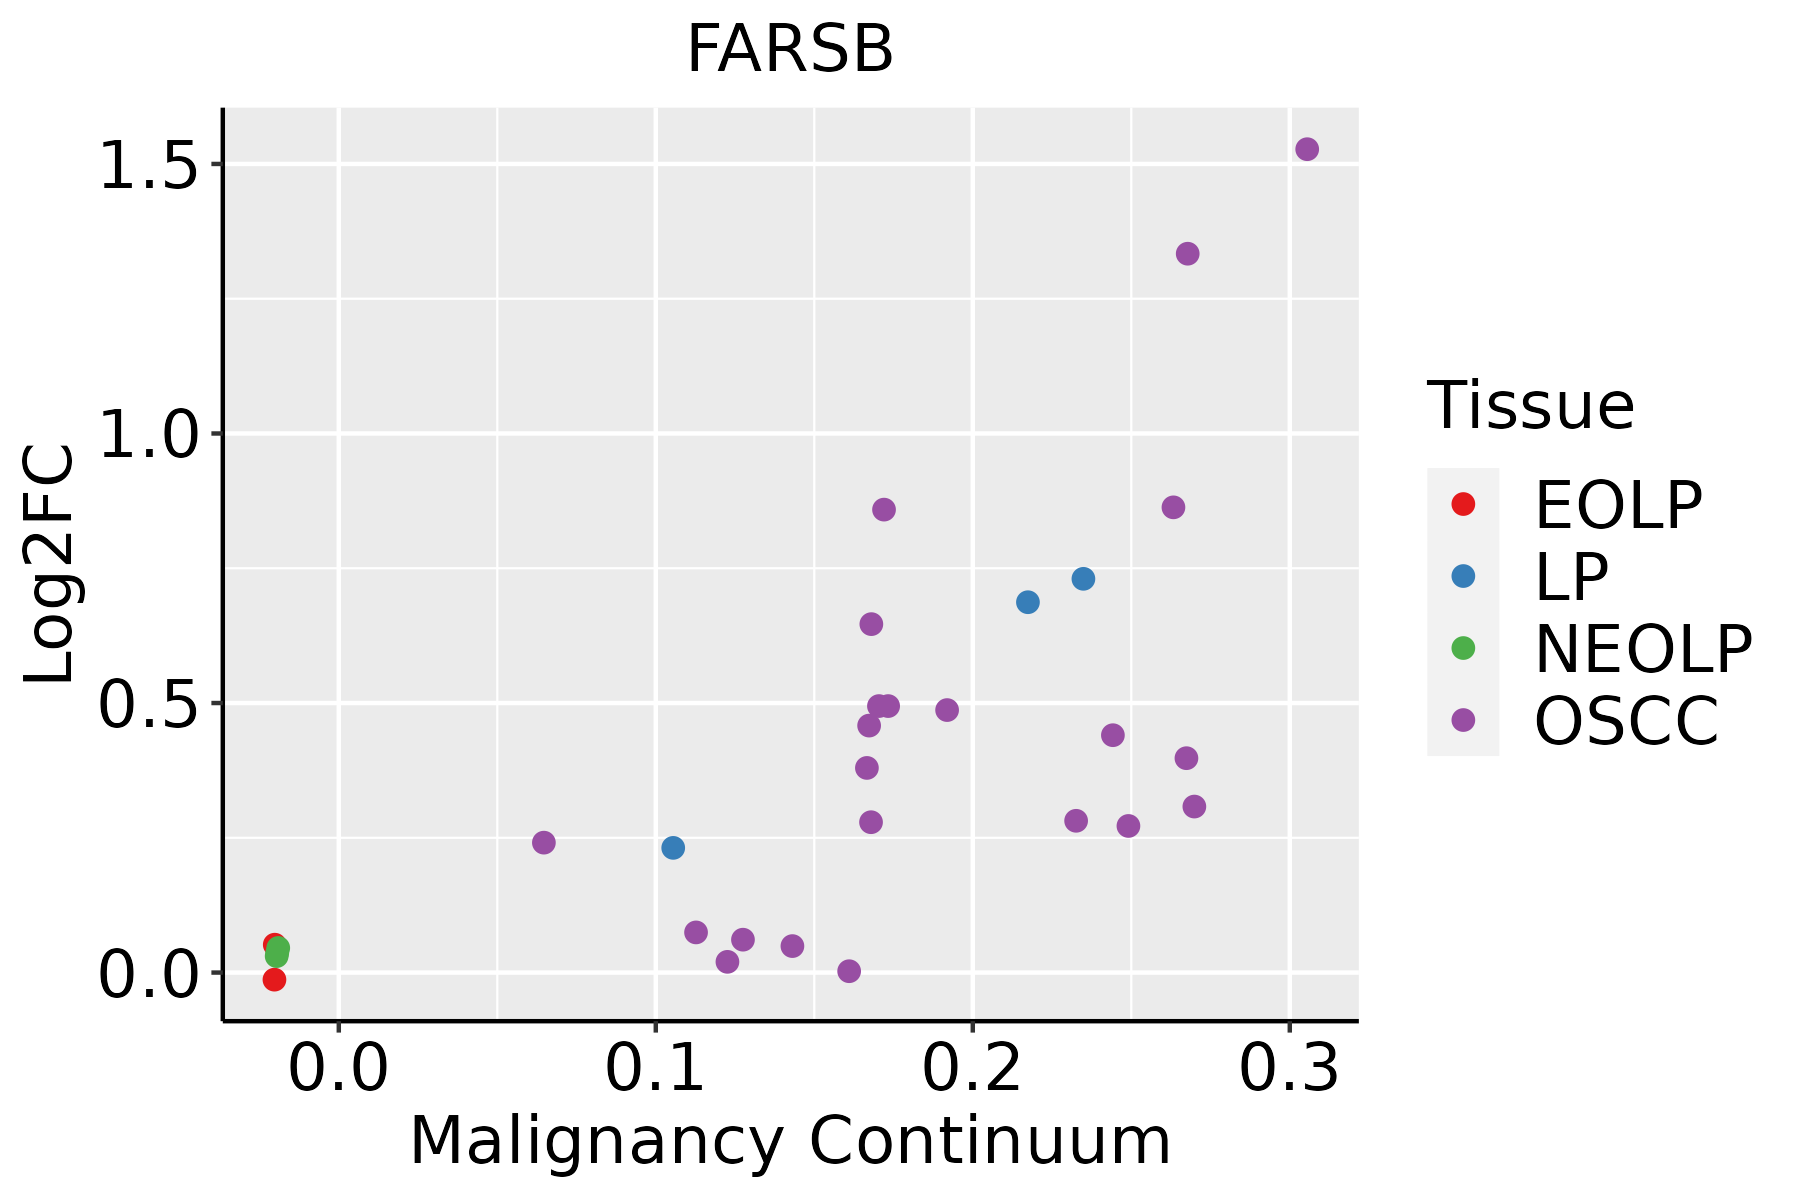 | EOLP: Erosive Oral lichen planus |
| LP: leukoplakia | ||
| NEOLP: Non-erosive oral lichen planus | ||
| OSCC: Oral squamous cell carcinoma | ||
| Skin |  | AK: Actinic keratosis |
| cSCC: Cutaneous squamous cell carcinoma | ||
| SCCIS:squamous cell carcinoma in situ |
| ∗log2FC in expression of this searched gene in stem-like cells from each diseased tissue sample relative to stem-like cells in normal samples in each tissue plotted against the malignancy continuum. Samples are colored based on if they are from different disease stage. |
Top |
Malignant transformation related pathway analysis |
| Find out the enriched GO biological processes and KEGG pathways involved in transition from healthy to precancer to cancer |
| Tissue | Disease Stage | Enriched GO biological Processes |
| Colorectum | AD |  |
| Colorectum | SER |  |
| Colorectum | MSS |  |
| Colorectum | MSI-H |  |
| Colorectum | FAP |  |
| ∗Top 15 enriched GO BP terms are showed in the bar plot of each disease state in each tissue. Each row represents a significant GO biological process which is colored according to the -log10(p.adjust). |
| Page: 1 2 3 4 5 6 7 8 9 |
| GO ID | Tissue | Disease Stage | Description | Gene Ratio | Bg Ratio | pvalue | p.adjust | Count |
| GO:0006418 | Colorectum | AD | tRNA aminoacylation for protein translation | 19/3918 | 41/18723 | 2.37e-04 | 3.03e-03 | 19 |
| GO:0043039 | Colorectum | AD | tRNA aminoacylation | 19/3918 | 44/18723 | 7.13e-04 | 7.21e-03 | 19 |
| GO:0043038 | Colorectum | AD | amino acid activation | 19/3918 | 45/18723 | 9.94e-04 | 9.28e-03 | 19 |
| GO:0006520 | Colorectum | AD | cellular amino acid metabolic process | 81/3918 | 284/18723 | 1.37e-03 | 1.19e-02 | 81 |
| GO:003466012 | Esophagus | ESCC | ncRNA metabolic process | 346/8552 | 485/18723 | 4.35e-31 | 2.51e-28 | 346 |
| GO:00063992 | Esophagus | ESCC | tRNA metabolic process | 122/8552 | 179/18723 | 9.03e-10 | 2.19e-08 | 122 |
| GO:00512623 | Esophagus | ESCC | protein tetramerization | 54/8552 | 87/18723 | 1.50e-03 | 7.06e-03 | 54 |
| GO:00512592 | Esophagus | ESCC | protein complex oligomerization | 130/8552 | 238/18723 | 3.29e-03 | 1.36e-02 | 130 |
| GO:00065203 | Liver | NAFLD | cellular amino acid metabolic process | 63/1882 | 284/18723 | 1.14e-09 | 2.17e-07 | 63 |
| GO:00346601 | Liver | HCC | ncRNA metabolic process | 332/7958 | 485/18723 | 1.48e-31 | 7.80e-29 | 332 |
| GO:00065202 | Liver | HCC | cellular amino acid metabolic process | 167/7958 | 284/18723 | 1.91e-08 | 4.56e-07 | 167 |
| GO:0006399 | Liver | HCC | tRNA metabolic process | 108/7958 | 179/18723 | 1.07e-06 | 1.59e-05 | 108 |
| GO:0051262 | Liver | HCC | protein tetramerization | 50/7958 | 87/18723 | 3.42e-03 | 1.55e-02 | 50 |
| GO:0051290 | Liver | HCC | protein heterotetramerization | 12/7958 | 15/18723 | 3.56e-03 | 1.59e-02 | 12 |
| GO:0051291 | Liver | HCC | protein heterooligomerization | 17/7958 | 25/18723 | 8.94e-03 | 3.45e-02 | 17 |
| GO:00346605 | Oral cavity | OSCC | ncRNA metabolic process | 296/7305 | 485/18723 | 2.94e-23 | 6.65e-21 | 296 |
| GO:00063991 | Oral cavity | OSCC | tRNA metabolic process | 101/7305 | 179/18723 | 1.65e-06 | 2.15e-05 | 101 |
| GO:0051259 | Oral cavity | OSCC | protein complex oligomerization | 121/7305 | 238/18723 | 1.29e-04 | 9.21e-04 | 121 |
| GO:00512622 | Oral cavity | OSCC | protein tetramerization | 48/7305 | 87/18723 | 1.60e-03 | 7.62e-03 | 48 |
| GO:003466011 | Oral cavity | LP | ncRNA metabolic process | 205/4623 | 485/18723 | 6.46e-18 | 1.09e-15 | 205 |
| Page: 1 2 |
| Pathway ID | Tissue | Disease Stage | Description | Gene Ratio | Bg Ratio | pvalue | p.adjust | qvalue | Count |
| Page: 1 |
Top |
Cell-cell communication analysis |
| Identification of potential cell-cell interactions between two cell types and their ligand-receptor pairs for different disease states |
| Ligand | Receptor | LRpair | Pathway | Tissue | Disease Stage |
| Page: 1 |
Top |
Single-cell gene regulatory network inference analysis |
| Find out the significant the regulons (TFs) and the target genes of each regulon across cell types for different disease states |
| TF | Cell Type | Tissue | Disease Stage | Target Gene | RSS | Regulon Activity |
| ∗The dot plots of a searched regulon are shown for all cell subpopulations in each disease state of each tissue based on the regulon specific score inferred using pySCENIC and by calculating the average expression. |
| Page: 1 |
Top |
Somatic mutation of malignant transformation related genes |
| Annotation of somatic variants for genes involved in malignant transformation |
| Hugo Symbol | Variant Class | Variant Classification | dbSNP RS | HGVSc | HGVSp | HGVSp Short | SWISSPROT | BIOTYPE | SIFT | PolyPhen | Tumor Sample Barcode | Tissue | Histology | Sex | Age | Stage | Therapy Types | Drugs | Outcome |
| FARSB | SNV | Missense_Mutation | c.1693C>G | p.His565Asp | p.H565D | Q9NSD9 | protein_coding | deleterious(0) | probably_damaging(1) | TCGA-A8-A09V-01 | Breast | breast invasive carcinoma | Female | <65 | I/II | Hormone Therapy | tamoxiphen | SD | |
| FARSB | SNV | Missense_Mutation | c.1595G>A | p.Gly532Glu | p.G532E | Q9NSD9 | protein_coding | deleterious(0.01) | probably_damaging(0.997) | TCGA-AR-A0TX-01 | Breast | breast invasive carcinoma | Female | <65 | I/II | Unknown | Unknown | SD | |
| FARSB | SNV | Missense_Mutation | c.350N>A | p.Ile117Lys | p.I117K | Q9NSD9 | protein_coding | deleterious(0) | possibly_damaging(0.873) | TCGA-D8-A1XK-01 | Breast | breast invasive carcinoma | Female | <65 | I/II | Chemotherapy | doxorubicine+cyclophosphamide | SD | |
| FARSB | SNV | Missense_Mutation | c.552N>T | p.Lys184Asn | p.K184N | Q9NSD9 | protein_coding | deleterious(0.02) | probably_damaging(0.929) | TCGA-AA-3697-01 | Colorectum | colon adenocarcinoma | Male | >=65 | I/II | Unknown | Unknown | SD | |
| FARSB | SNV | Missense_Mutation | novel | c.44T>C | p.Leu15Pro | p.L15P | Q9NSD9 | protein_coding | deleterious(0) | probably_damaging(0.917) | TCGA-AA-3947-01 | Colorectum | colon adenocarcinoma | Female | <65 | I/II | Unknown | Unknown | SD |
| FARSB | SNV | Missense_Mutation | c.111A>C | p.Glu37Asp | p.E37D | Q9NSD9 | protein_coding | tolerated(0.32) | benign(0.028) | TCGA-AA-3977-01 | Colorectum | colon adenocarcinoma | Male | >=65 | I/II | Unknown | Unknown | SD | |
| FARSB | SNV | Missense_Mutation | novel | c.1650G>T | p.Glu550Asp | p.E550D | Q9NSD9 | protein_coding | tolerated(0.46) | benign(0) | TCGA-AA-3984-01 | Colorectum | colon adenocarcinoma | Female | <65 | I/II | Unknown | Unknown | SD |
| FARSB | SNV | Missense_Mutation | c.1585G>T | p.Asp529Tyr | p.D529Y | Q9NSD9 | protein_coding | deleterious(0) | benign(0.232) | TCGA-AA-A00N-01 | Colorectum | colon adenocarcinoma | Male | >=65 | I/II | Unknown | Unknown | PD | |
| FARSB | SNV | Missense_Mutation | novel | c.812N>C | p.Val271Ala | p.V271A | Q9NSD9 | protein_coding | tolerated(0.05) | probably_damaging(0.995) | TCGA-AU-3779-01 | Colorectum | colon adenocarcinoma | Female | >=65 | I/II | Unknown | Unknown | SD |
| FARSB | SNV | Missense_Mutation | novel | c.1688N>C | p.Val563Ala | p.V563A | Q9NSD9 | protein_coding | deleterious(0.02) | possibly_damaging(0.745) | TCGA-AZ-4315-01 | Colorectum | colon adenocarcinoma | Male | <65 | I/II | Unknown | Unknown | SD |
| Page: 1 2 3 4 5 6 7 |
Top |
Related drugs of malignant transformation related genes |
| Identification of chemicals and drugs interact with genes involved in malignant transfromation |
| (DGIdb 4.0) |
| Entrez ID | Symbol | Category | Interaction Types | Drug Claim Name | Drug Name | PMIDs |
| Page: 1 |

Copyright 2023-Present -The University of Texas Health Science Center at Houston |