
|
|||||
|
 | |
| |
| |
| |
| |
| |
|
Gene: FARSA |
Gene summary for FARSA |
| Gene information | Species | Human | Gene symbol | FARSA | Gene ID | 2193 |
| Gene name | phenylalanyl-tRNA synthetase subunit alpha | |
| Gene Alias | CML33 | |
| Cytomap | 19p13.13 | |
| Gene Type | protein-coding | GO ID | GO:0006082 | UniProtAcc | Q6IBR2 |
Top |
Malignant transformation analysis |
| Identification of the aberrant gene expression in precancerous and cancerous lesions by comparing the gene expression of stem-like cells in diseased tissues with normal stem cells |
| Entrez ID | Symbol | Replicates | Species | Organ | Tissue | Adj P-value | Log2FC | Malignancy |
| 2193 | FARSA | HTA11_1938_2000001011 | Human | Colorectum | AD | 4.51e-08 | 3.80e-01 | -0.0811 |
| 2193 | FARSA | HTA11_78_2000001011 | Human | Colorectum | AD | 5.02e-05 | 2.62e-01 | -0.1088 |
| 2193 | FARSA | HTA11_347_2000001011 | Human | Colorectum | AD | 2.34e-08 | 3.32e-01 | -0.1954 |
| 2193 | FARSA | HTA11_83_2000001011 | Human | Colorectum | SER | 9.10e-05 | 4.00e-01 | -0.1526 |
| 2193 | FARSA | HTA11_696_2000001011 | Human | Colorectum | AD | 4.71e-14 | 4.44e-01 | -0.1464 |
| 2193 | FARSA | HTA11_866_2000001011 | Human | Colorectum | AD | 1.66e-05 | 2.57e-01 | -0.1001 |
| 2193 | FARSA | HTA11_1391_2000001011 | Human | Colorectum | AD | 8.53e-18 | 6.06e-01 | -0.059 |
| 2193 | FARSA | HTA11_2992_2000001011 | Human | Colorectum | SER | 2.11e-03 | 4.17e-01 | -0.1706 |
| 2193 | FARSA | HTA11_546_2000001011 | Human | Colorectum | AD | 1.82e-02 | 3.32e-01 | -0.0842 |
| 2193 | FARSA | HTA11_866_3004761011 | Human | Colorectum | AD | 5.18e-08 | 3.15e-01 | 0.096 |
| 2193 | FARSA | HTA11_8622_2000001021 | Human | Colorectum | SER | 2.13e-04 | 5.00e-01 | 0.0528 |
| 2193 | FARSA | HTA11_7663_2000001011 | Human | Colorectum | SER | 3.02e-03 | 4.11e-01 | 0.0131 |
| 2193 | FARSA | HTA11_7696_3000711011 | Human | Colorectum | AD | 2.37e-17 | 5.50e-01 | 0.0674 |
| 2193 | FARSA | HTA11_6818_2000001011 | Human | Colorectum | AD | 4.76e-02 | 3.48e-01 | 0.0112 |
| 2193 | FARSA | HTA11_6818_2000001021 | Human | Colorectum | AD | 9.25e-10 | 4.47e-01 | 0.0588 |
| 2193 | FARSA | HTA11_99999970781_79442 | Human | Colorectum | MSS | 5.13e-11 | 4.14e-01 | 0.294 |
| 2193 | FARSA | HTA11_99999965104_69814 | Human | Colorectum | MSS | 1.49e-08 | 4.19e-01 | 0.281 |
| 2193 | FARSA | HTA11_99999971662_82457 | Human | Colorectum | MSS | 1.55e-19 | 6.64e-01 | 0.3859 |
| 2193 | FARSA | HTA11_99999973899_84307 | Human | Colorectum | MSS | 2.12e-02 | 3.14e-01 | 0.2585 |
| 2193 | FARSA | HTA11_99999974143_84620 | Human | Colorectum | MSS | 8.18e-07 | 2.76e-01 | 0.3005 |
| Page: 1 2 3 4 5 6 7 |
| Tissue | Expression Dynamics | Abbreviation |
| Colorectum (GSE201348) |  | FAP: Familial adenomatous polyposis |
| CRC: Colorectal cancer | ||
| Colorectum (HTA11) |  | AD: Adenomas |
| SER: Sessile serrated lesions | ||
| MSI-H: Microsatellite-high colorectal cancer | ||
| MSS: Microsatellite stable colorectal cancer | ||
| Esophagus |  | ESCC: Esophageal squamous cell carcinoma |
| HGIN: High-grade intraepithelial neoplasias | ||
| LGIN: Low-grade intraepithelial neoplasias | ||
| Liver | 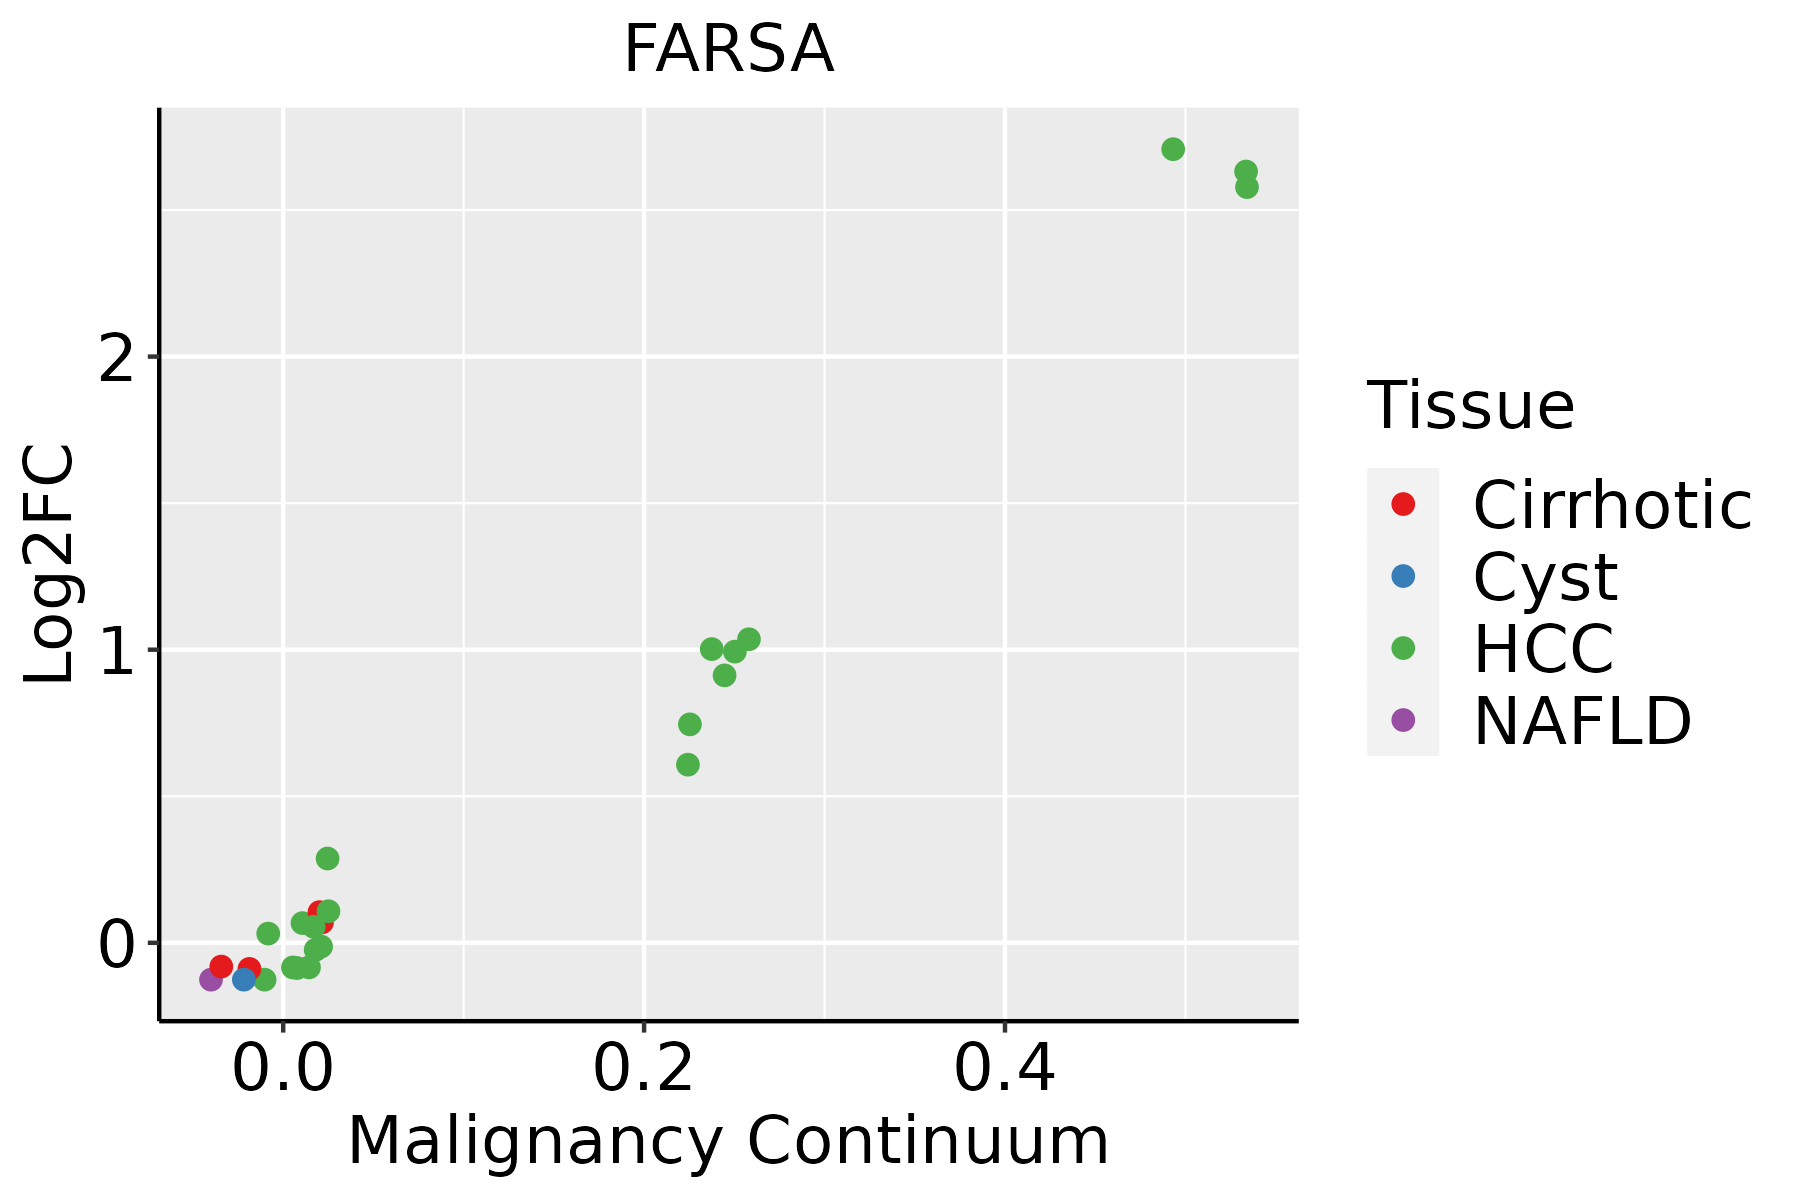 | HCC: Hepatocellular carcinoma |
| NAFLD: Non-alcoholic fatty liver disease | ||
| Oral Cavity |  | EOLP: Erosive Oral lichen planus |
| LP: leukoplakia | ||
| NEOLP: Non-erosive oral lichen planus | ||
| OSCC: Oral squamous cell carcinoma | ||
| Skin | 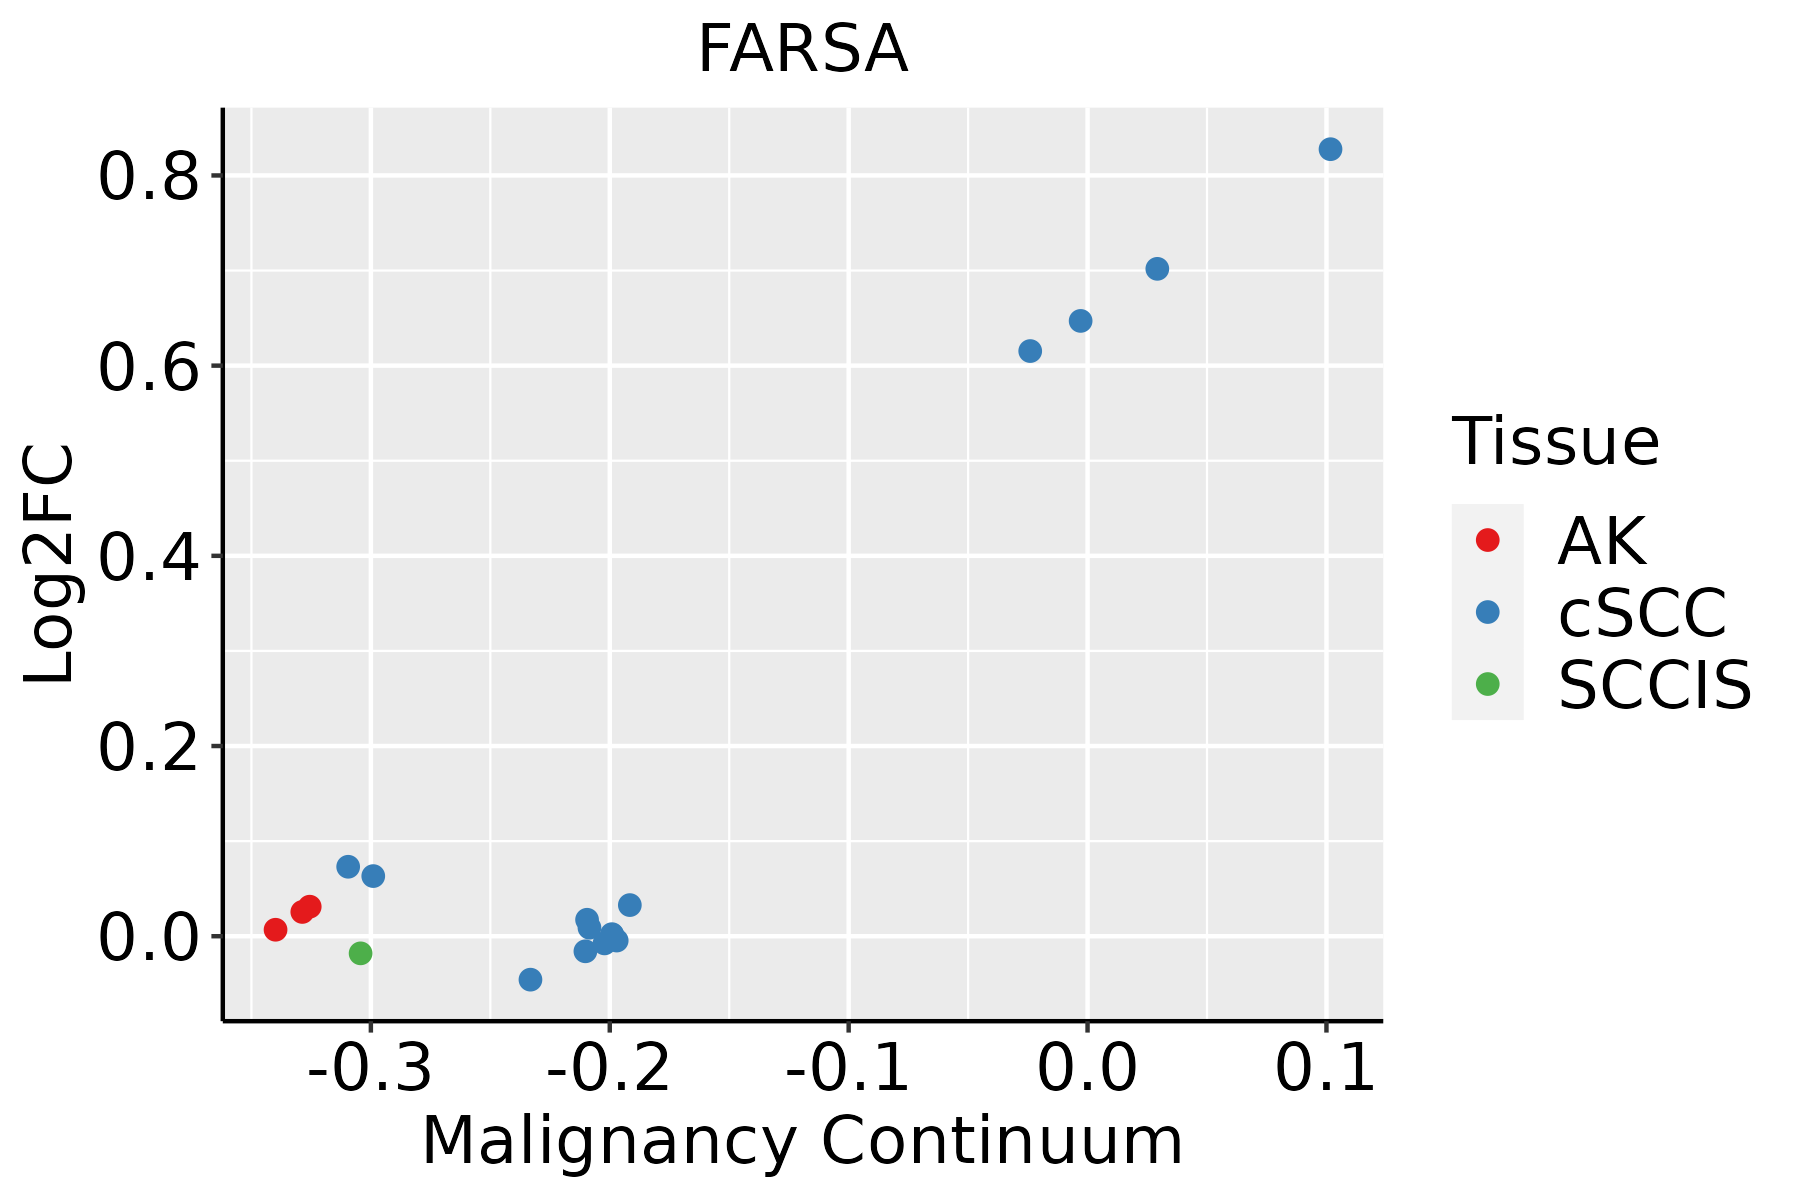 | AK: Actinic keratosis |
| cSCC: Cutaneous squamous cell carcinoma | ||
| SCCIS:squamous cell carcinoma in situ | ||
| Thyroid | 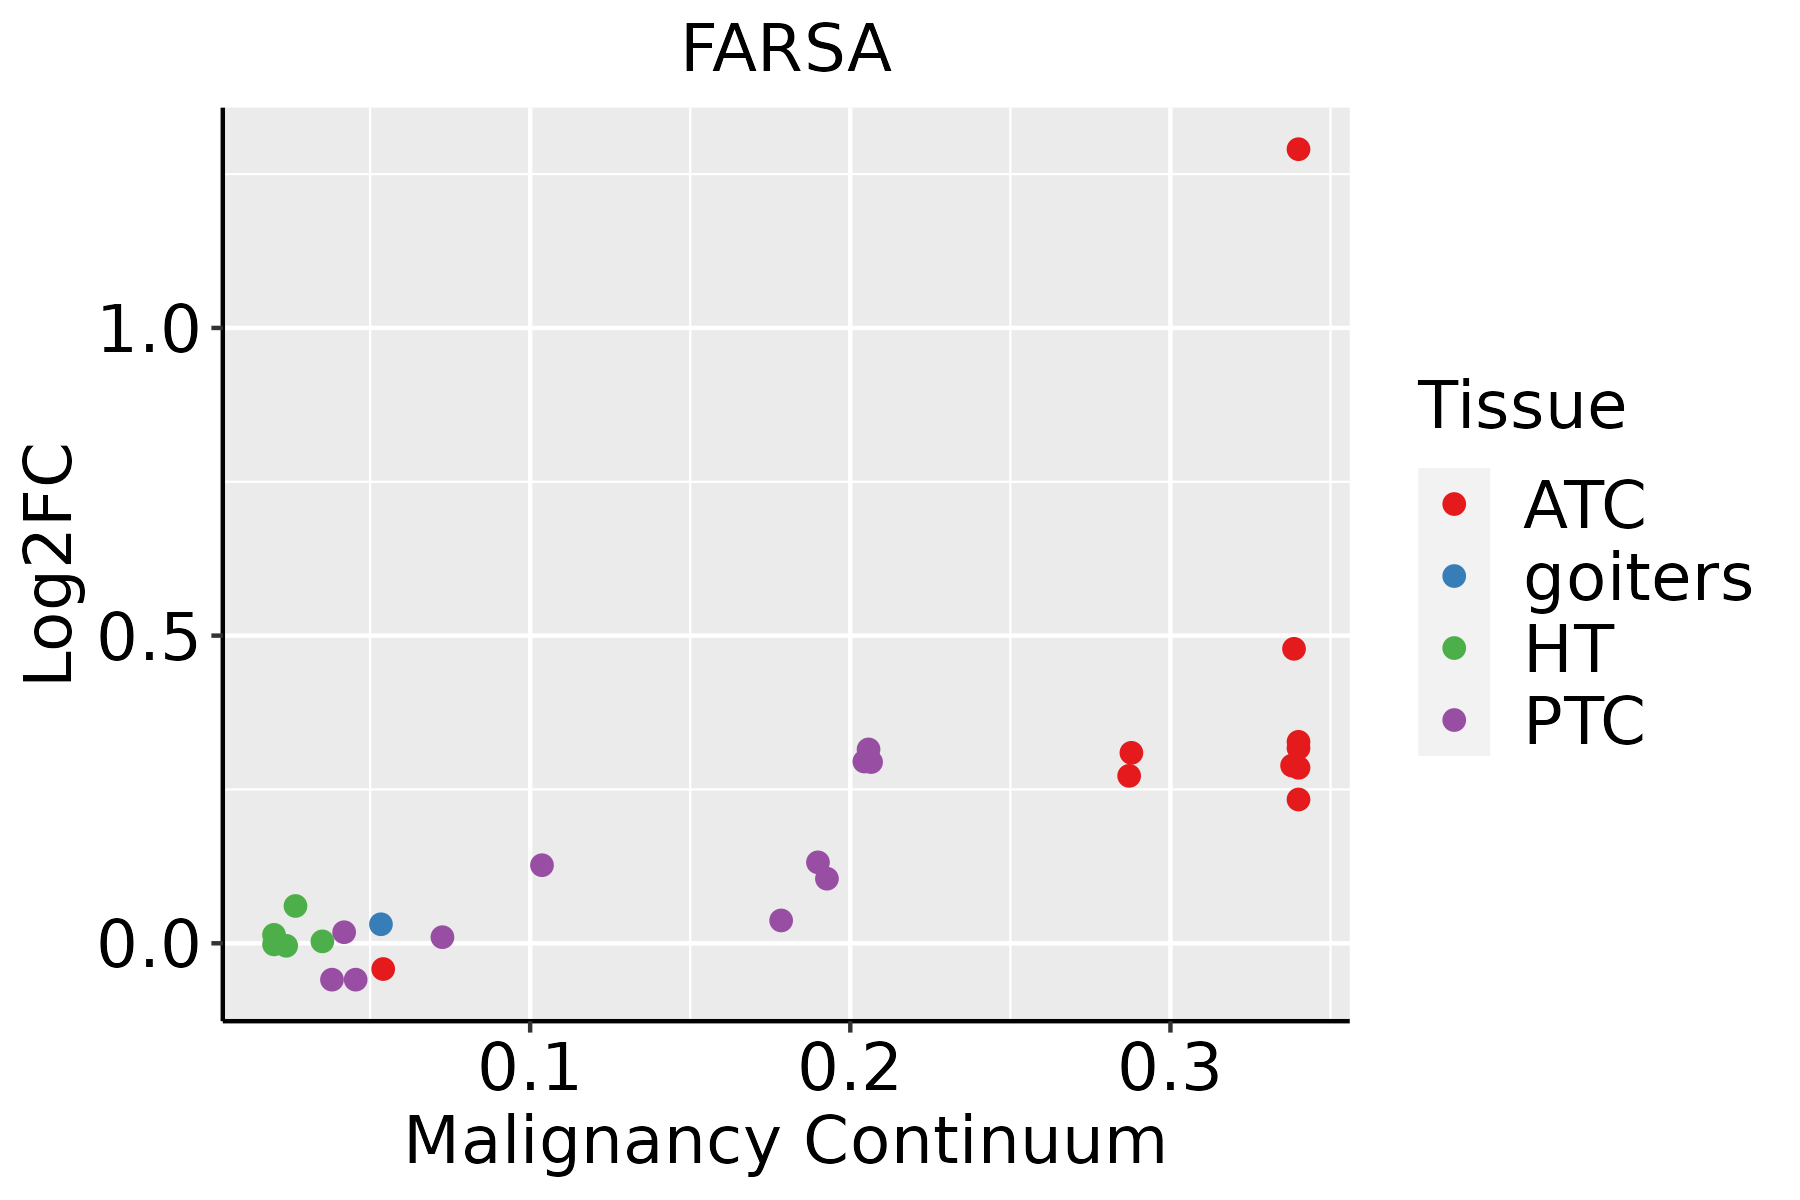 | ATC: Anaplastic thyroid cancer |
| HT: Hashimoto's thyroiditis | ||
| PTC: Papillary thyroid cancer |
| ∗log2FC in expression of this searched gene in stem-like cells from each diseased tissue sample relative to stem-like cells in normal samples in each tissue plotted against the malignancy continuum. Samples are colored based on if they are from different disease stage. |
Top |
Malignant transformation related pathway analysis |
| Find out the enriched GO biological processes and KEGG pathways involved in transition from healthy to precancer to cancer |
| Tissue | Disease Stage | Enriched GO biological Processes |
| Colorectum | AD |  |
| Colorectum | SER |  |
| Colorectum | MSS |  |
| Colorectum | MSI-H |  |
| Colorectum | FAP |  |
| ∗Top 15 enriched GO BP terms are showed in the bar plot of each disease state in each tissue. Each row represents a significant GO biological process which is colored according to the -log10(p.adjust). |
| Page: 1 2 3 4 5 6 7 8 9 |
| GO ID | Tissue | Disease Stage | Description | Gene Ratio | Bg Ratio | pvalue | p.adjust | Count |
| GO:0006418 | Colorectum | AD | tRNA aminoacylation for protein translation | 19/3918 | 41/18723 | 2.37e-04 | 3.03e-03 | 19 |
| GO:0043039 | Colorectum | AD | tRNA aminoacylation | 19/3918 | 44/18723 | 7.13e-04 | 7.21e-03 | 19 |
| GO:0043038 | Colorectum | AD | amino acid activation | 19/3918 | 45/18723 | 9.94e-04 | 9.28e-03 | 19 |
| GO:0006520 | Colorectum | AD | cellular amino acid metabolic process | 81/3918 | 284/18723 | 1.37e-03 | 1.19e-02 | 81 |
| GO:00064181 | Colorectum | SER | tRNA aminoacylation for protein translation | 17/2897 | 41/18723 | 5.75e-05 | 1.35e-03 | 17 |
| GO:00430391 | Colorectum | SER | tRNA aminoacylation | 17/2897 | 44/18723 | 1.64e-04 | 3.12e-03 | 17 |
| GO:00430381 | Colorectum | SER | amino acid activation | 17/2897 | 45/18723 | 2.25e-04 | 3.91e-03 | 17 |
| GO:00065201 | Colorectum | SER | cellular amino acid metabolic process | 61/2897 | 284/18723 | 4.20e-03 | 3.41e-02 | 61 |
| GO:00346606 | Esophagus | HGIN | ncRNA metabolic process | 104/2587 | 485/18723 | 2.26e-06 | 8.23e-05 | 104 |
| GO:003466012 | Esophagus | ESCC | ncRNA metabolic process | 346/8552 | 485/18723 | 4.35e-31 | 2.51e-28 | 346 |
| GO:00063992 | Esophagus | ESCC | tRNA metabolic process | 122/8552 | 179/18723 | 9.03e-10 | 2.19e-08 | 122 |
| GO:00512623 | Esophagus | ESCC | protein tetramerization | 54/8552 | 87/18723 | 1.50e-03 | 7.06e-03 | 54 |
| GO:00512592 | Esophagus | ESCC | protein complex oligomerization | 130/8552 | 238/18723 | 3.29e-03 | 1.36e-02 | 130 |
| GO:00346603 | Liver | Cirrhotic | ncRNA metabolic process | 173/4634 | 485/18723 | 3.64e-08 | 1.21e-06 | 173 |
| GO:000652011 | Liver | Cirrhotic | cellular amino acid metabolic process | 103/4634 | 284/18723 | 8.88e-06 | 1.30e-04 | 103 |
| GO:00346601 | Liver | HCC | ncRNA metabolic process | 332/7958 | 485/18723 | 1.48e-31 | 7.80e-29 | 332 |
| GO:00065202 | Liver | HCC | cellular amino acid metabolic process | 167/7958 | 284/18723 | 1.91e-08 | 4.56e-07 | 167 |
| GO:0006399 | Liver | HCC | tRNA metabolic process | 108/7958 | 179/18723 | 1.07e-06 | 1.59e-05 | 108 |
| GO:0051262 | Liver | HCC | protein tetramerization | 50/7958 | 87/18723 | 3.42e-03 | 1.55e-02 | 50 |
| GO:0051290 | Liver | HCC | protein heterotetramerization | 12/7958 | 15/18723 | 3.56e-03 | 1.59e-02 | 12 |
| Page: 1 2 |
| Pathway ID | Tissue | Disease Stage | Description | Gene Ratio | Bg Ratio | pvalue | p.adjust | qvalue | Count |
| Page: 1 |
Top |
Cell-cell communication analysis |
| Identification of potential cell-cell interactions between two cell types and their ligand-receptor pairs for different disease states |
| Ligand | Receptor | LRpair | Pathway | Tissue | Disease Stage |
| Page: 1 |
Top |
Single-cell gene regulatory network inference analysis |
| Find out the significant the regulons (TFs) and the target genes of each regulon across cell types for different disease states |
| TF | Cell Type | Tissue | Disease Stage | Target Gene | RSS | Regulon Activity |
| ∗The dot plots of a searched regulon are shown for all cell subpopulations in each disease state of each tissue based on the regulon specific score inferred using pySCENIC and by calculating the average expression. |
| Page: 1 |
Top |
Somatic mutation of malignant transformation related genes |
| Annotation of somatic variants for genes involved in malignant transformation |
| Hugo Symbol | Variant Class | Variant Classification | dbSNP RS | HGVSc | HGVSp | HGVSp Short | SWISSPROT | BIOTYPE | SIFT | PolyPhen | Tumor Sample Barcode | Tissue | Histology | Sex | Age | Stage | Therapy Types | Drugs | Outcome |
| FARSA | SNV | Missense_Mutation | c.205N>A | p.Glu69Lys | p.E69K | Q9Y285 | protein_coding | tolerated(0.57) | benign(0.006) | TCGA-AC-A23H-01 | Breast | breast invasive carcinoma | Female | >=65 | I/II | Unknown | Unknown | PD | |
| FARSA | SNV | Missense_Mutation | c.388N>C | p.Asp130His | p.D130H | Q9Y285 | protein_coding | deleterious(0.02) | benign(0.192) | TCGA-BH-A18P-01 | Breast | breast invasive carcinoma | Female | <65 | I/II | Unknown | Unknown | PD | |
| FARSA | SNV | Missense_Mutation | c.1113N>G | p.His371Gln | p.H371Q | Q9Y285 | protein_coding | deleterious(0.02) | possibly_damaging(0.905) | TCGA-C8-A134-01 | Breast | breast invasive carcinoma | Female | <65 | I/II | Chemotherapy | 5-fluorouracil | CR | |
| FARSA | insertion | Frame_Shift_Ins | rs777211508 | c.437_438insG | p.Gln147ThrfsTer3 | p.Q147Tfs*3 | Q9Y285 | protein_coding | TCGA-A8-A09Z-01 | Breast | breast invasive carcinoma | Female | >=65 | I/II | Unknown | Unknown | SD | ||
| FARSA | insertion | Frame_Shift_Ins | novel | c.1404_1405insATAAAAAAATTAGGGCTGGGAA | p.Tyr469IlefsTer28 | p.Y469Ifs*28 | Q9Y285 | protein_coding | TCGA-AO-A0JJ-01 | Breast | breast invasive carcinoma | Female | <65 | I/II | Chemotherapy | cyclophospamide | SD | ||
| FARSA | insertion | Nonsense_Mutation | novel | c.1049_1050insGGGAGGGCTAAGGCAACTACGTGGTCAGTGAAGGC | p.Tyr350Ter | p.Y350* | Q9Y285 | protein_coding | TCGA-BH-A0HF-01 | Breast | breast invasive carcinoma | Female | >=65 | I/II | Hormone Therapy | arimidex | SD | ||
| FARSA | deletion | Frame_Shift_Del | novel | c.174delN | p.Lys59SerfsTer101 | p.K59Sfs*101 | Q9Y285 | protein_coding | TCGA-D8-A27V-01 | Breast | breast invasive carcinoma | Female | <65 | I/II | Hormone Therapy | tamoxiphen | SD | ||
| FARSA | SNV | Missense_Mutation | rs758130016 | c.1387N>T | p.Arg463Cys | p.R463C | Q9Y285 | protein_coding | deleterious(0) | probably_damaging(1) | TCGA-2W-A8YY-01 | Cervix | cervical & endocervical cancer | Female | <65 | I/II | Chemotherapy | cisplatin | CR |
| FARSA | SNV | Missense_Mutation | rs145305261 | c.371N>A | p.Arg124Gln | p.R124Q | Q9Y285 | protein_coding | tolerated(0.44) | benign(0.01) | TCGA-2W-A8YY-01 | Cervix | cervical & endocervical cancer | Female | <65 | I/II | Chemotherapy | cisplatin | CR |
| FARSA | SNV | Missense_Mutation | c.1417N>T | p.Asn473Tyr | p.N473Y | Q9Y285 | protein_coding | deleterious(0) | probably_damaging(0.998) | TCGA-AA-3492-01 | Colorectum | colon adenocarcinoma | Female | >=65 | I/II | Unknown | Unknown | SD |
| Page: 1 2 3 4 5 6 |
Top |
Related drugs of malignant transformation related genes |
| Identification of chemicals and drugs interact with genes involved in malignant transfromation |
| (DGIdb 4.0) |
| Entrez ID | Symbol | Category | Interaction Types | Drug Claim Name | Drug Name | PMIDs |
| Page: 1 |

Copyright 2023-Present -The University of Texas Health Science Center at Houston |