
|
|||||
|
 | |
| |
| |
| |
| |
| |
|
Gene: FARS2 |
Gene summary for FARS2 |
| Gene information | Species | Human | Gene symbol | FARS2 | Gene ID | 10667 |
| Gene name | phenylalanyl-tRNA synthetase 2, mitochondrial | |
| Gene Alias | COXPD14 | |
| Cytomap | 6p25.1 | |
| Gene Type | protein-coding | GO ID | GO:0006082 | UniProtAcc | O95363 |
Top |
Malignant transformation analysis |
| Identification of the aberrant gene expression in precancerous and cancerous lesions by comparing the gene expression of stem-like cells in diseased tissues with normal stem cells |
| Entrez ID | Symbol | Replicates | Species | Organ | Tissue | Adj P-value | Log2FC | Malignancy |
| 10667 | FARS2 | CCI_1 | Human | Cervix | CC | 1.78e-10 | 8.02e-01 | 0.528 |
| 10667 | FARS2 | CCI_2 | Human | Cervix | CC | 9.10e-14 | 1.35e+00 | 0.5249 |
| 10667 | FARS2 | CCI_3 | Human | Cervix | CC | 1.69e-15 | 9.14e-01 | 0.516 |
| 10667 | FARS2 | HTA11_3410_2000001011 | Human | Colorectum | AD | 1.21e-15 | -5.28e-01 | 0.0155 |
| 10667 | FARS2 | HTA11_2487_2000001011 | Human | Colorectum | SER | 4.99e-03 | -5.13e-01 | -0.1808 |
| 10667 | FARS2 | HTA11_2951_2000001011 | Human | Colorectum | AD | 9.24e-03 | -5.29e-01 | 0.0216 |
| 10667 | FARS2 | HTA11_3361_2000001011 | Human | Colorectum | AD | 3.09e-04 | -5.75e-01 | -0.1207 |
| 10667 | FARS2 | HTA11_696_2000001011 | Human | Colorectum | AD | 5.21e-06 | -3.87e-01 | -0.1464 |
| 10667 | FARS2 | HTA11_866_2000001011 | Human | Colorectum | AD | 8.47e-05 | -3.22e-01 | -0.1001 |
| 10667 | FARS2 | HTA11_866_3004761011 | Human | Colorectum | AD | 1.69e-05 | -4.61e-01 | 0.096 |
| 10667 | FARS2 | HTA11_7696_3000711011 | Human | Colorectum | AD | 1.32e-02 | -2.67e-01 | 0.0674 |
| 10667 | FARS2 | HTA11_99999970781_79442 | Human | Colorectum | MSS | 2.04e-04 | -2.83e-01 | 0.294 |
| 10667 | FARS2 | HTA11_99999965104_69814 | Human | Colorectum | MSS | 1.10e-04 | 5.72e-01 | 0.281 |
| 10667 | FARS2 | HTA11_99999974143_84620 | Human | Colorectum | MSS | 2.75e-23 | -6.62e-01 | 0.3005 |
| 10667 | FARS2 | F007 | Human | Colorectum | FAP | 8.80e-03 | -1.51e-01 | 0.1176 |
| 10667 | FARS2 | A001-C-207 | Human | Colorectum | FAP | 5.29e-05 | -3.11e-01 | 0.1278 |
| 10667 | FARS2 | A015-C-203 | Human | Colorectum | FAP | 3.03e-33 | -6.17e-01 | -0.1294 |
| 10667 | FARS2 | A015-C-204 | Human | Colorectum | FAP | 6.67e-11 | -4.51e-01 | -0.0228 |
| 10667 | FARS2 | A014-C-040 | Human | Colorectum | FAP | 1.18e-06 | -6.11e-01 | -0.1184 |
| 10667 | FARS2 | A002-C-201 | Human | Colorectum | FAP | 6.19e-19 | -5.13e-01 | 0.0324 |
| Page: 1 2 3 4 5 6 7 8 |
| Tissue | Expression Dynamics | Abbreviation |
| Cervix | 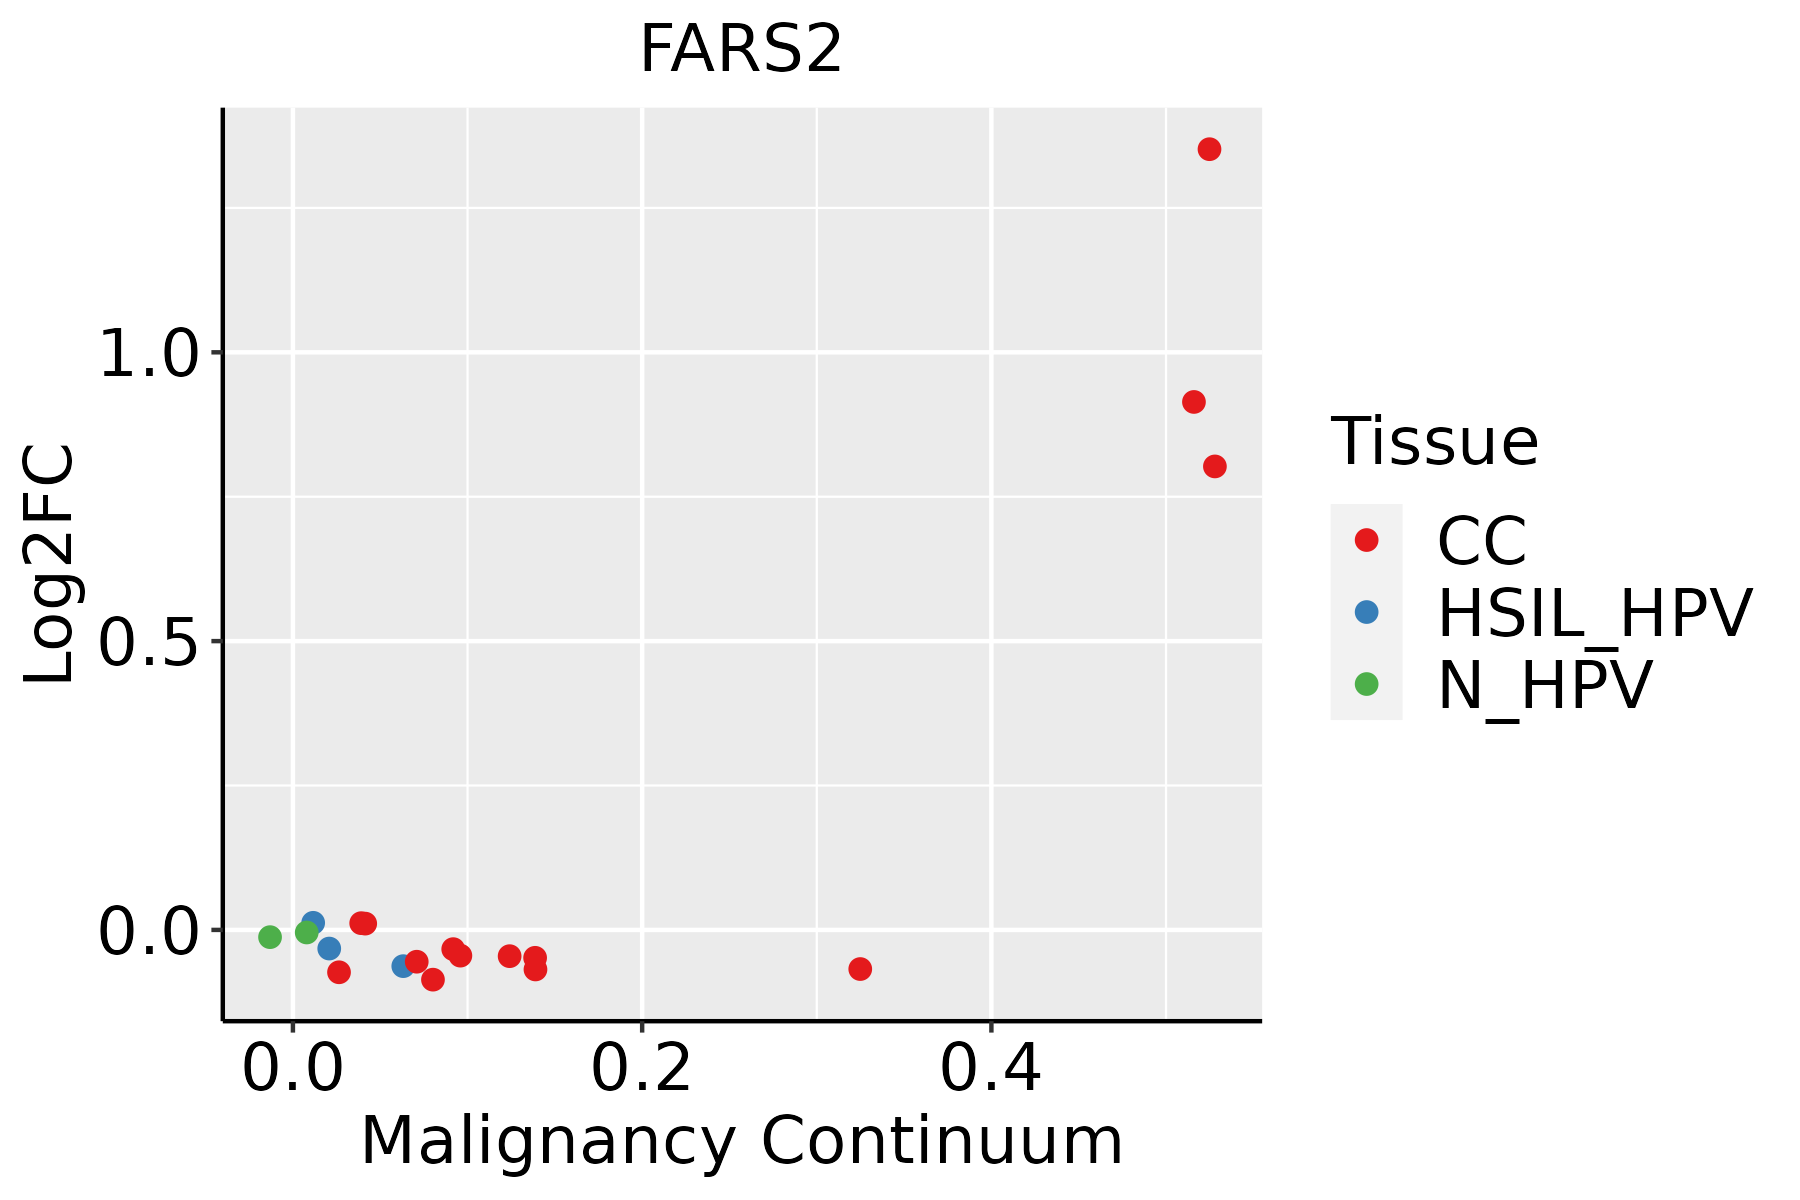 | CC: Cervix cancer |
| HSIL_HPV: HPV-infected high-grade squamous intraepithelial lesions | ||
| N_HPV: HPV-infected normal cervix | ||
| Colorectum (GSE201348) |  | FAP: Familial adenomatous polyposis |
| CRC: Colorectal cancer | ||
| Colorectum (HTA11) |  | AD: Adenomas |
| SER: Sessile serrated lesions | ||
| MSI-H: Microsatellite-high colorectal cancer | ||
| MSS: Microsatellite stable colorectal cancer | ||
| Endometrium | 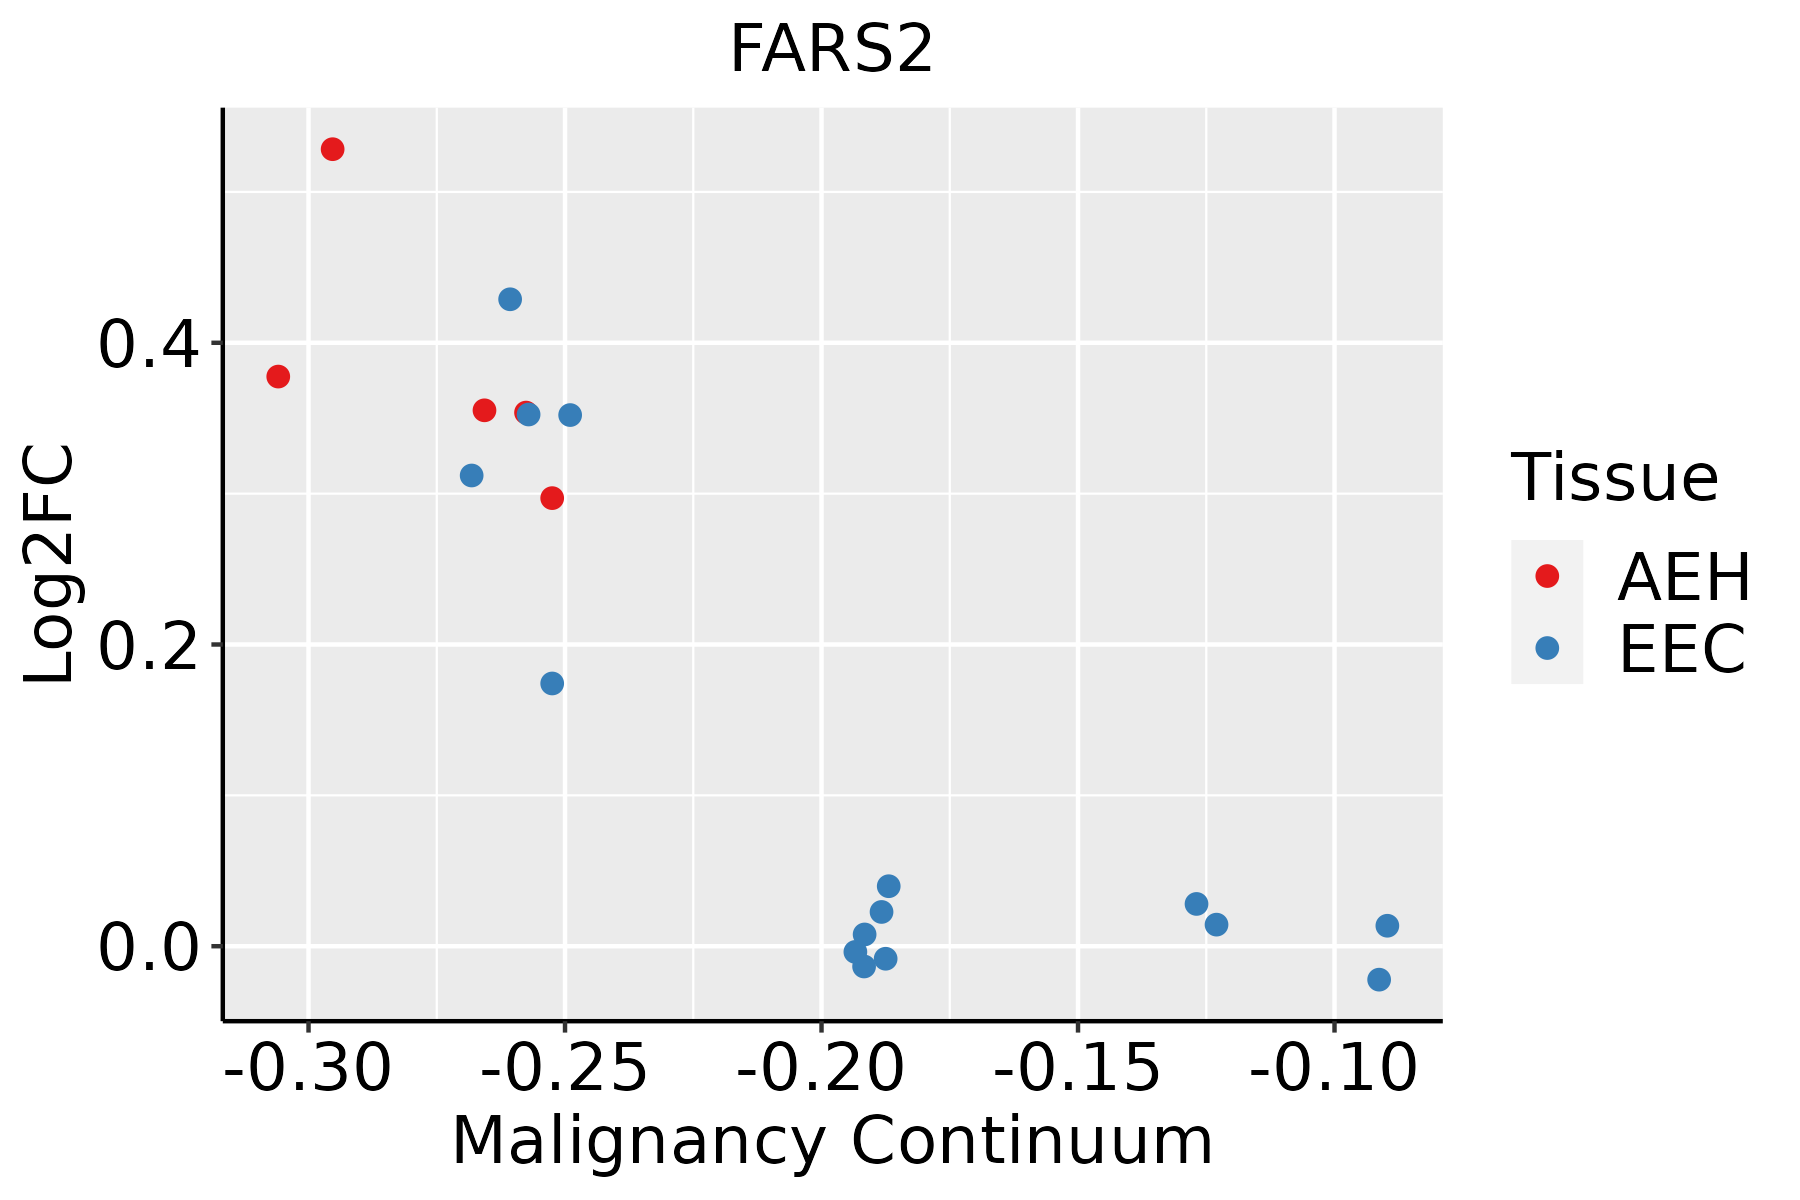 | AEH: Atypical endometrial hyperplasia |
| EEC: Endometrioid Cancer | ||
| Esophagus | 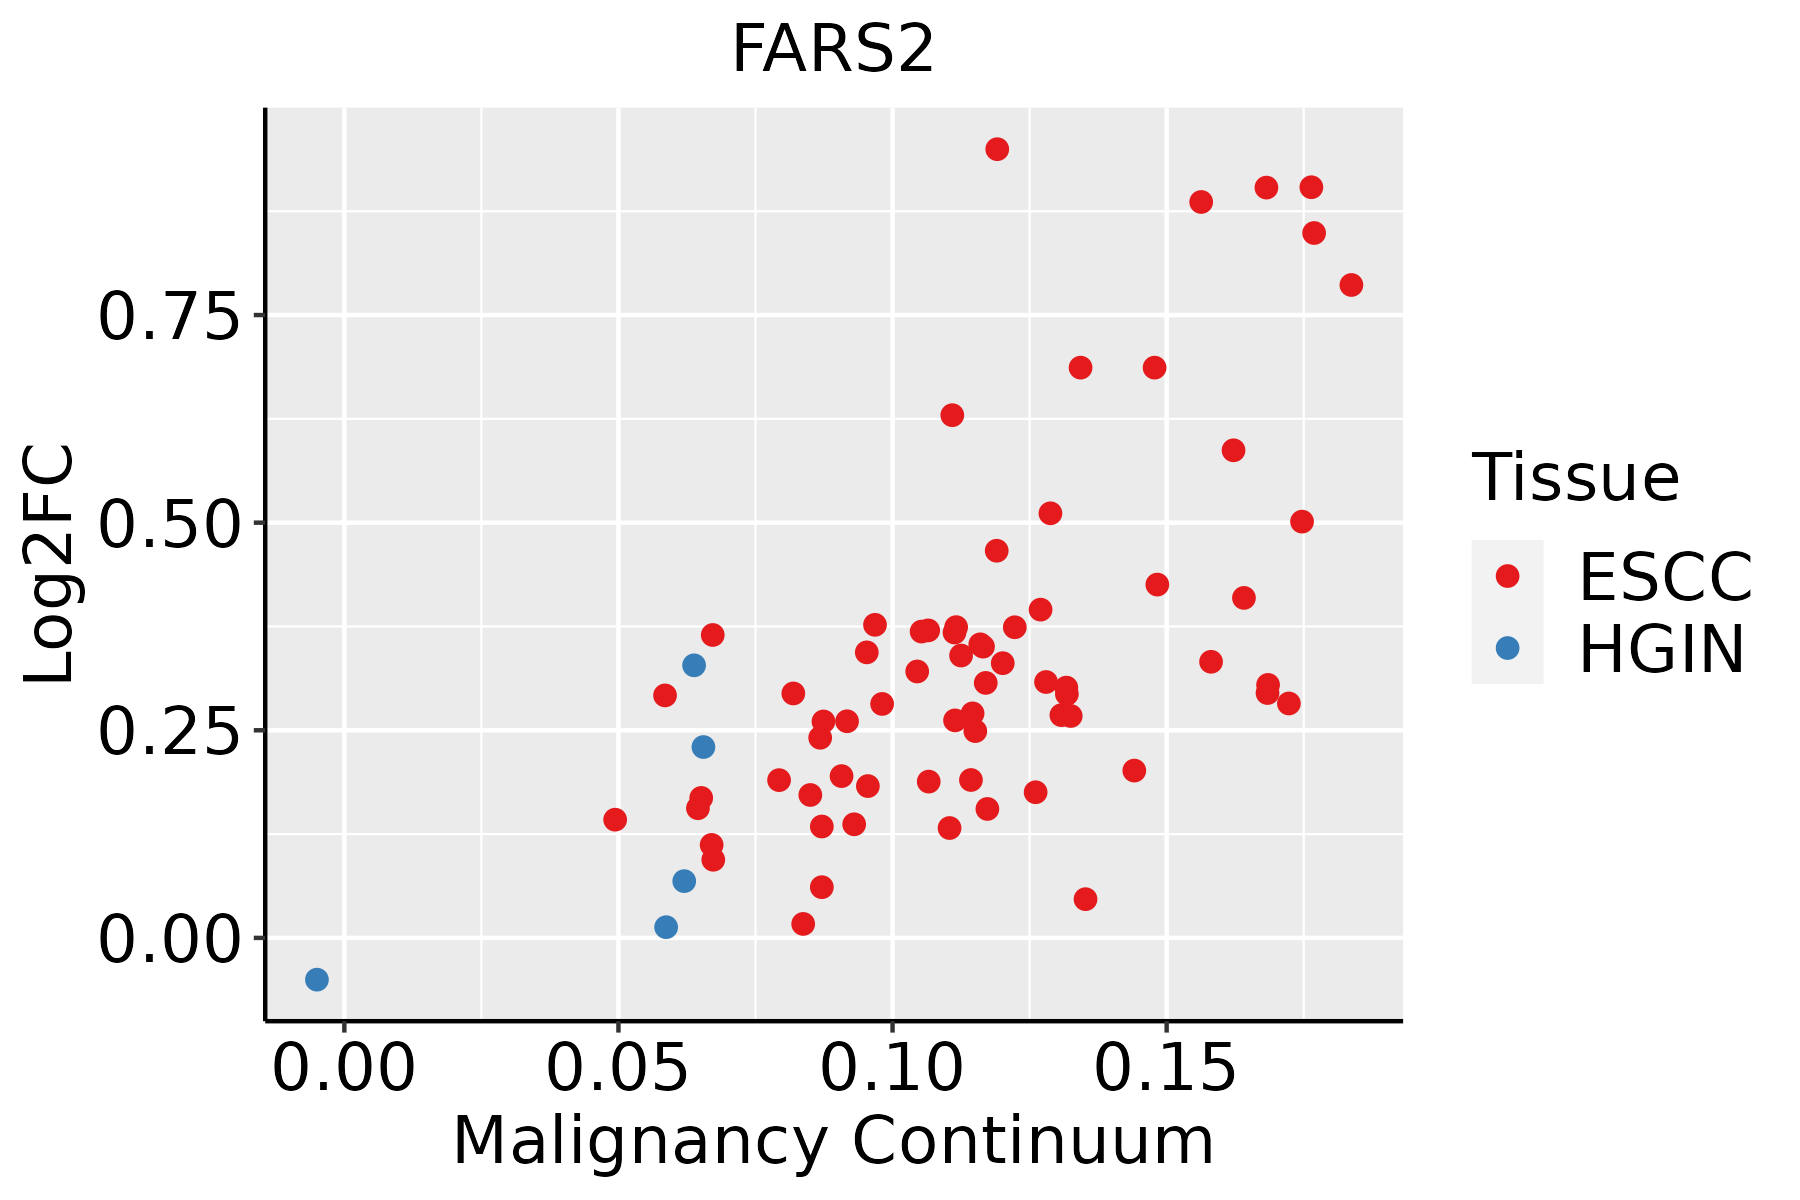 | ESCC: Esophageal squamous cell carcinoma |
| HGIN: High-grade intraepithelial neoplasias | ||
| LGIN: Low-grade intraepithelial neoplasias | ||
| Lung | 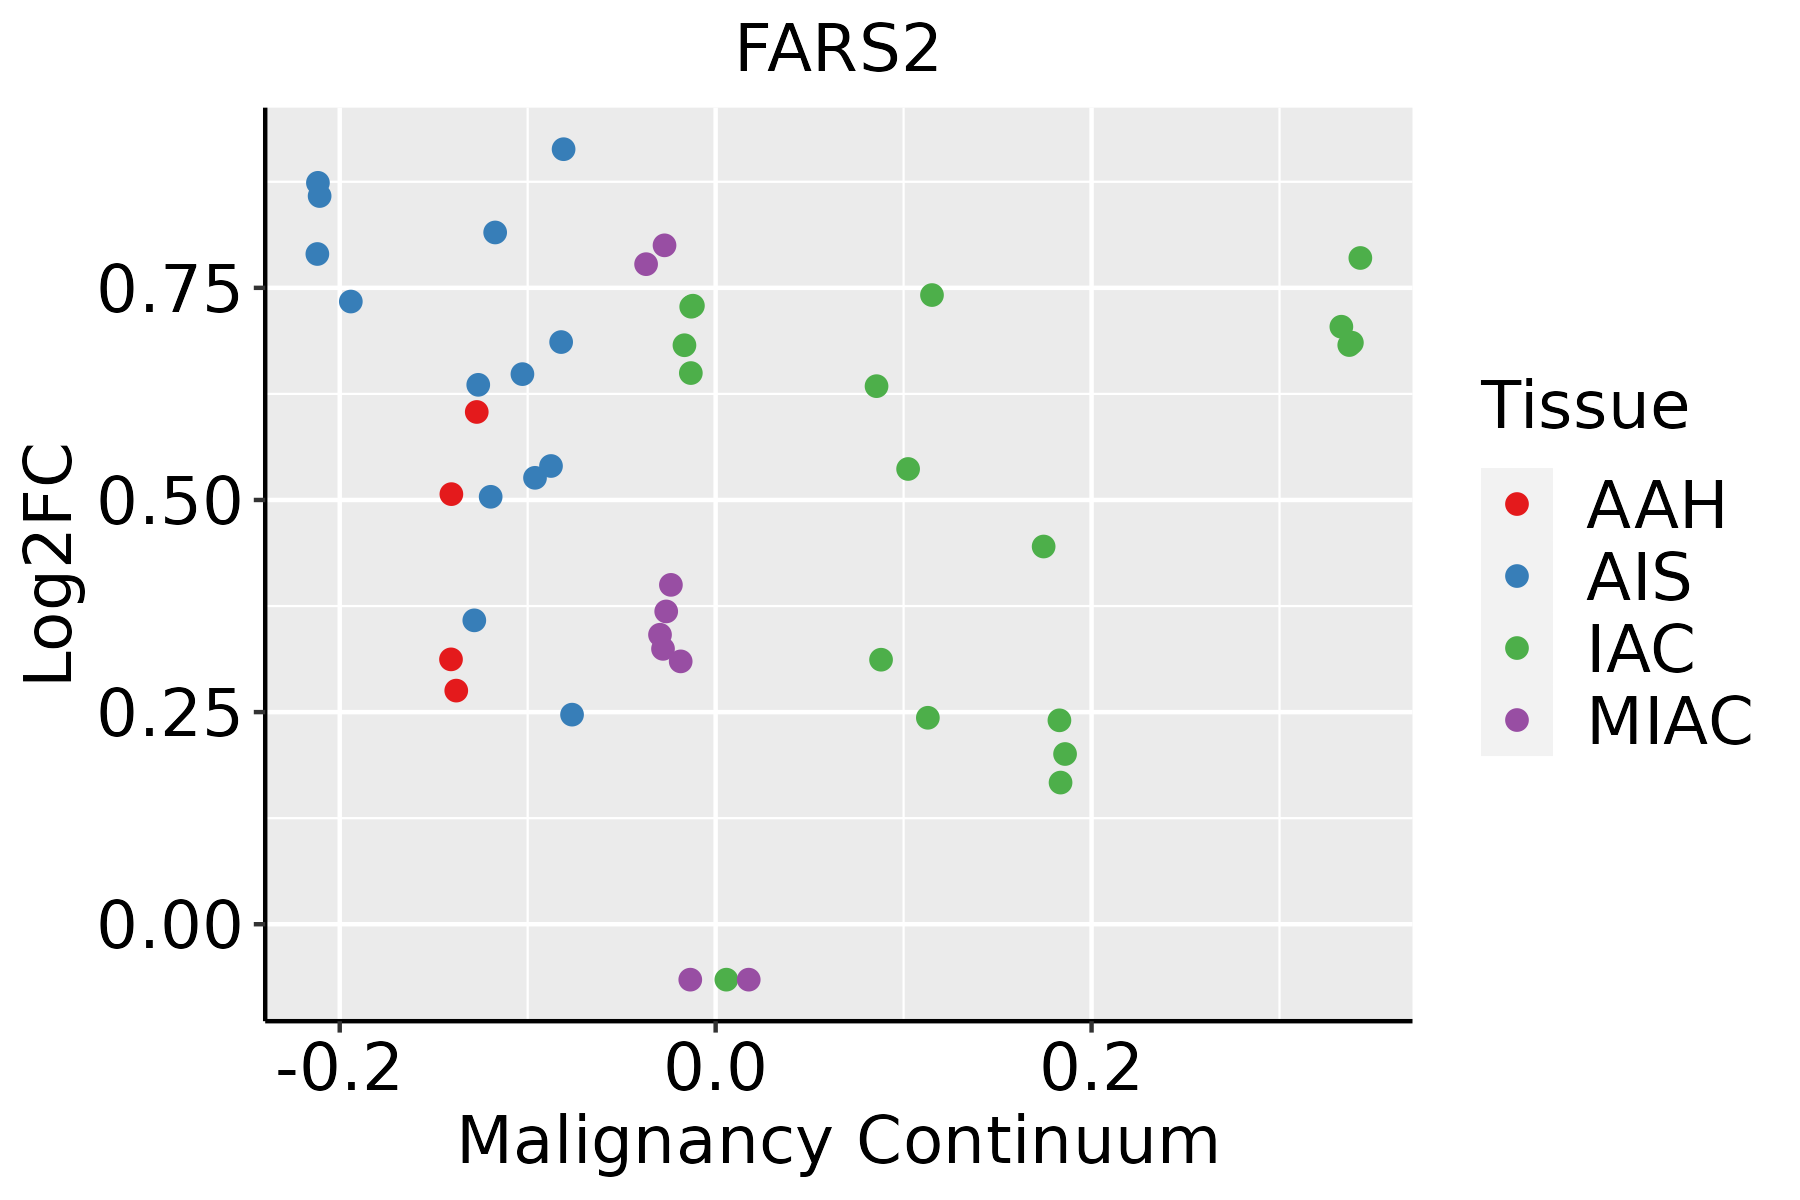 | AAH: Atypical adenomatous hyperplasia |
| AIS: Adenocarcinoma in situ | ||
| IAC: Invasive lung adenocarcinoma | ||
| MIA: Minimally invasive adenocarcinoma | ||
| Oral Cavity |  | EOLP: Erosive Oral lichen planus |
| LP: leukoplakia | ||
| NEOLP: Non-erosive oral lichen planus | ||
| OSCC: Oral squamous cell carcinoma |
| ∗log2FC in expression of this searched gene in stem-like cells from each diseased tissue sample relative to stem-like cells in normal samples in each tissue plotted against the malignancy continuum. Samples are colored based on if they are from different disease stage. |
Top |
Malignant transformation related pathway analysis |
| Find out the enriched GO biological processes and KEGG pathways involved in transition from healthy to precancer to cancer |
| Tissue | Disease Stage | Enriched GO biological Processes |
| Colorectum | AD |  |
| Colorectum | SER |  |
| Colorectum | MSS |  |
| Colorectum | MSI-H |  |
| Colorectum | FAP |  |
| ∗Top 15 enriched GO BP terms are showed in the bar plot of each disease state in each tissue. Each row represents a significant GO biological process which is colored according to the -log10(p.adjust). |
| Page: 1 2 3 4 5 6 7 8 9 |
| GO ID | Tissue | Disease Stage | Description | Gene Ratio | Bg Ratio | pvalue | p.adjust | Count |
| GO:0006418 | Colorectum | AD | tRNA aminoacylation for protein translation | 19/3918 | 41/18723 | 2.37e-04 | 3.03e-03 | 19 |
| GO:0043039 | Colorectum | AD | tRNA aminoacylation | 19/3918 | 44/18723 | 7.13e-04 | 7.21e-03 | 19 |
| GO:0043038 | Colorectum | AD | amino acid activation | 19/3918 | 45/18723 | 9.94e-04 | 9.28e-03 | 19 |
| GO:0006520 | Colorectum | AD | cellular amino acid metabolic process | 81/3918 | 284/18723 | 1.37e-03 | 1.19e-02 | 81 |
| GO:00064181 | Colorectum | SER | tRNA aminoacylation for protein translation | 17/2897 | 41/18723 | 5.75e-05 | 1.35e-03 | 17 |
| GO:00430391 | Colorectum | SER | tRNA aminoacylation | 17/2897 | 44/18723 | 1.64e-04 | 3.12e-03 | 17 |
| GO:00430381 | Colorectum | SER | amino acid activation | 17/2897 | 45/18723 | 2.25e-04 | 3.91e-03 | 17 |
| GO:00065201 | Colorectum | SER | cellular amino acid metabolic process | 61/2897 | 284/18723 | 4.20e-03 | 3.41e-02 | 61 |
| GO:00344707 | Endometrium | AEH | ncRNA processing | 62/2100 | 395/18723 | 3.93e-03 | 2.65e-02 | 62 |
| GO:003447012 | Endometrium | EEC | ncRNA processing | 63/2168 | 395/18723 | 5.20e-03 | 3.26e-02 | 63 |
| GO:003447015 | Esophagus | ESCC | ncRNA processing | 300/8552 | 395/18723 | 3.09e-35 | 3.26e-32 | 300 |
| GO:003466012 | Esophagus | ESCC | ncRNA metabolic process | 346/8552 | 485/18723 | 4.35e-31 | 2.51e-28 | 346 |
| GO:00080333 | Esophagus | ESCC | tRNA processing | 92/8552 | 127/18723 | 7.83e-10 | 1.93e-08 | 92 |
| GO:00063992 | Esophagus | ESCC | tRNA metabolic process | 122/8552 | 179/18723 | 9.03e-10 | 2.19e-08 | 122 |
| GO:00344709 | Oral cavity | OSCC | ncRNA processing | 263/7305 | 395/18723 | 4.38e-29 | 2.78e-26 | 263 |
| GO:00346605 | Oral cavity | OSCC | ncRNA metabolic process | 296/7305 | 485/18723 | 2.94e-23 | 6.65e-21 | 296 |
| GO:00080332 | Oral cavity | OSCC | tRNA processing | 78/7305 | 127/18723 | 2.56e-07 | 4.00e-06 | 78 |
| GO:00063991 | Oral cavity | OSCC | tRNA metabolic process | 101/7305 | 179/18723 | 1.65e-06 | 2.15e-05 | 101 |
| GO:003447014 | Oral cavity | LP | ncRNA processing | 184/4623 | 395/18723 | 1.20e-21 | 3.12e-19 | 184 |
| GO:003466011 | Oral cavity | LP | ncRNA metabolic process | 205/4623 | 485/18723 | 6.46e-18 | 1.09e-15 | 205 |
| Page: 1 2 |
| Pathway ID | Tissue | Disease Stage | Description | Gene Ratio | Bg Ratio | pvalue | p.adjust | qvalue | Count |
| Page: 1 |
Top |
Cell-cell communication analysis |
| Identification of potential cell-cell interactions between two cell types and their ligand-receptor pairs for different disease states |
| Ligand | Receptor | LRpair | Pathway | Tissue | Disease Stage |
| Page: 1 |
Top |
Single-cell gene regulatory network inference analysis |
| Find out the significant the regulons (TFs) and the target genes of each regulon across cell types for different disease states |
| TF | Cell Type | Tissue | Disease Stage | Target Gene | RSS | Regulon Activity |
| ∗The dot plots of a searched regulon are shown for all cell subpopulations in each disease state of each tissue based on the regulon specific score inferred using pySCENIC and by calculating the average expression. |
| Page: 1 |
Top |
Somatic mutation of malignant transformation related genes |
| Annotation of somatic variants for genes involved in malignant transformation |
| Hugo Symbol | Variant Class | Variant Classification | dbSNP RS | HGVSc | HGVSp | HGVSp Short | SWISSPROT | BIOTYPE | SIFT | PolyPhen | Tumor Sample Barcode | Tissue | Histology | Sex | Age | Stage | Therapy Types | Drugs | Outcome |
| FARS2 | SNV | Missense_Mutation | c.859N>C | p.Glu287Gln | p.E287Q | O95363 | protein_coding | deleterious(0) | possibly_damaging(0.556) | TCGA-A2-A04P-01 | Breast | breast invasive carcinoma | Female | <65 | III/IV | Chemotherapy | taxol | PD | |
| FARS2 | SNV | Missense_Mutation | novel | c.1228N>C | p.Thr410Pro | p.T410P | O95363 | protein_coding | tolerated(0.15) | possibly_damaging(0.468) | TCGA-A2-A0SU-01 | Breast | breast invasive carcinoma | Female | >=65 | I/II | Hormone Therapy | arimidex | SD |
| FARS2 | SNV | Missense_Mutation | c.949G>C | p.Glu317Gln | p.E317Q | O95363 | protein_coding | deleterious(0) | probably_damaging(0.994) | TCGA-A2-A0YK-01 | Breast | breast invasive carcinoma | Female | <65 | I/II | Chemotherapy | cytoxan | SD | |
| FARS2 | SNV | Missense_Mutation | c.1107C>A | p.Phe369Leu | p.F369L | O95363 | protein_coding | deleterious(0) | probably_damaging(0.999) | TCGA-AN-A046-01 | Breast | breast invasive carcinoma | Female | >=65 | I/II | Unknown | Unknown | SD | |
| FARS2 | insertion | Frame_Shift_Ins | novel | c.477_478insAGAACTTTGACAGCCTGCT | p.Gln160ArgfsTer23 | p.Q160Rfs*23 | O95363 | protein_coding | TCGA-BH-A0AY-01 | Breast | breast invasive carcinoma | Female | <65 | I/II | Chemotherapy | SD | |||
| FARS2 | SNV | Missense_Mutation | c.1143N>G | p.Phe381Leu | p.F381L | O95363 | protein_coding | deleterious(0.04) | probably_damaging(0.998) | TCGA-DG-A2KK-01 | Cervix | cervical & endocervical cancer | Female | <65 | III/IV | Chemotherapy | cisplatin | SD | |
| FARS2 | SNV | Missense_Mutation | novel | c.806C>A | p.Pro269His | p.P269H | O95363 | protein_coding | deleterious(0) | probably_damaging(0.999) | TCGA-VS-A9U6-01 | Cervix | cervical & endocervical cancer | Female | <65 | I/II | Chemotherapy | cisplatin | PD |
| FARS2 | SNV | Missense_Mutation | rs746837108 | c.1013G>A | p.Arg338His | p.R338H | O95363 | protein_coding | tolerated(0.09) | possibly_damaging(0.858) | TCGA-5M-AAT6-01 | Colorectum | colon adenocarcinoma | Female | <65 | III/IV | Unknown | Unknown | PD |
| FARS2 | SNV | Missense_Mutation | c.724N>C | p.Asp242His | p.D242H | O95363 | protein_coding | tolerated(0.23) | probably_damaging(0.935) | TCGA-A6-6650-01 | Colorectum | colon adenocarcinoma | Female | >=65 | I/II | Unknown | Unknown | SD | |
| FARS2 | SNV | Missense_Mutation | c.793G>C | p.Asp265His | p.D265H | O95363 | protein_coding | deleterious(0) | probably_damaging(0.912) | TCGA-A6-6782-01 | Colorectum | colon adenocarcinoma | Male | >=65 | I/II | Unknown | Unknown | SD |
| Page: 1 2 3 4 5 |
Top |
Related drugs of malignant transformation related genes |
| Identification of chemicals and drugs interact with genes involved in malignant transfromation |
| (DGIdb 4.0) |
| Entrez ID | Symbol | Category | Interaction Types | Drug Claim Name | Drug Name | PMIDs |
| Page: 1 |

Copyright 2023-Present -The University of Texas Health Science Center at Houston |