
|
|||||
|
 | |
| |
| |
| |
| |
| |
|
Gene: FARP1 |
Gene summary for FARP1 |
| Gene information | Species | Human | Gene symbol | FARP1 | Gene ID | 10160 |
| Gene name | FERM, ARH/RhoGEF and pleckstrin domain protein 1 | |
| Gene Alias | CDEP | |
| Cytomap | 13q32.2 | |
| Gene Type | protein-coding | GO ID | GO:0000902 | UniProtAcc | Q9Y4F1 |
Top |
Malignant transformation analysis |
| Identification of the aberrant gene expression in precancerous and cancerous lesions by comparing the gene expression of stem-like cells in diseased tissues with normal stem cells |
| Entrez ID | Symbol | Replicates | Species | Organ | Tissue | Adj P-value | Log2FC | Malignancy |
| 10160 | FARP1 | HTA11_3410_2000001011 | Human | Colorectum | AD | 3.84e-20 | -6.31e-01 | 0.0155 |
| 10160 | FARP1 | HTA11_2487_2000001011 | Human | Colorectum | SER | 4.93e-03 | -4.83e-01 | -0.1808 |
| 10160 | FARP1 | HTA11_1938_2000001011 | Human | Colorectum | AD | 5.63e-06 | -6.19e-01 | -0.0811 |
| 10160 | FARP1 | HTA11_3361_2000001011 | Human | Colorectum | AD | 4.55e-08 | -6.15e-01 | -0.1207 |
| 10160 | FARP1 | HTA11_696_2000001011 | Human | Colorectum | AD | 4.59e-02 | -2.85e-01 | -0.1464 |
| 10160 | FARP1 | HTA11_1391_2000001011 | Human | Colorectum | AD | 1.10e-06 | -5.01e-01 | -0.059 |
| 10160 | FARP1 | HTA11_7862_2000001011 | Human | Colorectum | AD | 2.64e-02 | -5.34e-01 | -0.0179 |
| 10160 | FARP1 | HTA11_866_3004761011 | Human | Colorectum | AD | 2.34e-02 | -3.53e-01 | 0.096 |
| 10160 | FARP1 | HTA11_8622_2000001021 | Human | Colorectum | SER | 4.11e-03 | -5.72e-01 | 0.0528 |
| 10160 | FARP1 | HTA11_10711_2000001011 | Human | Colorectum | AD | 2.93e-04 | -3.95e-01 | 0.0338 |
| 10160 | FARP1 | HTA11_7696_3000711011 | Human | Colorectum | AD | 2.70e-03 | -3.10e-01 | 0.0674 |
| 10160 | FARP1 | HTA11_99999970781_79442 | Human | Colorectum | MSS | 4.97e-02 | -1.90e-01 | 0.294 |
| 10160 | FARP1 | HTA11_99999971662_82457 | Human | Colorectum | MSS | 1.76e-07 | 7.60e-01 | 0.3859 |
| 10160 | FARP1 | HTA11_99999974143_84620 | Human | Colorectum | MSS | 2.49e-10 | -4.03e-01 | 0.3005 |
| 10160 | FARP1 | A001-C-207 | Human | Colorectum | FAP | 3.27e-05 | -3.31e-01 | 0.1278 |
| 10160 | FARP1 | A015-C-203 | Human | Colorectum | FAP | 3.80e-26 | -3.78e-01 | -0.1294 |
| 10160 | FARP1 | A015-C-204 | Human | Colorectum | FAP | 3.34e-04 | -2.75e-01 | -0.0228 |
| 10160 | FARP1 | A014-C-040 | Human | Colorectum | FAP | 2.00e-04 | -4.89e-01 | -0.1184 |
| 10160 | FARP1 | A002-C-201 | Human | Colorectum | FAP | 1.42e-12 | -3.68e-01 | 0.0324 |
| 10160 | FARP1 | A001-C-108 | Human | Colorectum | FAP | 4.28e-17 | -3.78e-01 | -0.0272 |
| Page: 1 2 3 4 5 6 7 8 9 |
| Tissue | Expression Dynamics | Abbreviation |
| Colorectum (GSE201348) |  | FAP: Familial adenomatous polyposis |
| CRC: Colorectal cancer | ||
| Colorectum (HTA11) |  | AD: Adenomas |
| SER: Sessile serrated lesions | ||
| MSI-H: Microsatellite-high colorectal cancer | ||
| MSS: Microsatellite stable colorectal cancer | ||
| Esophagus |  | ESCC: Esophageal squamous cell carcinoma |
| HGIN: High-grade intraepithelial neoplasias | ||
| LGIN: Low-grade intraepithelial neoplasias | ||
| Liver | 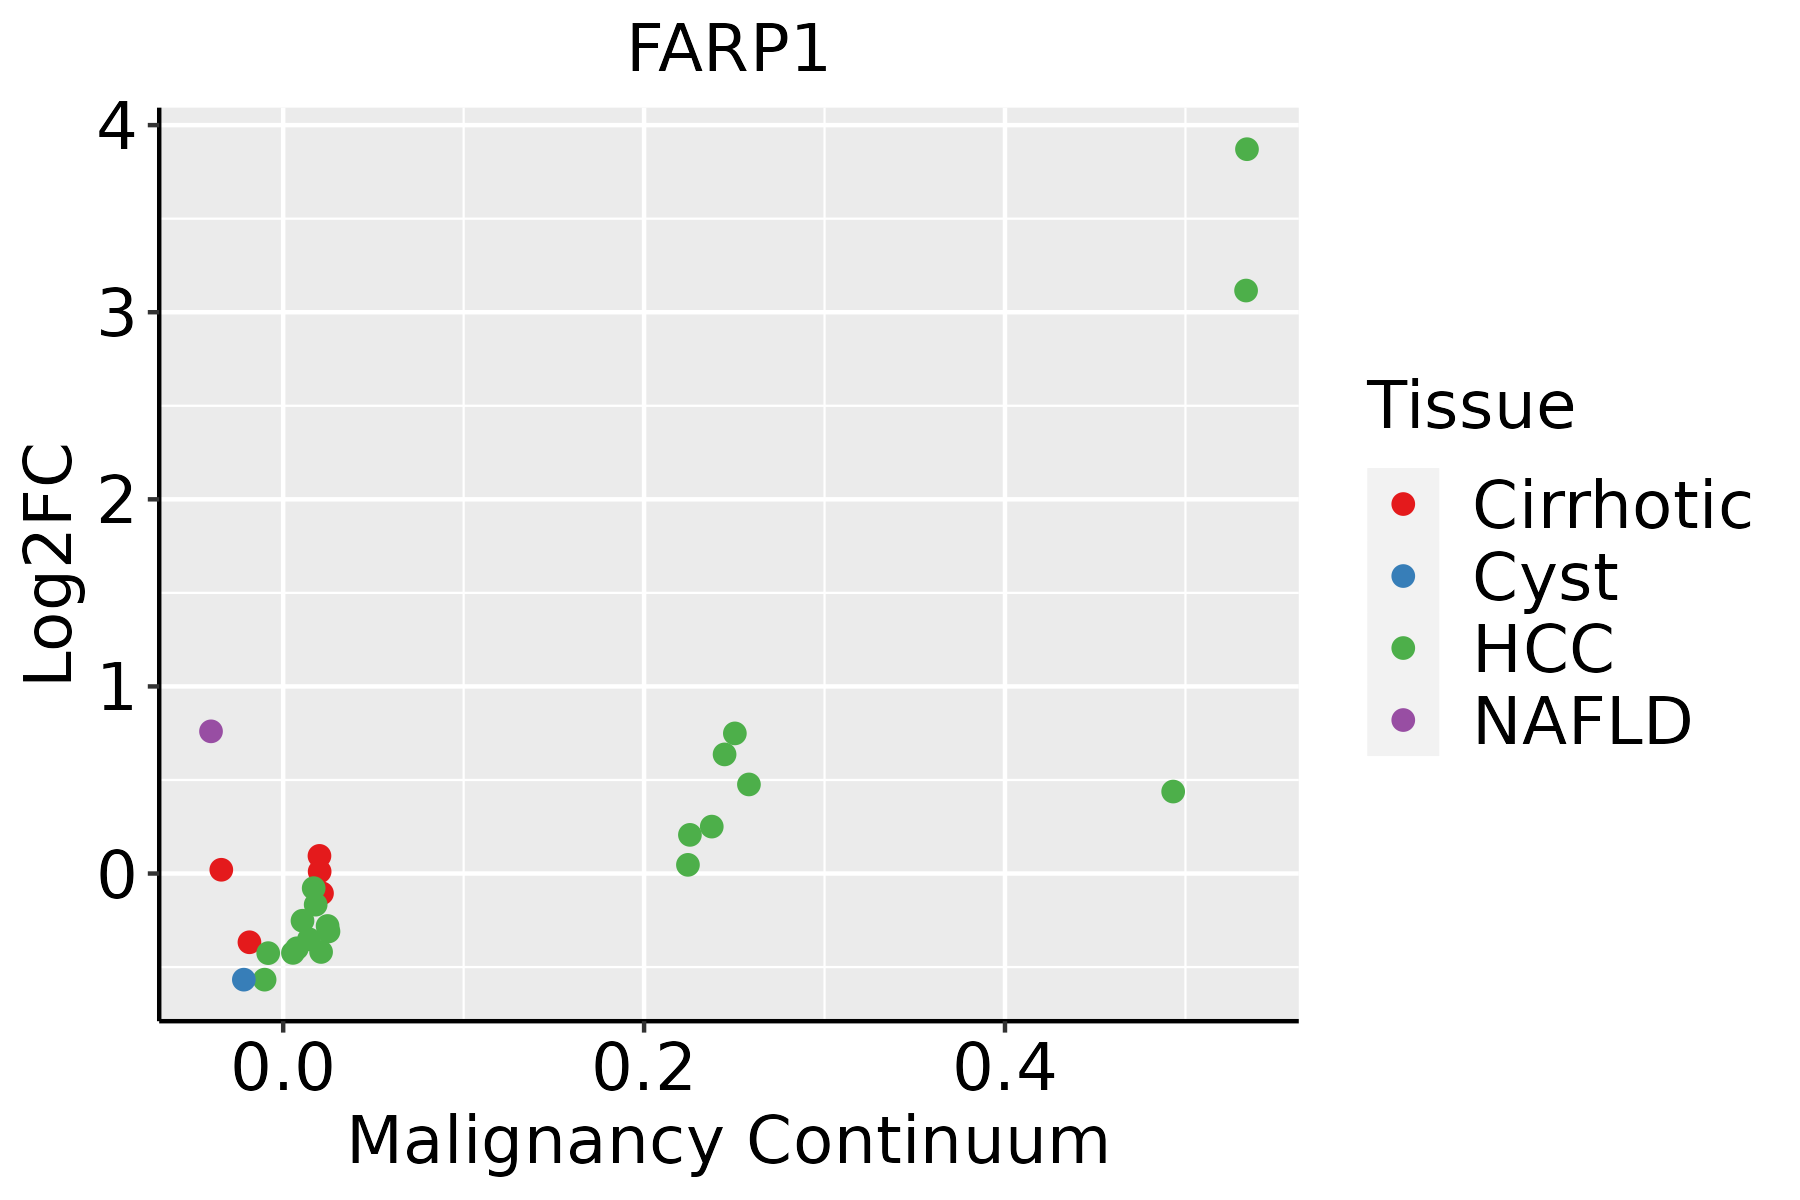 | HCC: Hepatocellular carcinoma |
| NAFLD: Non-alcoholic fatty liver disease | ||
| Lung | 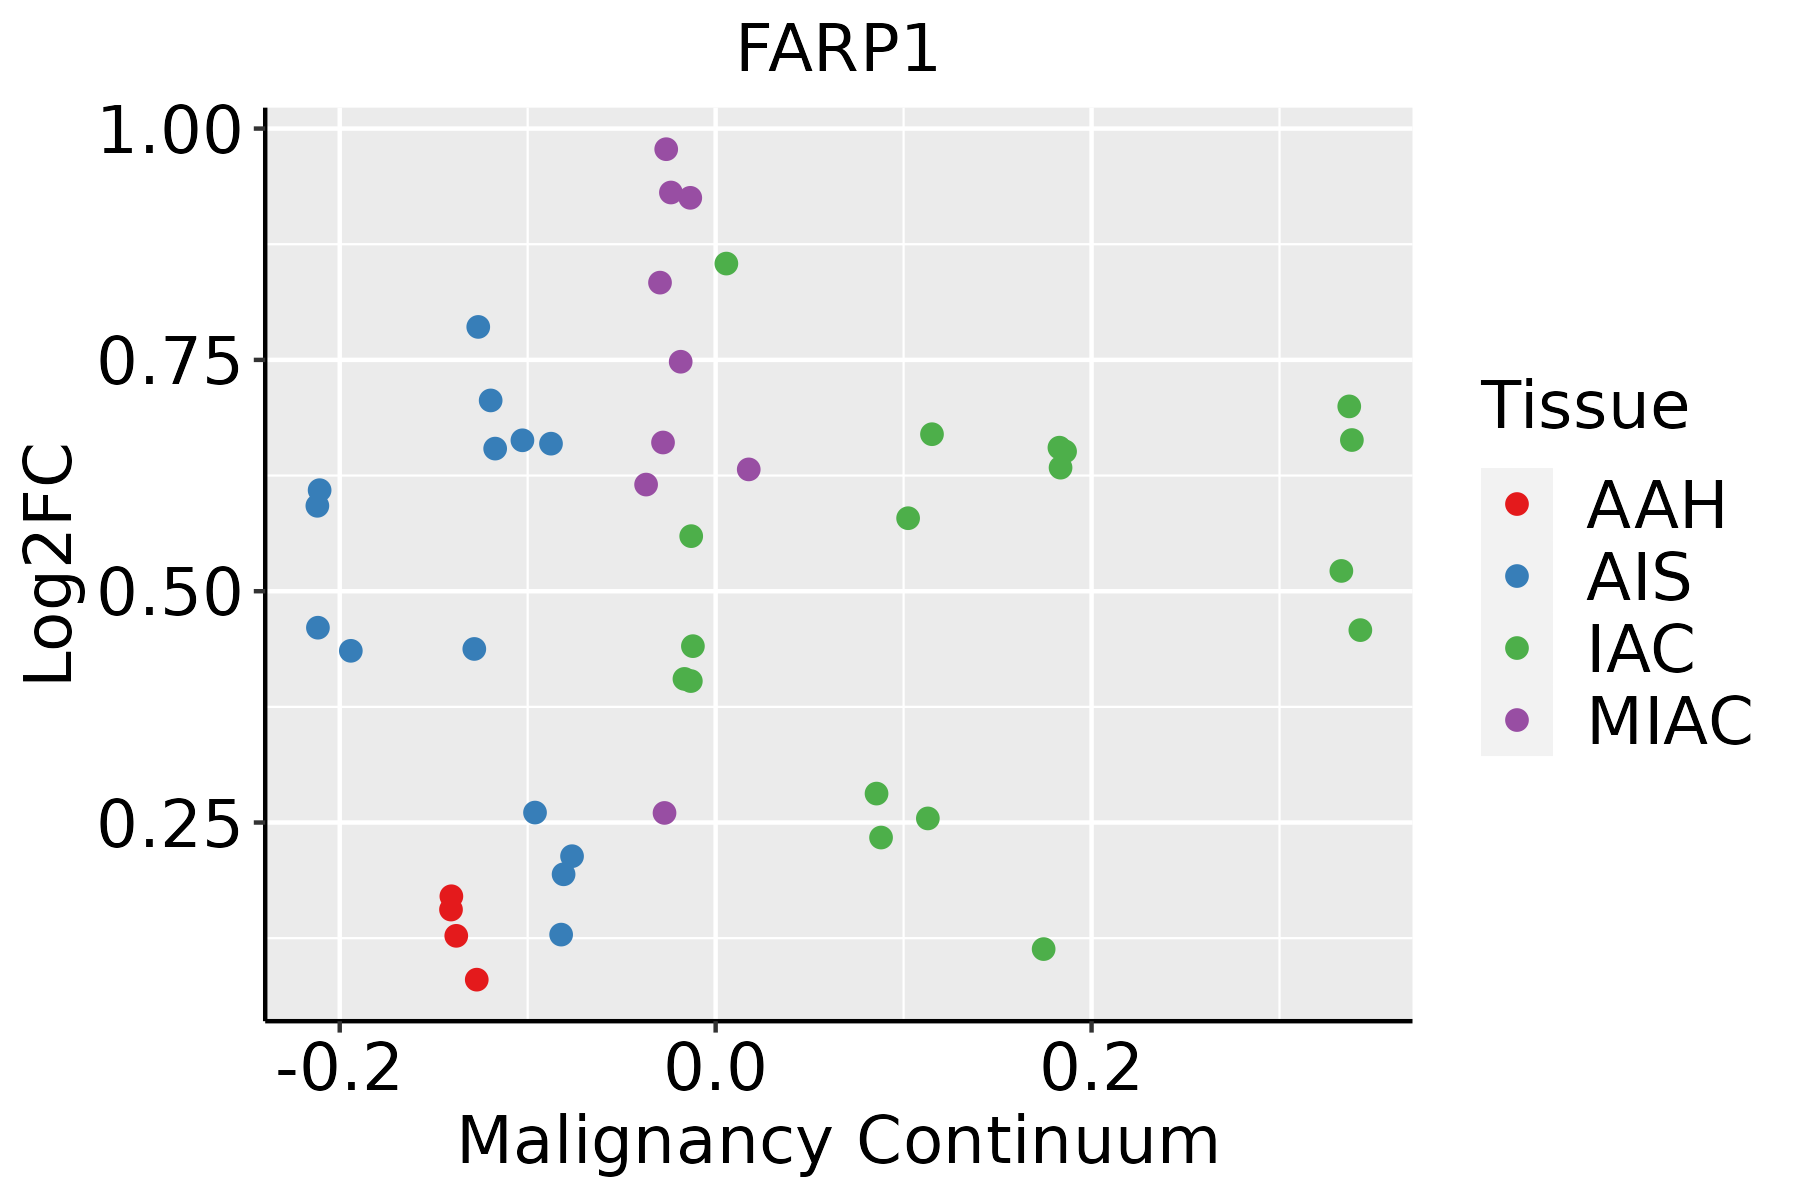 | AAH: Atypical adenomatous hyperplasia |
| AIS: Adenocarcinoma in situ | ||
| IAC: Invasive lung adenocarcinoma | ||
| MIA: Minimally invasive adenocarcinoma | ||
| Oral Cavity | 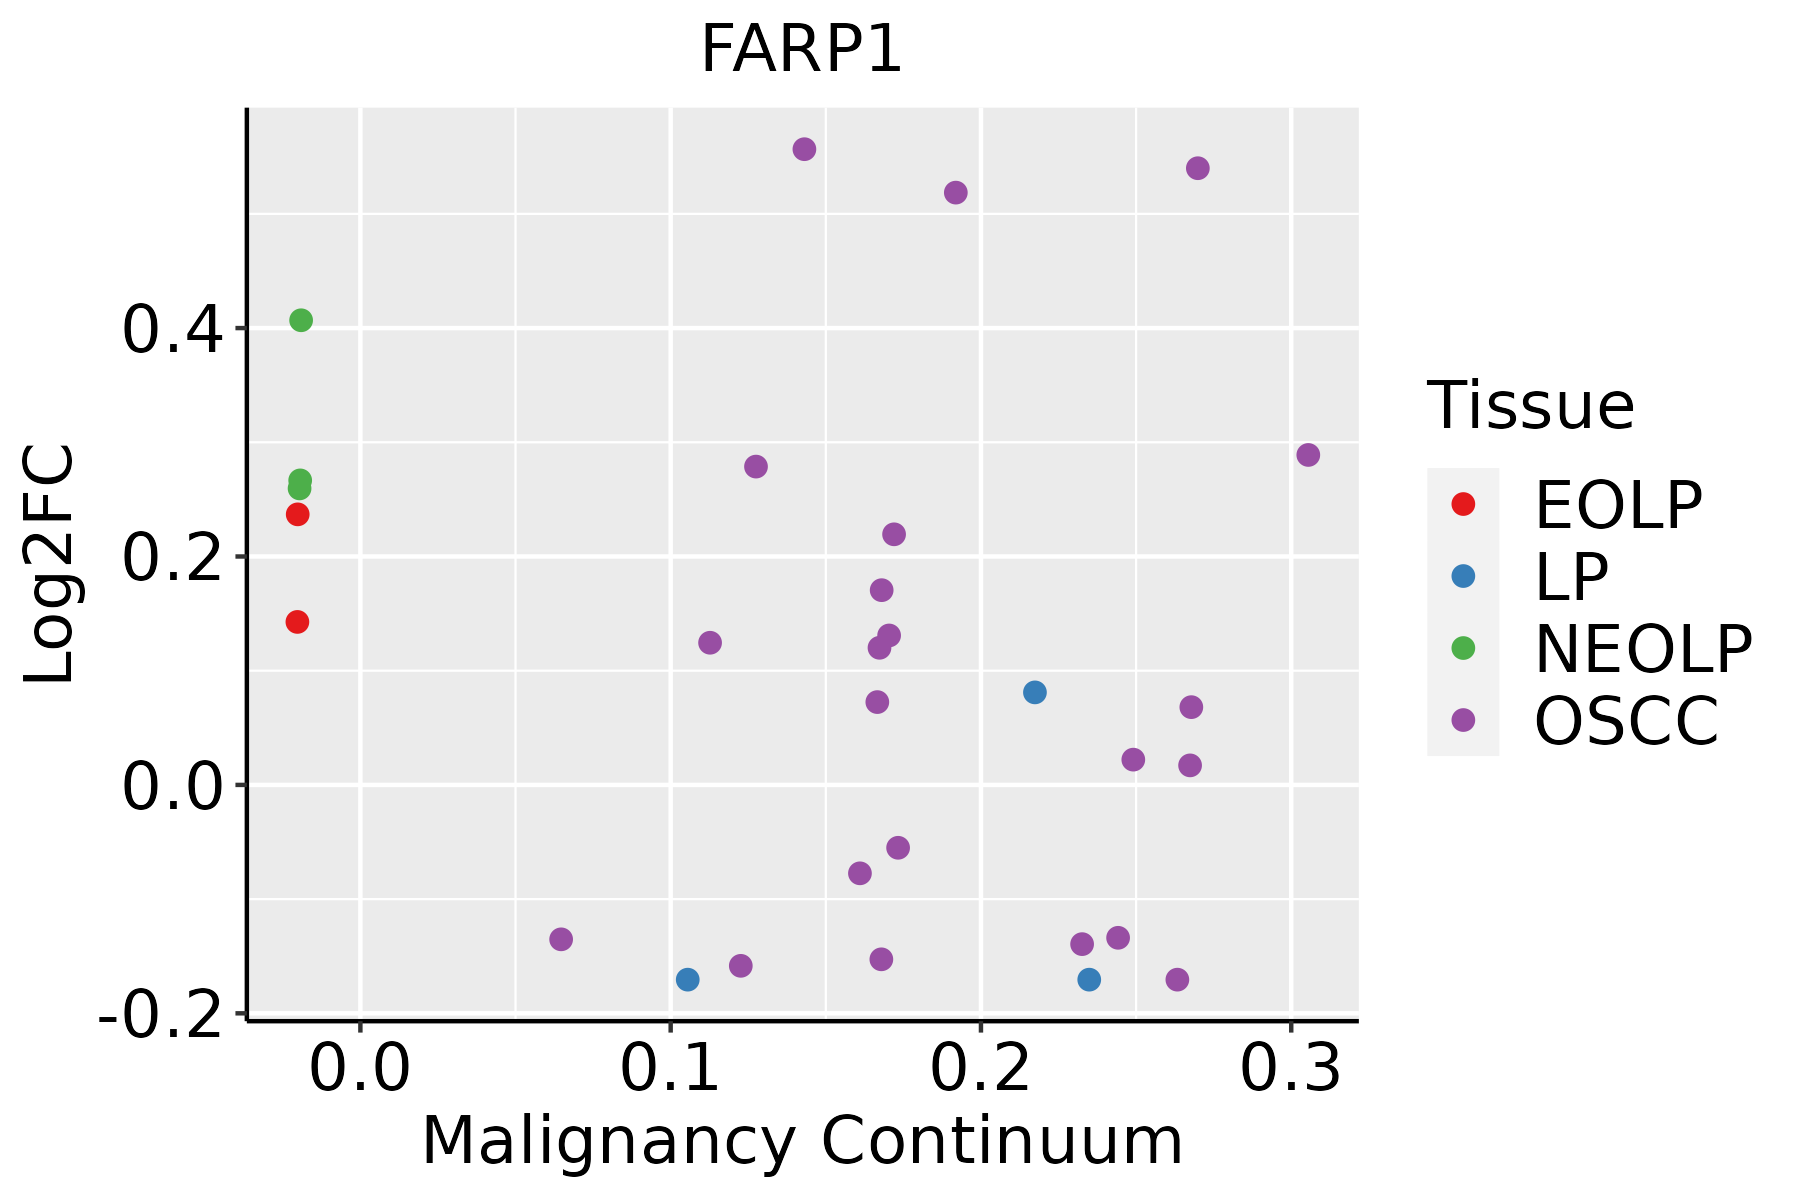 | EOLP: Erosive Oral lichen planus |
| LP: leukoplakia | ||
| NEOLP: Non-erosive oral lichen planus | ||
| OSCC: Oral squamous cell carcinoma | ||
| Prostate | 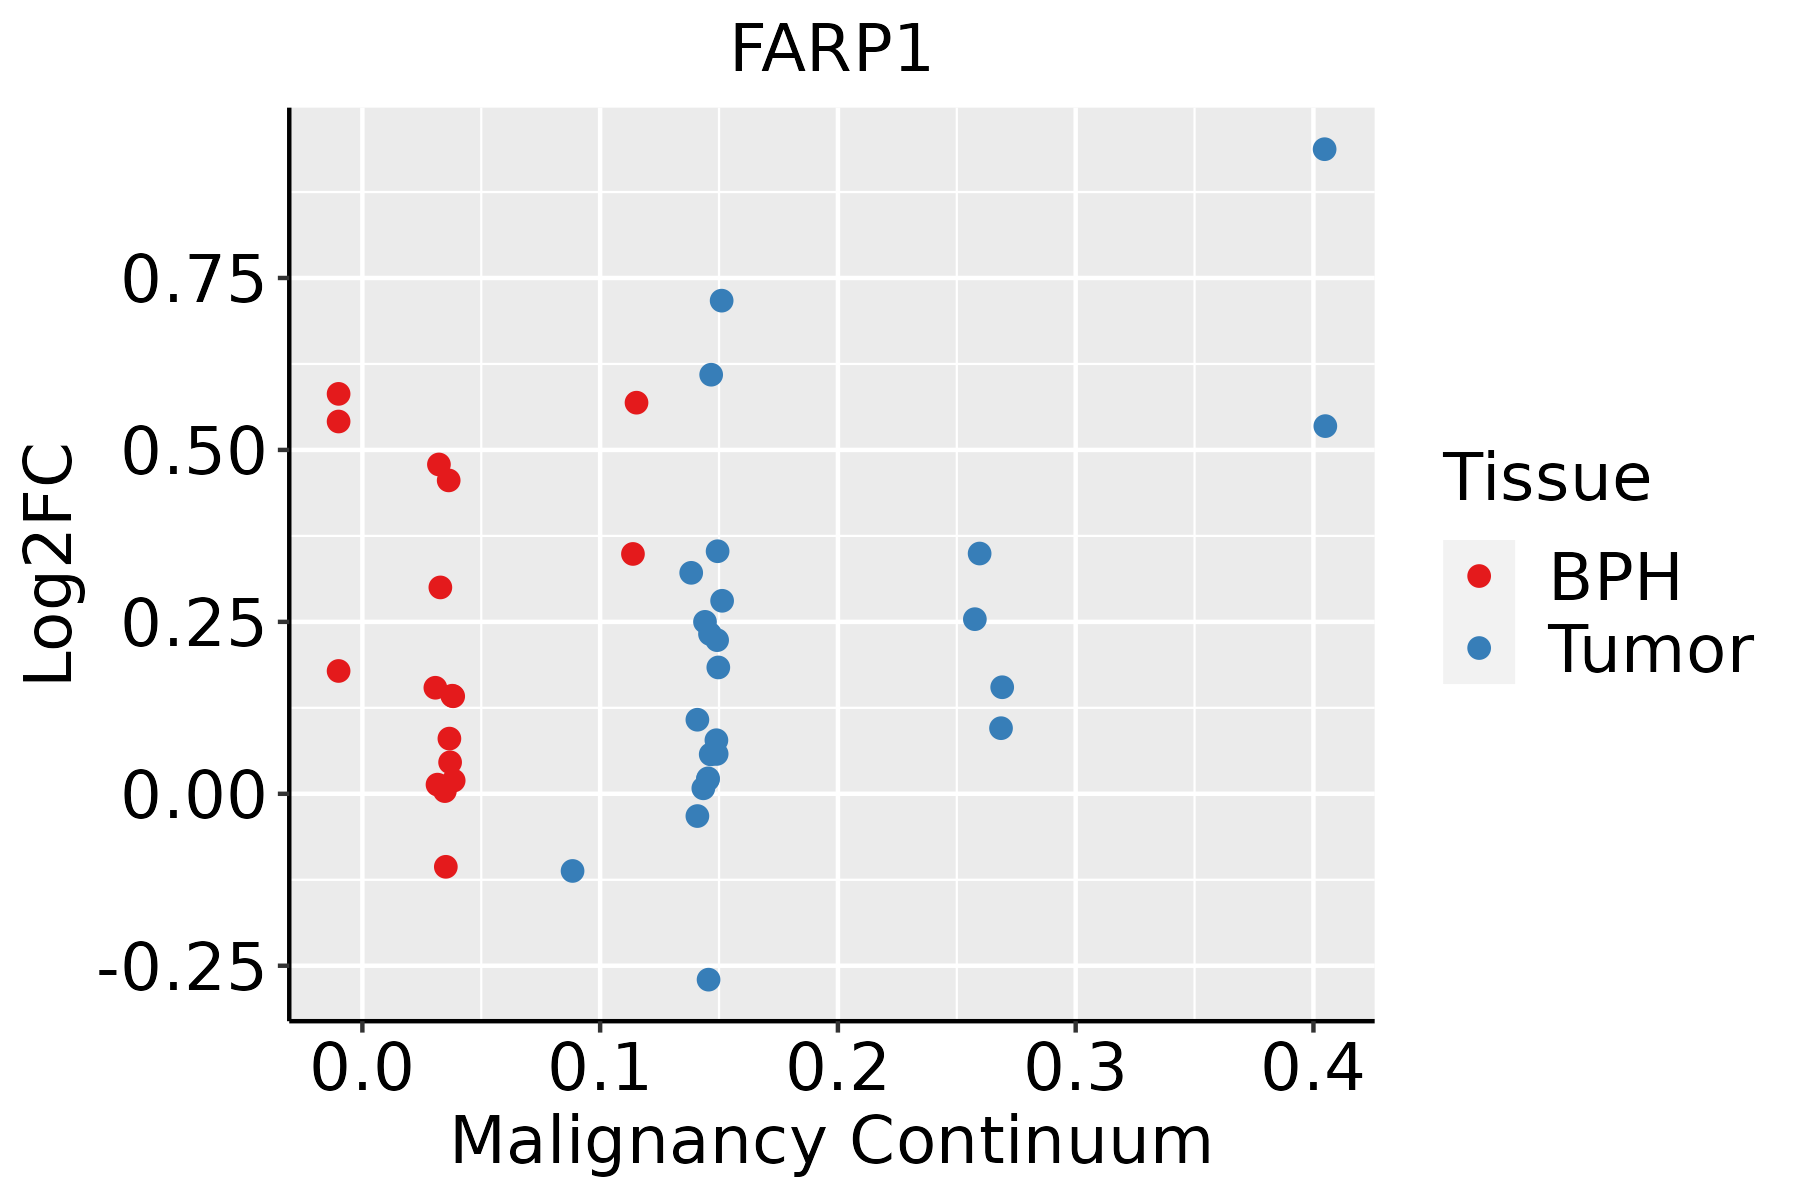 | BPH: Benign Prostatic Hyperplasia |
| Thyroid |  | ATC: Anaplastic thyroid cancer |
| HT: Hashimoto's thyroiditis | ||
| PTC: Papillary thyroid cancer |
| ∗log2FC in expression of this searched gene in stem-like cells from each diseased tissue sample relative to stem-like cells in normal samples in each tissue plotted against the malignancy continuum. Samples are colored based on if they are from different disease stage. |
Top |
Malignant transformation related pathway analysis |
| Find out the enriched GO biological processes and KEGG pathways involved in transition from healthy to precancer to cancer |
| Tissue | Disease Stage | Enriched GO biological Processes |
| Colorectum | AD |  |
| Colorectum | SER |  |
| Colorectum | MSS |  |
| Colorectum | MSI-H |  |
| Colorectum | FAP |  |
| ∗Top 15 enriched GO BP terms are showed in the bar plot of each disease state in each tissue. Each row represents a significant GO biological process which is colored according to the -log10(p.adjust). |
| Page: 1 2 3 4 5 6 7 8 9 |
| GO ID | Tissue | Disease Stage | Description | Gene Ratio | Bg Ratio | pvalue | p.adjust | Count |
| GO:0034329 | Colorectum | AD | cell junction assembly | 136/3918 | 420/18723 | 2.02e-08 | 1.15e-06 | 136 |
| GO:1901888 | Colorectum | AD | regulation of cell junction assembly | 61/3918 | 204/18723 | 1.50e-03 | 1.27e-02 | 61 |
| GO:0099173 | Colorectum | AD | postsynapse organization | 51/3918 | 168/18723 | 2.47e-03 | 1.90e-02 | 51 |
| GO:0016358 | Colorectum | AD | dendrite development | 69/3918 | 243/18723 | 3.32e-03 | 2.42e-02 | 69 |
| GO:0050808 | Colorectum | AD | synapse organization | 112/3918 | 426/18723 | 4.25e-03 | 2.92e-02 | 112 |
| GO:0098974 | Colorectum | AD | postsynaptic actin cytoskeleton organization | 7/3918 | 12/18723 | 5.09e-03 | 3.38e-02 | 7 |
| GO:0050807 | Colorectum | AD | regulation of synapse organization | 60/3918 | 211/18723 | 5.67e-03 | 3.64e-02 | 60 |
| GO:00343291 | Colorectum | SER | cell junction assembly | 100/2897 | 420/18723 | 4.23e-06 | 1.61e-04 | 100 |
| GO:00991731 | Colorectum | SER | postsynapse organization | 46/2897 | 168/18723 | 5.20e-05 | 1.25e-03 | 46 |
| GO:00163581 | Colorectum | SER | dendrite development | 58/2897 | 243/18723 | 3.82e-04 | 5.81e-03 | 58 |
| GO:00989741 | Colorectum | SER | postsynaptic actin cytoskeleton organization | 7/2897 | 12/18723 | 8.12e-04 | 1.01e-02 | 7 |
| GO:0048813 | Colorectum | SER | dendrite morphogenesis | 36/2897 | 146/18723 | 2.51e-03 | 2.33e-02 | 36 |
| GO:0099188 | Colorectum | SER | postsynaptic cytoskeleton organization | 7/2897 | 14/18723 | 2.64e-03 | 2.41e-02 | 7 |
| GO:19018881 | Colorectum | SER | regulation of cell junction assembly | 46/2897 | 204/18723 | 4.70e-03 | 3.70e-02 | 46 |
| GO:00508081 | Colorectum | SER | synapse organization | 85/2897 | 426/18723 | 7.17e-03 | 4.99e-02 | 85 |
| GO:00343292 | Colorectum | MSS | cell junction assembly | 120/3467 | 420/18723 | 2.51e-07 | 1.07e-05 | 120 |
| GO:00991732 | Colorectum | MSS | postsynapse organization | 48/3467 | 168/18723 | 9.32e-04 | 9.44e-03 | 48 |
| GO:00163582 | Colorectum | MSS | dendrite development | 65/3467 | 243/18723 | 9.41e-04 | 9.50e-03 | 65 |
| GO:00989742 | Colorectum | MSS | postsynaptic actin cytoskeleton organization | 7/3467 | 12/18723 | 2.45e-03 | 1.97e-02 | 7 |
| GO:00508082 | Colorectum | MSS | synapse organization | 101/3467 | 426/18723 | 3.96e-03 | 2.89e-02 | 101 |
| Page: 1 2 3 4 5 6 |
| Pathway ID | Tissue | Disease Stage | Description | Gene Ratio | Bg Ratio | pvalue | p.adjust | qvalue | Count |
| Page: 1 |
Top |
Cell-cell communication analysis |
| Identification of potential cell-cell interactions between two cell types and their ligand-receptor pairs for different disease states |
| Ligand | Receptor | LRpair | Pathway | Tissue | Disease Stage |
| Page: 1 |
Top |
Single-cell gene regulatory network inference analysis |
| Find out the significant the regulons (TFs) and the target genes of each regulon across cell types for different disease states |
| TF | Cell Type | Tissue | Disease Stage | Target Gene | RSS | Regulon Activity |
| ∗The dot plots of a searched regulon are shown for all cell subpopulations in each disease state of each tissue based on the regulon specific score inferred using pySCENIC and by calculating the average expression. |
| Page: 1 |
Top |
Somatic mutation of malignant transformation related genes |
| Annotation of somatic variants for genes involved in malignant transformation |
| Hugo Symbol | Variant Class | Variant Classification | dbSNP RS | HGVSc | HGVSp | HGVSp Short | SWISSPROT | BIOTYPE | SIFT | PolyPhen | Tumor Sample Barcode | Tissue | Histology | Sex | Age | Stage | Therapy Types | Drugs | Outcome |
| FARP1 | SNV | Missense_Mutation | c.958N>A | p.Glu320Lys | p.E320K | protein_coding | deleterious(0.01) | probably_damaging(0.985) | TCGA-AN-A0XW-01 | Breast | breast invasive carcinoma | Female | <65 | III/IV | Unknown | Unknown | SD | ||
| FARP1 | SNV | Missense_Mutation | rs142356955 | c.1513G>A | p.Asp505Asn | p.D505N | protein_coding | tolerated(0.43) | benign(0.133) | TCGA-AO-A0J6-01 | Breast | breast invasive carcinoma | Female | <65 | I/II | Chemotherapy | doxorubicin | SD | |
| FARP1 | SNV | Missense_Mutation | rs745947051 | c.2780C>T | p.Ser927Leu | p.S927L | protein_coding | tolerated(0.19) | benign(0.155) | TCGA-BH-A0B6-01 | Breast | breast invasive carcinoma | Female | <65 | I/II | Unknown | Unknown | SD | |
| FARP1 | SNV | Missense_Mutation | rs765023336 | c.3140N>T | p.Thr1047Met | p.T1047M | protein_coding | deleterious(0.02) | probably_damaging(0.924) | TCGA-D8-A1XQ-01 | Breast | breast invasive carcinoma | Female | >=65 | I/II | Unknown | Unknown | SD | |
| FARP1 | SNV | Missense_Mutation | rs758237923 | c.532N>C | p.Glu178Gln | p.E178Q | protein_coding | tolerated(0.21) | benign(0.068) | TCGA-PL-A8LV-01 | Breast | breast invasive carcinoma | Female | <65 | III/IV | Unknown | Unknown | SD | |
| FARP1 | insertion | Nonsense_Mutation | novel | c.1807_1808insTGTTTTAACAAAGGAACAGAGATGGAAGTTCTTA | p.Glu603ValfsTer3 | p.E603Vfs*3 | protein_coding | TCGA-A2-A0EY-01 | Breast | breast invasive carcinoma | Female | <65 | I/II | Chemotherapy | adriamycin | SD | |||
| FARP1 | SNV | Missense_Mutation | rs78636977 | c.589G>A | p.Val197Met | p.V197M | protein_coding | tolerated(1) | benign(0.047) | TCGA-2W-A8YY-01 | Cervix | cervical & endocervical cancer | Female | <65 | I/II | Chemotherapy | cisplatin | CR | |
| FARP1 | SNV | Missense_Mutation | novel | c.649N>C | p.Glu217Gln | p.E217Q | protein_coding | deleterious(0) | probably_damaging(0.995) | TCGA-JW-A5VL-01 | Cervix | cervical & endocervical cancer | Female | <65 | I/II | Unknown | Unknown | SD | |
| FARP1 | SNV | Missense_Mutation | c.250G>C | p.Glu84Gln | p.E84Q | protein_coding | tolerated(0.08) | probably_damaging(0.918) | TCGA-JX-A3Q0-01 | Cervix | cervical & endocervical cancer | Female | <65 | III/IV | Unknown | Unknown | SD | ||
| FARP1 | SNV | Missense_Mutation | rs765401742 | c.1936N>A | p.Glu646Lys | p.E646K | protein_coding | deleterious(0.02) | possibly_damaging(0.809) | TCGA-Q1-A73O-01 | Cervix | cervical & endocervical cancer | Female | <65 | I/II | Chemotherapy | cisplatin | CR |
| Page: 1 2 3 4 5 6 7 8 9 10 11 |
Top |
Related drugs of malignant transformation related genes |
| Identification of chemicals and drugs interact with genes involved in malignant transfromation |
| (DGIdb 4.0) |
| Entrez ID | Symbol | Category | Interaction Types | Drug Claim Name | Drug Name | PMIDs |
| Page: 1 |

Copyright 2023-Present -The University of Texas Health Science Center at Houston |