
|
|||||
|
 | |
| |
| |
| |
| |
| |
|
Gene: FANCL |
Gene summary for FANCL |
| Gene information | Species | Human | Gene symbol | FANCL | Gene ID | 55120 |
| Gene name | FA complementation group L | |
| Gene Alias | FAAP43 | |
| Cytomap | 2p16.1 | |
| Gene Type | protein-coding | GO ID | GO:0000003 | UniProtAcc | Q9NW38 |
Top |
Malignant transformation analysis |
| Identification of the aberrant gene expression in precancerous and cancerous lesions by comparing the gene expression of stem-like cells in diseased tissues with normal stem cells |
| Entrez ID | Symbol | Replicates | Species | Organ | Tissue | Adj P-value | Log2FC | Malignancy |
| 55120 | FANCL | CCI_1 | Human | Cervix | CC | 3.55e-02 | 6.01e-01 | 0.528 |
| 55120 | FANCL | CCI_2 | Human | Cervix | CC | 1.37e-06 | 5.57e-01 | 0.5249 |
| 55120 | FANCL | CCI_3 | Human | Cervix | CC | 4.31e-09 | 5.36e-01 | 0.516 |
| 55120 | FANCL | sample3 | Human | Cervix | CC | 2.54e-04 | 1.92e-01 | 0.1387 |
| 55120 | FANCL | T3 | Human | Cervix | CC | 6.63e-06 | 1.94e-01 | 0.1389 |
| 55120 | FANCL | LZE4T | Human | Esophagus | ESCC | 1.82e-06 | 2.37e-01 | 0.0811 |
| 55120 | FANCL | LZE7T | Human | Esophagus | ESCC | 4.19e-03 | 4.68e-01 | 0.0667 |
| 55120 | FANCL | LZE8T | Human | Esophagus | ESCC | 2.45e-02 | 1.03e-01 | 0.067 |
| 55120 | FANCL | LZE24T | Human | Esophagus | ESCC | 3.23e-10 | 1.66e-01 | 0.0596 |
| 55120 | FANCL | LZE21T | Human | Esophagus | ESCC | 1.60e-04 | 2.91e-01 | 0.0655 |
| 55120 | FANCL | P1T-E | Human | Esophagus | ESCC | 7.14e-04 | 2.60e-01 | 0.0875 |
| 55120 | FANCL | P2T-E | Human | Esophagus | ESCC | 3.70e-19 | 5.92e-01 | 0.1177 |
| 55120 | FANCL | P4T-E | Human | Esophagus | ESCC | 1.02e-11 | 3.11e-01 | 0.1323 |
| 55120 | FANCL | P5T-E | Human | Esophagus | ESCC | 1.41e-05 | 1.81e-01 | 0.1327 |
| 55120 | FANCL | P8T-E | Human | Esophagus | ESCC | 5.55e-18 | 3.76e-01 | 0.0889 |
| 55120 | FANCL | P9T-E | Human | Esophagus | ESCC | 1.86e-07 | 1.62e-01 | 0.1131 |
| 55120 | FANCL | P10T-E | Human | Esophagus | ESCC | 6.89e-16 | 3.47e-01 | 0.116 |
| 55120 | FANCL | P11T-E | Human | Esophagus | ESCC | 6.53e-05 | 3.88e-01 | 0.1426 |
| 55120 | FANCL | P12T-E | Human | Esophagus | ESCC | 6.19e-08 | 1.68e-01 | 0.1122 |
| 55120 | FANCL | P15T-E | Human | Esophagus | ESCC | 8.33e-07 | 2.52e-01 | 0.1149 |
| Page: 1 2 3 4 |
| Tissue | Expression Dynamics | Abbreviation |
| Cervix | 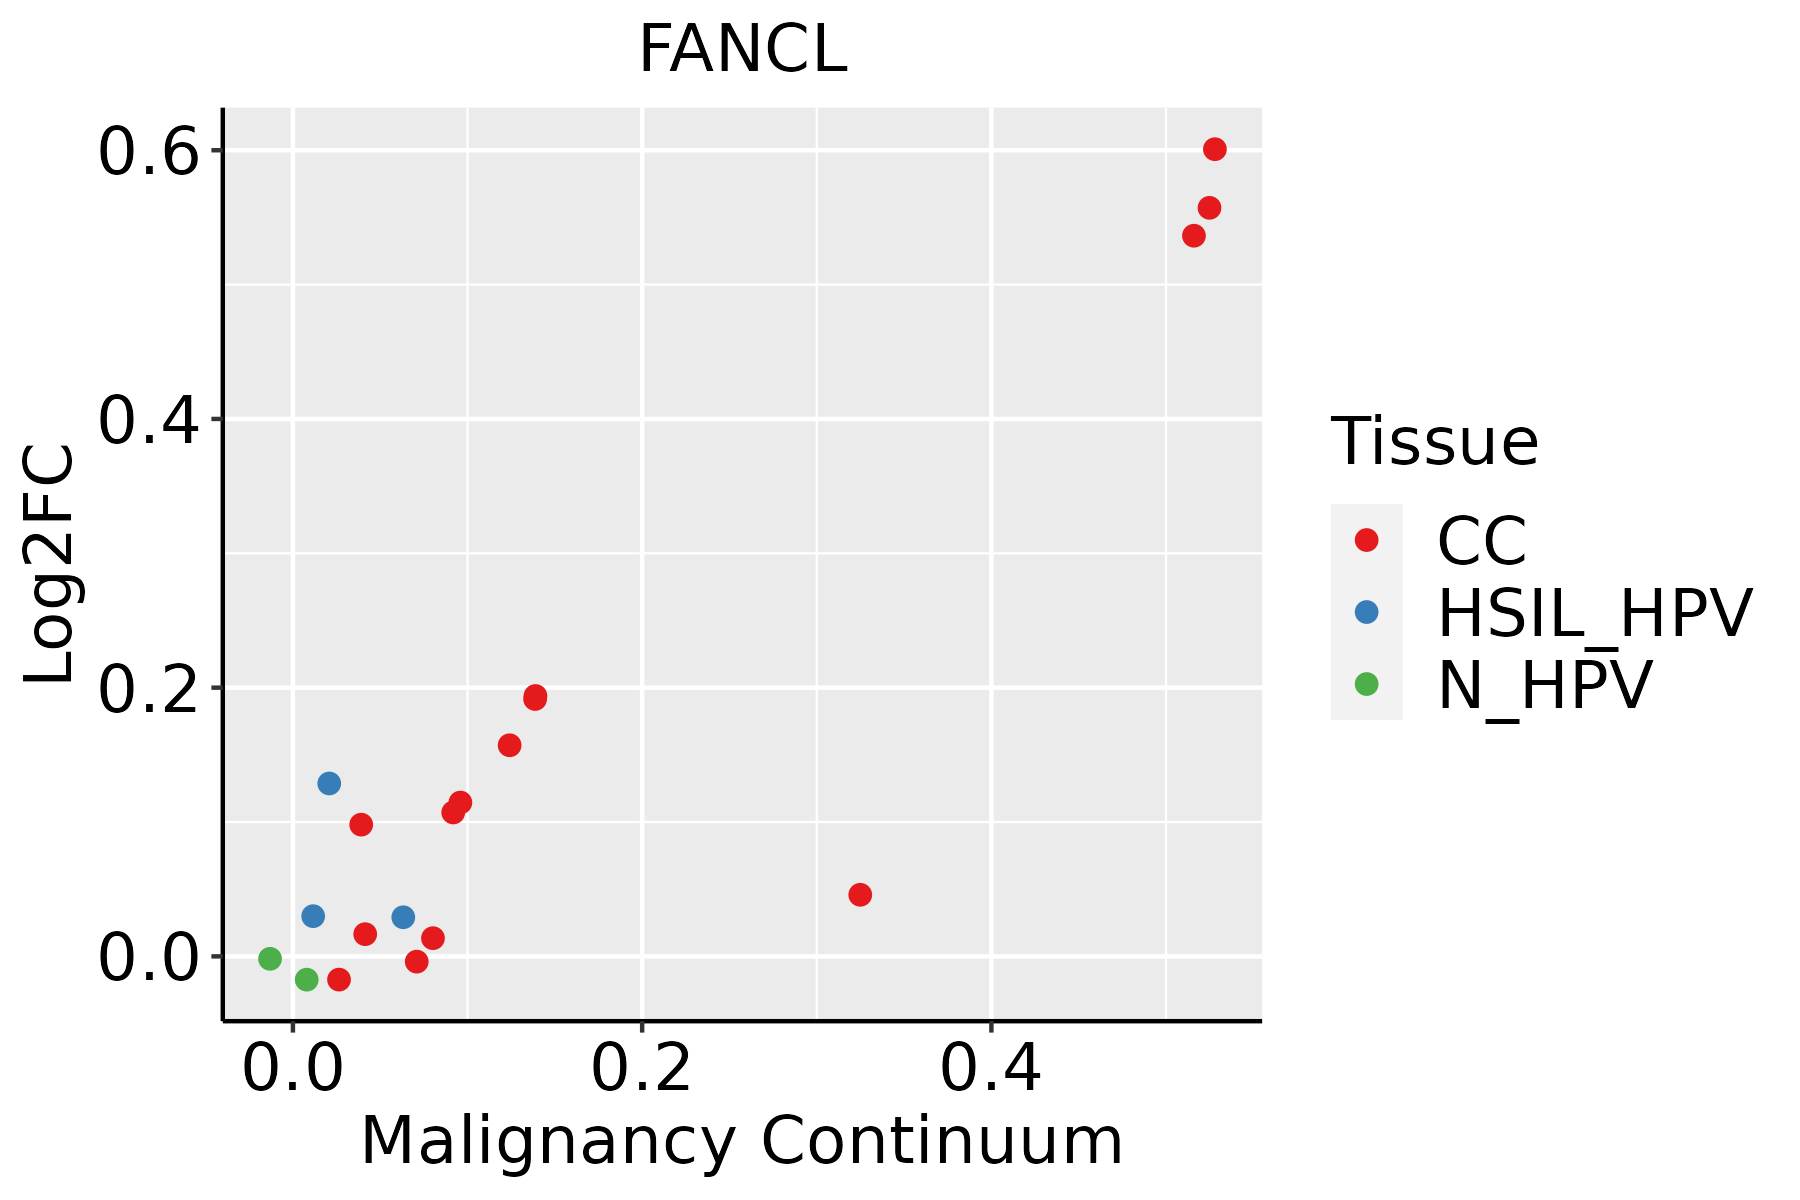 | CC: Cervix cancer |
| HSIL_HPV: HPV-infected high-grade squamous intraepithelial lesions | ||
| N_HPV: HPV-infected normal cervix | ||
| Esophagus | 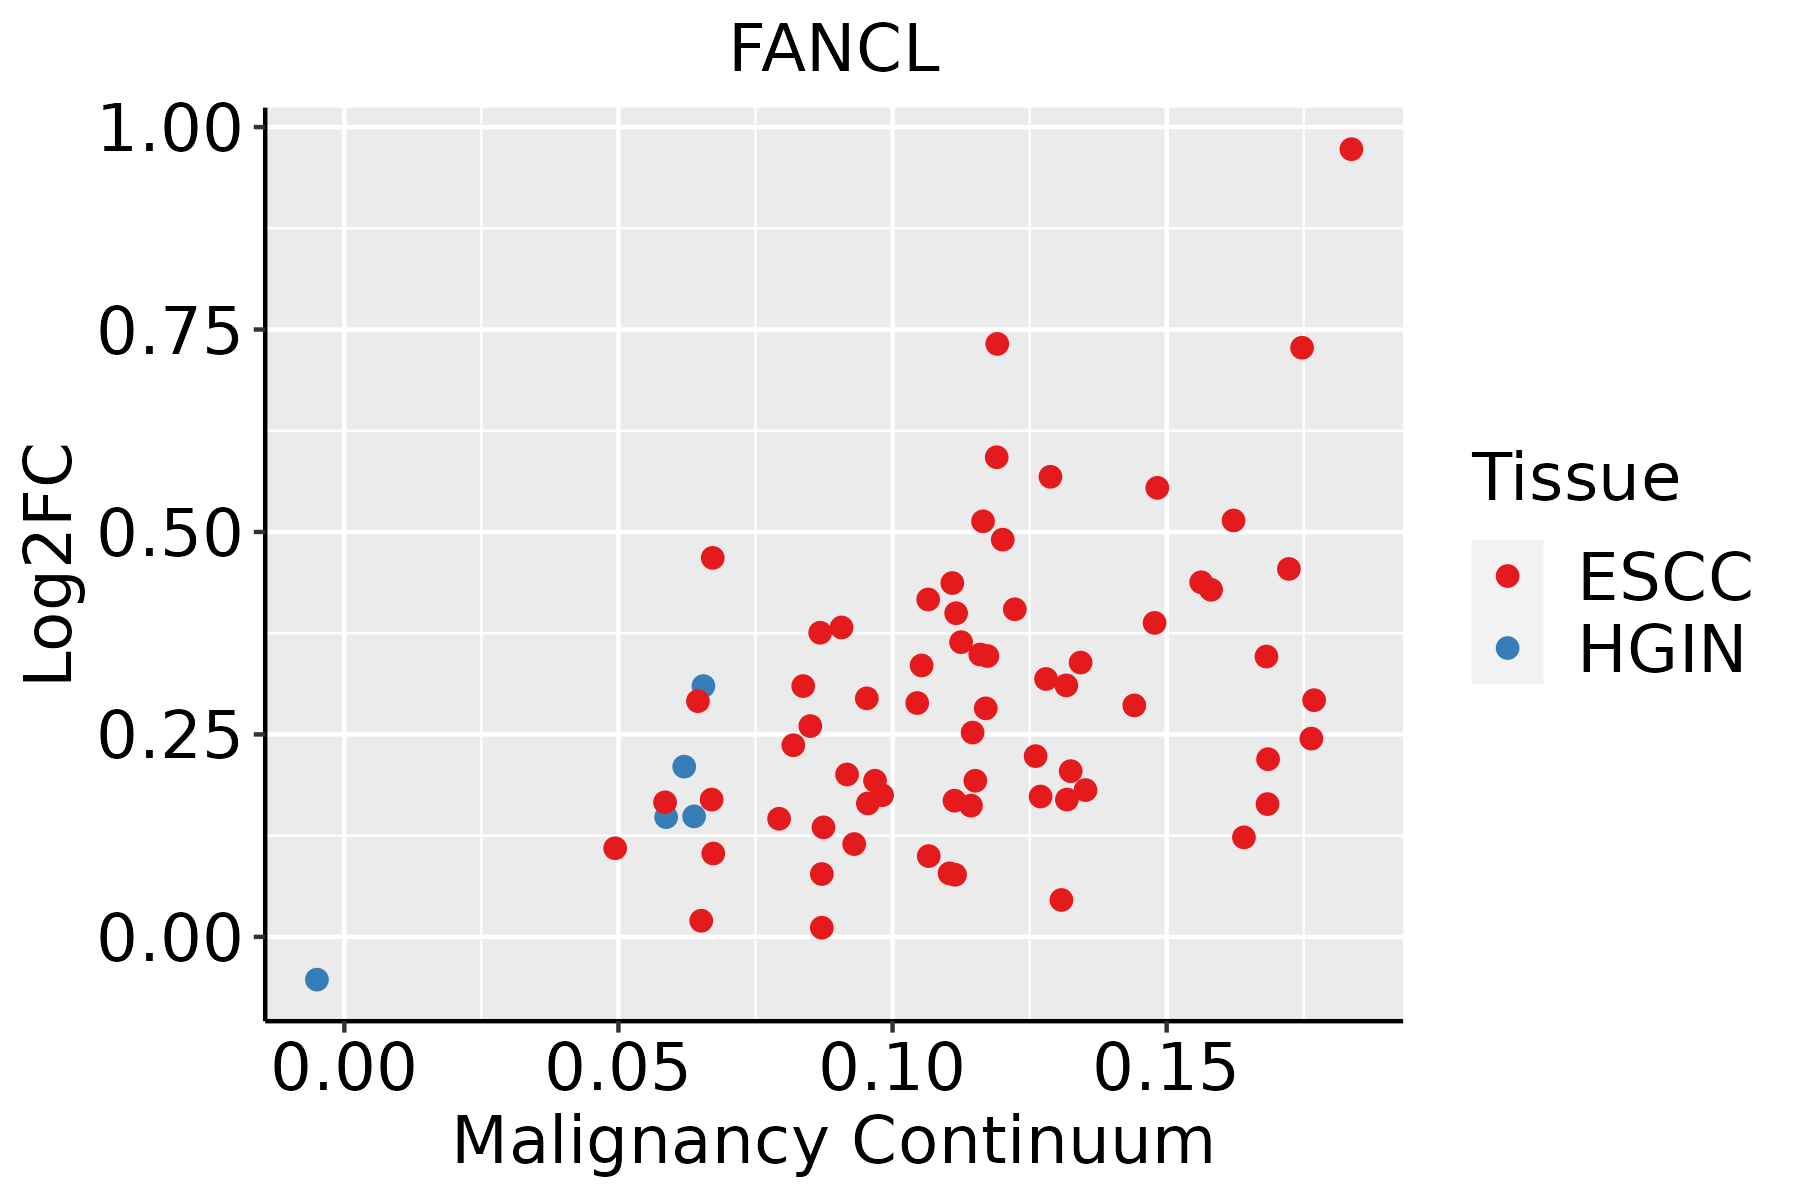 | ESCC: Esophageal squamous cell carcinoma |
| HGIN: High-grade intraepithelial neoplasias | ||
| LGIN: Low-grade intraepithelial neoplasias | ||
| Oral Cavity | 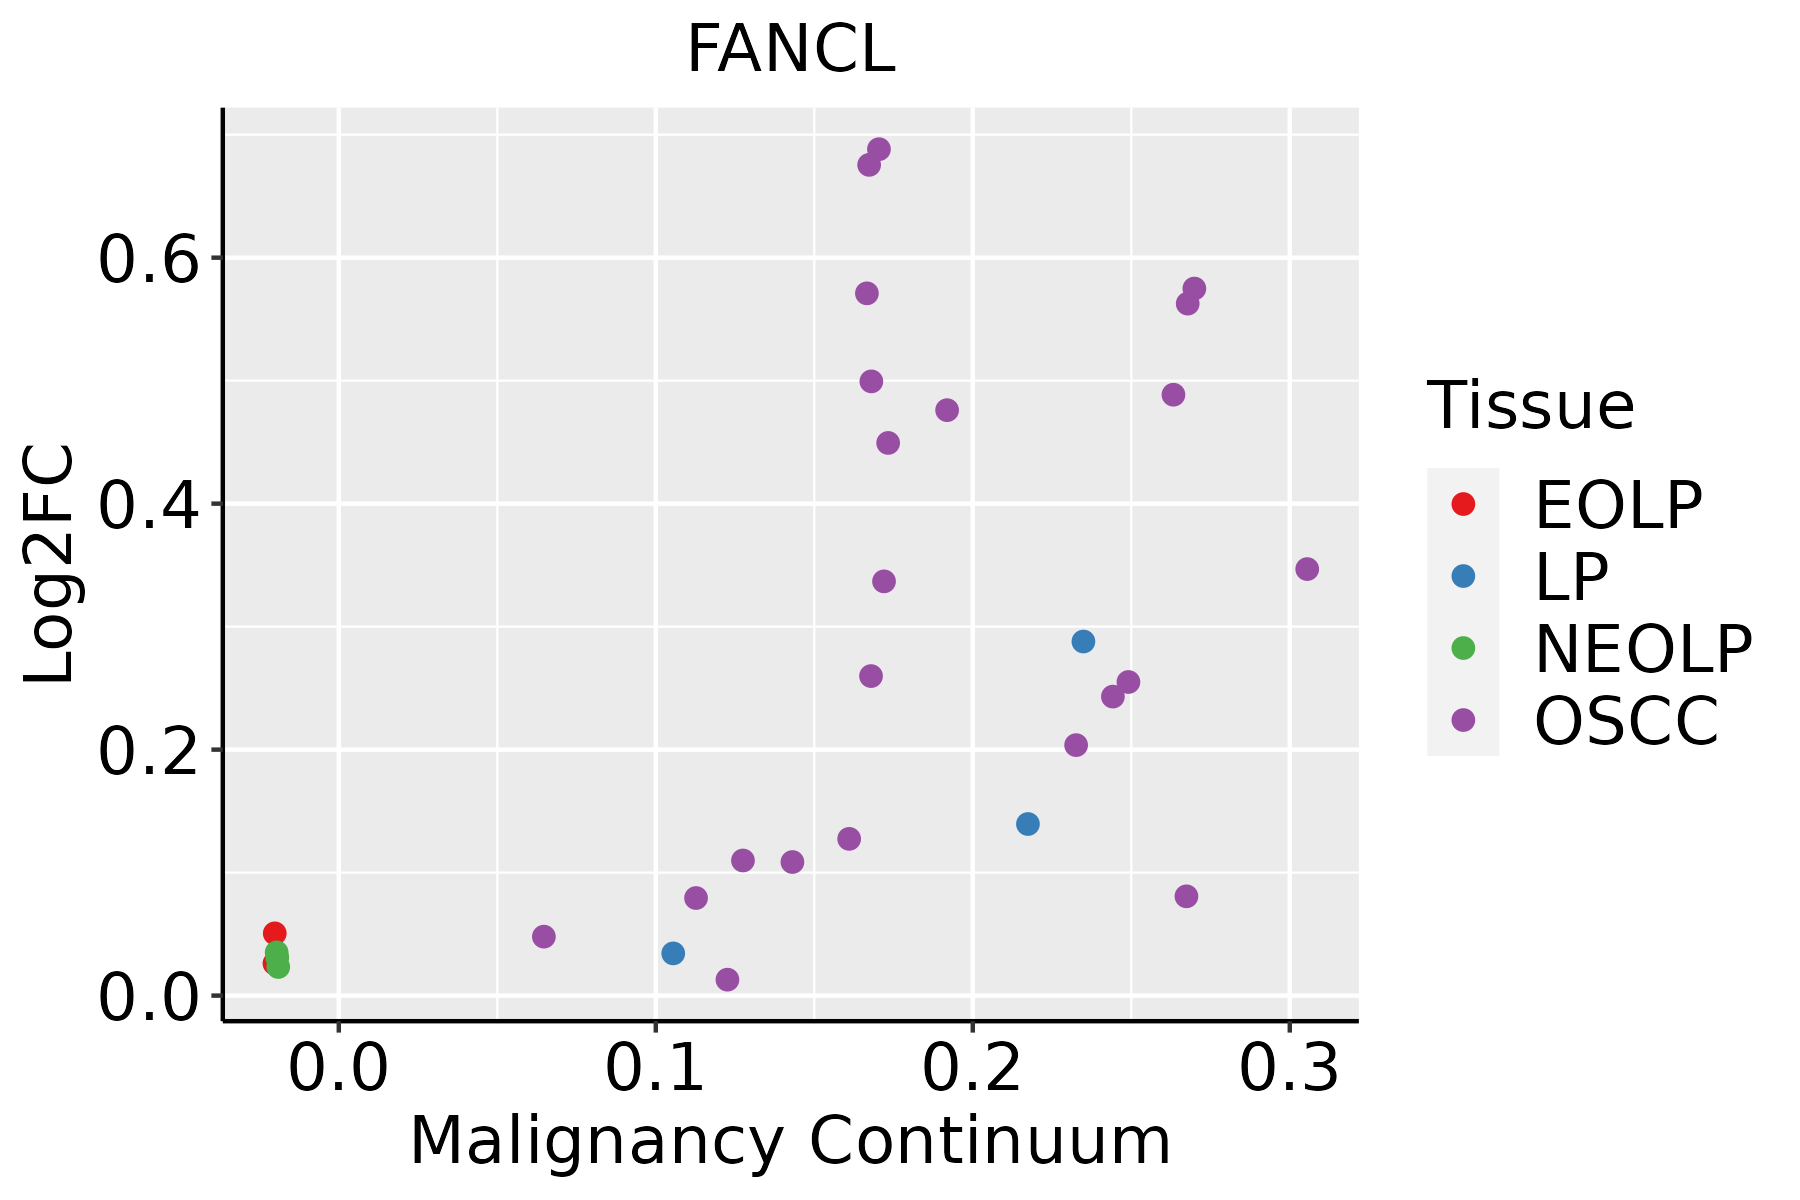 | EOLP: Erosive Oral lichen planus |
| LP: leukoplakia | ||
| NEOLP: Non-erosive oral lichen planus | ||
| OSCC: Oral squamous cell carcinoma |
| ∗log2FC in expression of this searched gene in stem-like cells from each diseased tissue sample relative to stem-like cells in normal samples in each tissue plotted against the malignancy continuum. Samples are colored based on if they are from different disease stage. |
Top |
Malignant transformation related pathway analysis |
| Find out the enriched GO biological processes and KEGG pathways involved in transition from healthy to precancer to cancer |
| Tissue | Disease Stage | Enriched GO biological Processes |
| Colorectum | AD |  |
| Colorectum | SER |  |
| Colorectum | MSS |  |
| Colorectum | MSI-H |  |
| Colorectum | FAP |  |
| ∗Top 15 enriched GO BP terms are showed in the bar plot of each disease state in each tissue. Each row represents a significant GO biological process which is colored according to the -log10(p.adjust). |
| Page: 1 2 3 4 5 6 7 8 9 |
| GO ID | Tissue | Disease Stage | Description | Gene Ratio | Bg Ratio | pvalue | p.adjust | Count |
| GO:00065136 | Esophagus | ESCC | protein monoubiquitination | 53/8552 | 67/18723 | 2.11e-08 | 4.03e-07 | 53 |
| GO:00065135 | Oral cavity | OSCC | protein monoubiquitination | 47/7305 | 67/18723 | 2.32e-07 | 3.68e-06 | 47 |
| Page: 1 |
| Pathway ID | Tissue | Disease Stage | Description | Gene Ratio | Bg Ratio | pvalue | p.adjust | qvalue | Count |
| hsa0412014 | Cervix | CC | Ubiquitin mediated proteolysis | 49/1267 | 142/8465 | 4.26e-09 | 7.68e-08 | 4.54e-08 | 49 |
| hsa0412015 | Cervix | CC | Ubiquitin mediated proteolysis | 49/1267 | 142/8465 | 4.26e-09 | 7.68e-08 | 4.54e-08 | 49 |
| hsa0412027 | Esophagus | ESCC | Ubiquitin mediated proteolysis | 122/4205 | 142/8465 | 6.53e-20 | 7.29e-18 | 3.74e-18 | 122 |
| hsa0412036 | Esophagus | ESCC | Ubiquitin mediated proteolysis | 122/4205 | 142/8465 | 6.53e-20 | 7.29e-18 | 3.74e-18 | 122 |
| hsa0412020 | Oral cavity | OSCC | Ubiquitin mediated proteolysis | 105/3704 | 142/8465 | 1.83e-13 | 4.37e-12 | 2.23e-12 | 105 |
| hsa04120110 | Oral cavity | OSCC | Ubiquitin mediated proteolysis | 105/3704 | 142/8465 | 1.83e-13 | 4.37e-12 | 2.23e-12 | 105 |
| Page: 1 |
Top |
Cell-cell communication analysis |
| Identification of potential cell-cell interactions between two cell types and their ligand-receptor pairs for different disease states |
| Ligand | Receptor | LRpair | Pathway | Tissue | Disease Stage |
| Page: 1 |
Top |
Single-cell gene regulatory network inference analysis |
| Find out the significant the regulons (TFs) and the target genes of each regulon across cell types for different disease states |
| TF | Cell Type | Tissue | Disease Stage | Target Gene | RSS | Regulon Activity |
| ∗The dot plots of a searched regulon are shown for all cell subpopulations in each disease state of each tissue based on the regulon specific score inferred using pySCENIC and by calculating the average expression. |
| Page: 1 |
Top |
Somatic mutation of malignant transformation related genes |
| Annotation of somatic variants for genes involved in malignant transformation |
| Hugo Symbol | Variant Class | Variant Classification | dbSNP RS | HGVSc | HGVSp | HGVSp Short | SWISSPROT | BIOTYPE | SIFT | PolyPhen | Tumor Sample Barcode | Tissue | Histology | Sex | Age | Stage | Therapy Types | Drugs | Outcome |
| FANCL | SNV | Missense_Mutation | c.213N>T | p.Gln71His | p.Q71H | Q9NW38 | protein_coding | tolerated(0.09) | possibly_damaging(0.49) | TCGA-A8-A07B-01 | Breast | breast invasive carcinoma | Female | >=65 | I/II | Unknown | Unknown | SD | |
| FANCL | SNV | Missense_Mutation | c.1093C>T | p.Pro365Ser | p.P365S | Q9NW38 | protein_coding | deleterious(0) | probably_damaging(1) | TCGA-2W-A8YY-01 | Cervix | cervical & endocervical cancer | Female | <65 | I/II | Chemotherapy | cisplatin | CR | |
| FANCL | SNV | Missense_Mutation | c.976G>A | p.Asp326Asn | p.D326N | Q9NW38 | protein_coding | tolerated(0.06) | probably_damaging(0.993) | TCGA-C5-A1BL-01 | Cervix | cervical & endocervical cancer | Female | <65 | I/II | Unknown | Unknown | SD | |
| FANCL | SNV | Missense_Mutation | c.880G>C | p.Glu294Gln | p.E294Q | Q9NW38 | protein_coding | tolerated(0.1) | benign(0.01) | TCGA-EK-A3GK-01 | Cervix | cervical & endocervical cancer | Female | <65 | I/II | Unknown | Unknown | SD | |
| FANCL | SNV | Missense_Mutation | novel | c.700G>A | p.Ala234Thr | p.A234T | Q9NW38 | protein_coding | deleterious(0) | possibly_damaging(0.693) | TCGA-VS-A8EJ-01 | Cervix | cervical & endocervical cancer | Female | <65 | I/II | Chemotherapy | cisplatin | PD |
| FANCL | SNV | Missense_Mutation | rs199564543 | c.637N>A | p.Asp213Asn | p.D213N | Q9NW38 | protein_coding | deleterious(0) | probably_damaging(1) | TCGA-A6-6780-01 | Colorectum | colon adenocarcinoma | Male | >=65 | I/II | Unknown | Unknown | SD |
| FANCL | SNV | Missense_Mutation | c.137N>C | p.Leu46Ser | p.L46S | Q9NW38 | protein_coding | tolerated(0.41) | benign(0.017) | TCGA-AA-3492-01 | Colorectum | colon adenocarcinoma | Female | >=65 | I/II | Unknown | Unknown | SD | |
| FANCL | SNV | Missense_Mutation | novel | c.800N>T | p.Pro267Leu | p.P267L | Q9NW38 | protein_coding | deleterious(0) | benign(0.427) | TCGA-AA-3854-01 | Colorectum | colon adenocarcinoma | Female | >=65 | I/II | Unknown | Unknown | SD |
| FANCL | SNV | Missense_Mutation | rs769425665 | c.691N>T | p.Arg231Cys | p.R231C | Q9NW38 | protein_coding | deleterious(0) | probably_damaging(0.966) | TCGA-AA-A02R-01 | Colorectum | colon adenocarcinoma | Female | >=65 | I/II | Unknown | Unknown | PD |
| FANCL | SNV | Missense_Mutation | c.851G>A | p.Ser284Asn | p.S284N | Q9NW38 | protein_coding | deleterious(0.02) | benign(0.001) | TCGA-AD-5900-01 | Colorectum | colon adenocarcinoma | Male | >=65 | I/II | Unknown | Unknown | SD |
| Page: 1 2 3 4 |
Top |
Related drugs of malignant transformation related genes |
| Identification of chemicals and drugs interact with genes involved in malignant transfromation |
| (DGIdb 4.0) |
| Entrez ID | Symbol | Category | Interaction Types | Drug Claim Name | Drug Name | PMIDs |
| Page: 1 |

Copyright 2023-Present -The University of Texas Health Science Center at Houston |