Schematic overview of the cellular and molecular mechanisms involved in the cancer progression, including the proposed cellular and molecular mechanisms in cancer cells trajectory. AT1: alveolar type 1 cells; AT2: alveolar type 2 cells; AAH: atypical adenomatous hyperplasia; AIS: adenocarcinoma in situ; MIA: minimally invasive adenocarcinoma; IA: invasive adenocarcinoma; EMT: epithelial-mesenchymal transition

Home

Download

Statistics

Help

Contact

Center for Computational Systems Medicine
leaf

Gene summary

leaf

Malignant transformation analysis

leaf

Malignant transformation related pathway analysis

leaf

Cell-cell communication analysis

leaf

Single-cell gene regulatory network inference analysis

leaf

Somatic mutation of malignant transformation related genes

leaf

Related drugs of malignant transformation related genes

Gene: FANCI

Gene summary for FANCI

check button Gene summary.

Gene informationSpeciesHuman
Gene symbol

FANCI

Gene ID

55215

Gene nameFA complementation group I
Gene AliasKIAA1794
Cytomap15q26.1
Gene Typeprotein-coding
GO ID

GO:0006139

UniProtAcc

Q9NVI1


Top

Malignant transformation analysis

check button Identification of the aberrant gene expression in precancerous and cancerous lesions by comparing the gene expression of stem-like cells in diseased tissues with normal stem cells
check button Malignant transformation involving gene list.
Entrez IDSymbolReplicatesSpeciesOrganTissueAdj P-valueLog2FCMalignancy
55215FANCIHSIL_HPV_2HumanCervixHSIL_HPV1.44e-021.79e-010.0208
55215FANCICCI_1HumanCervixCC2.71e-045.89e-010.528
55215FANCICCI_2HumanCervixCC4.05e-077.61e-010.5249
55215FANCICCI_3HumanCervixCC4.62e-034.67e-010.516
55215FANCIsample3HumanCervixCC5.51e-041.22e-010.1387
55215FANCIT3HumanCervixCC1.70e-021.47e-010.1389
55215FANCILZE2THumanEsophagusESCC4.42e-032.84e-010.082
55215FANCILZE7THumanEsophagusESCC1.06e-073.75e-010.0667
55215FANCILZE24THumanEsophagusESCC1.76e-038.25e-020.0596
55215FANCILZE6THumanEsophagusESCC8.86e-042.12e-010.0845
55215FANCIP2T-EHumanEsophagusESCC3.66e-133.04e-010.1177
55215FANCIP4T-EHumanEsophagusESCC3.56e-082.37e-010.1323
55215FANCIP8T-EHumanEsophagusESCC7.21e-031.85e-010.0889
55215FANCIP9T-EHumanEsophagusESCC3.19e-082.42e-010.1131
55215FANCIP10T-EHumanEsophagusESCC1.75e-092.95e-010.116
55215FANCIP15T-EHumanEsophagusESCC9.82e-113.07e-010.1149
55215FANCIP16T-EHumanEsophagusESCC6.46e-052.05e-010.1153
55215FANCIP17T-EHumanEsophagusESCC6.98e-031.00e-010.1278
55215FANCIP19T-EHumanEsophagusESCC1.99e-033.52e-010.1662
55215FANCIP20T-EHumanEsophagusESCC2.92e-031.03e-010.1124
Page: 1 2 3 4 

check button Transcriptomic changes along malignancy continuum.
TissueExpression DynamicsAbbreviation
CervixThe image shows the transcriptomic changes along malignancy continuum.log2FC in expression of this searched gene in stem-like cells from each diseased tissue sample relative to stem-like cells in normal samples in each tissue plotted against the malignancy continuum. Samples are colored based on if they are from different disease stage.CC: Cervix cancer
HSIL_HPV: HPV-infected high-grade squamous intraepithelial lesions
N_HPV: HPV-infected normal cervix
EsophagusThe image shows the transcriptomic changes along malignancy continuum.log2FC in expression of this searched gene in stem-like cells from each diseased tissue sample relative to stem-like cells in normal samples in each tissue plotted against the malignancy continuum. Samples are colored based on if they are from different disease stage.
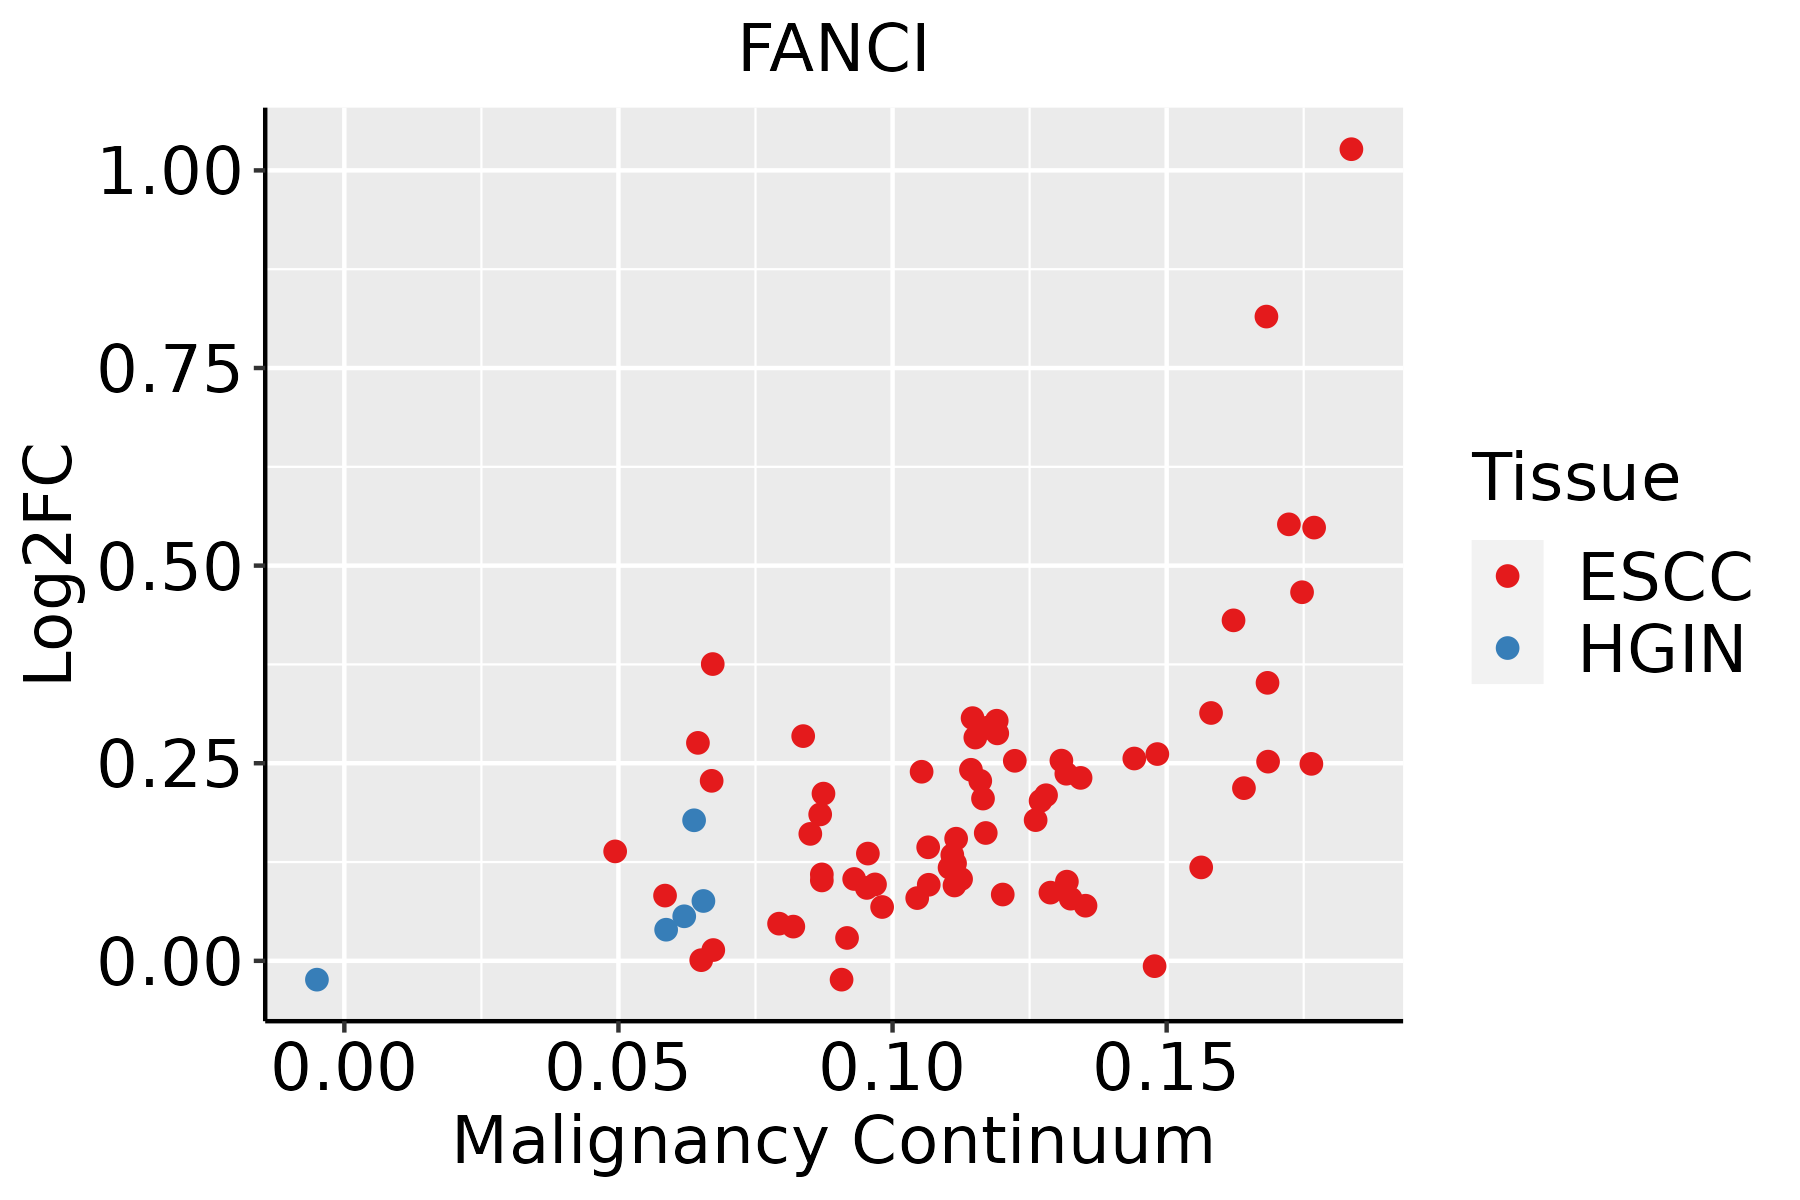
ESCC: Esophageal squamous cell carcinoma
HGIN: High-grade intraepithelial neoplasias
LGIN: Low-grade intraepithelial neoplasias
LiverThe image shows the transcriptomic changes along malignancy continuum.log2FC in expression of this searched gene in stem-like cells from each diseased tissue sample relative to stem-like cells in normal samples in each tissue plotted against the malignancy continuum. Samples are colored based on if they are from different disease stage.
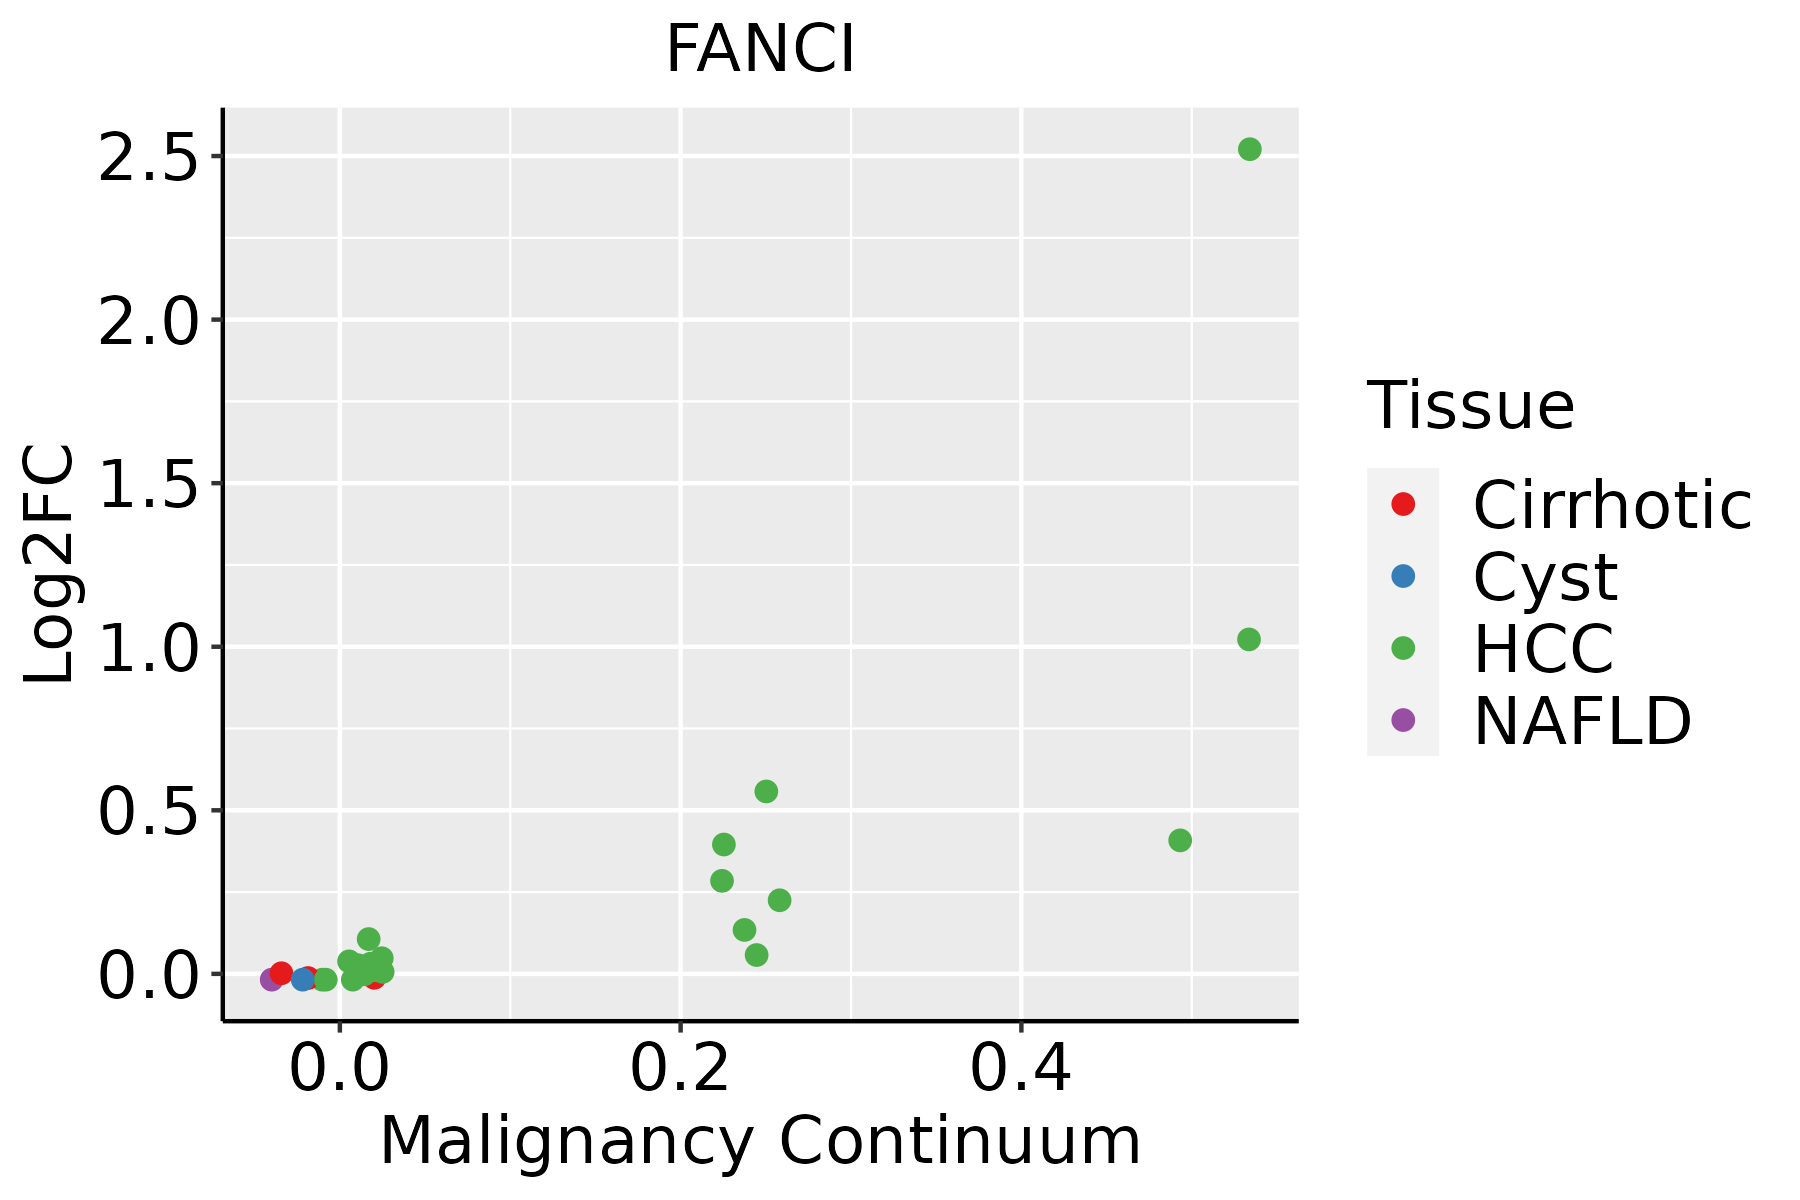
HCC: Hepatocellular carcinoma
NAFLD: Non-alcoholic fatty liver disease
Oral CavityThe image shows the transcriptomic changes along malignancy continuum.log2FC in expression of this searched gene in stem-like cells from each diseased tissue sample relative to stem-like cells in normal samples in each tissue plotted against the malignancy continuum. Samples are colored based on if they are from different disease stage.
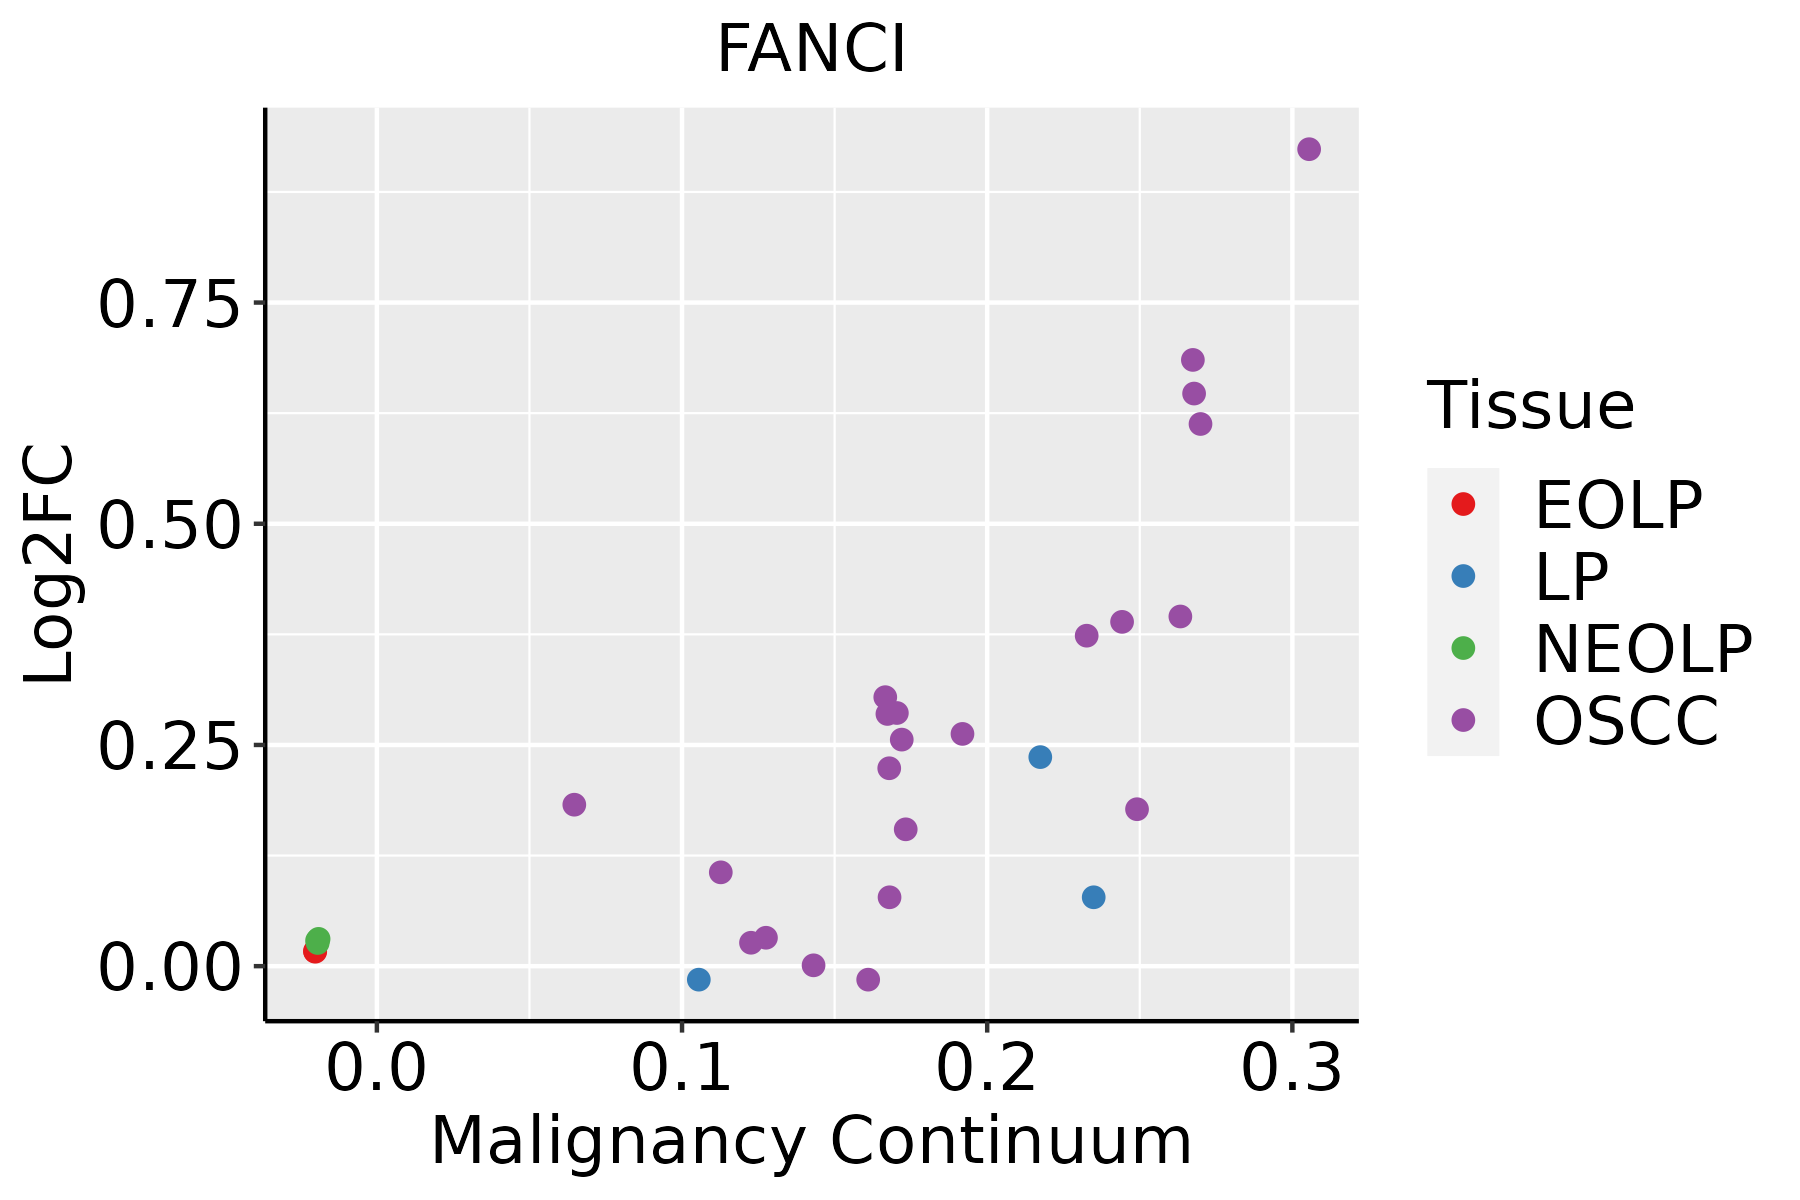
EOLP: Erosive Oral lichen planus
LP: leukoplakia
NEOLP: Non-erosive oral lichen planus
OSCC: Oral squamous cell carcinoma
ThyroidThe image shows the transcriptomic changes along malignancy continuum.log2FC in expression of this searched gene in stem-like cells from each diseased tissue sample relative to stem-like cells in normal samples in each tissue plotted against the malignancy continuum. Samples are colored based on if they are from different disease stage.
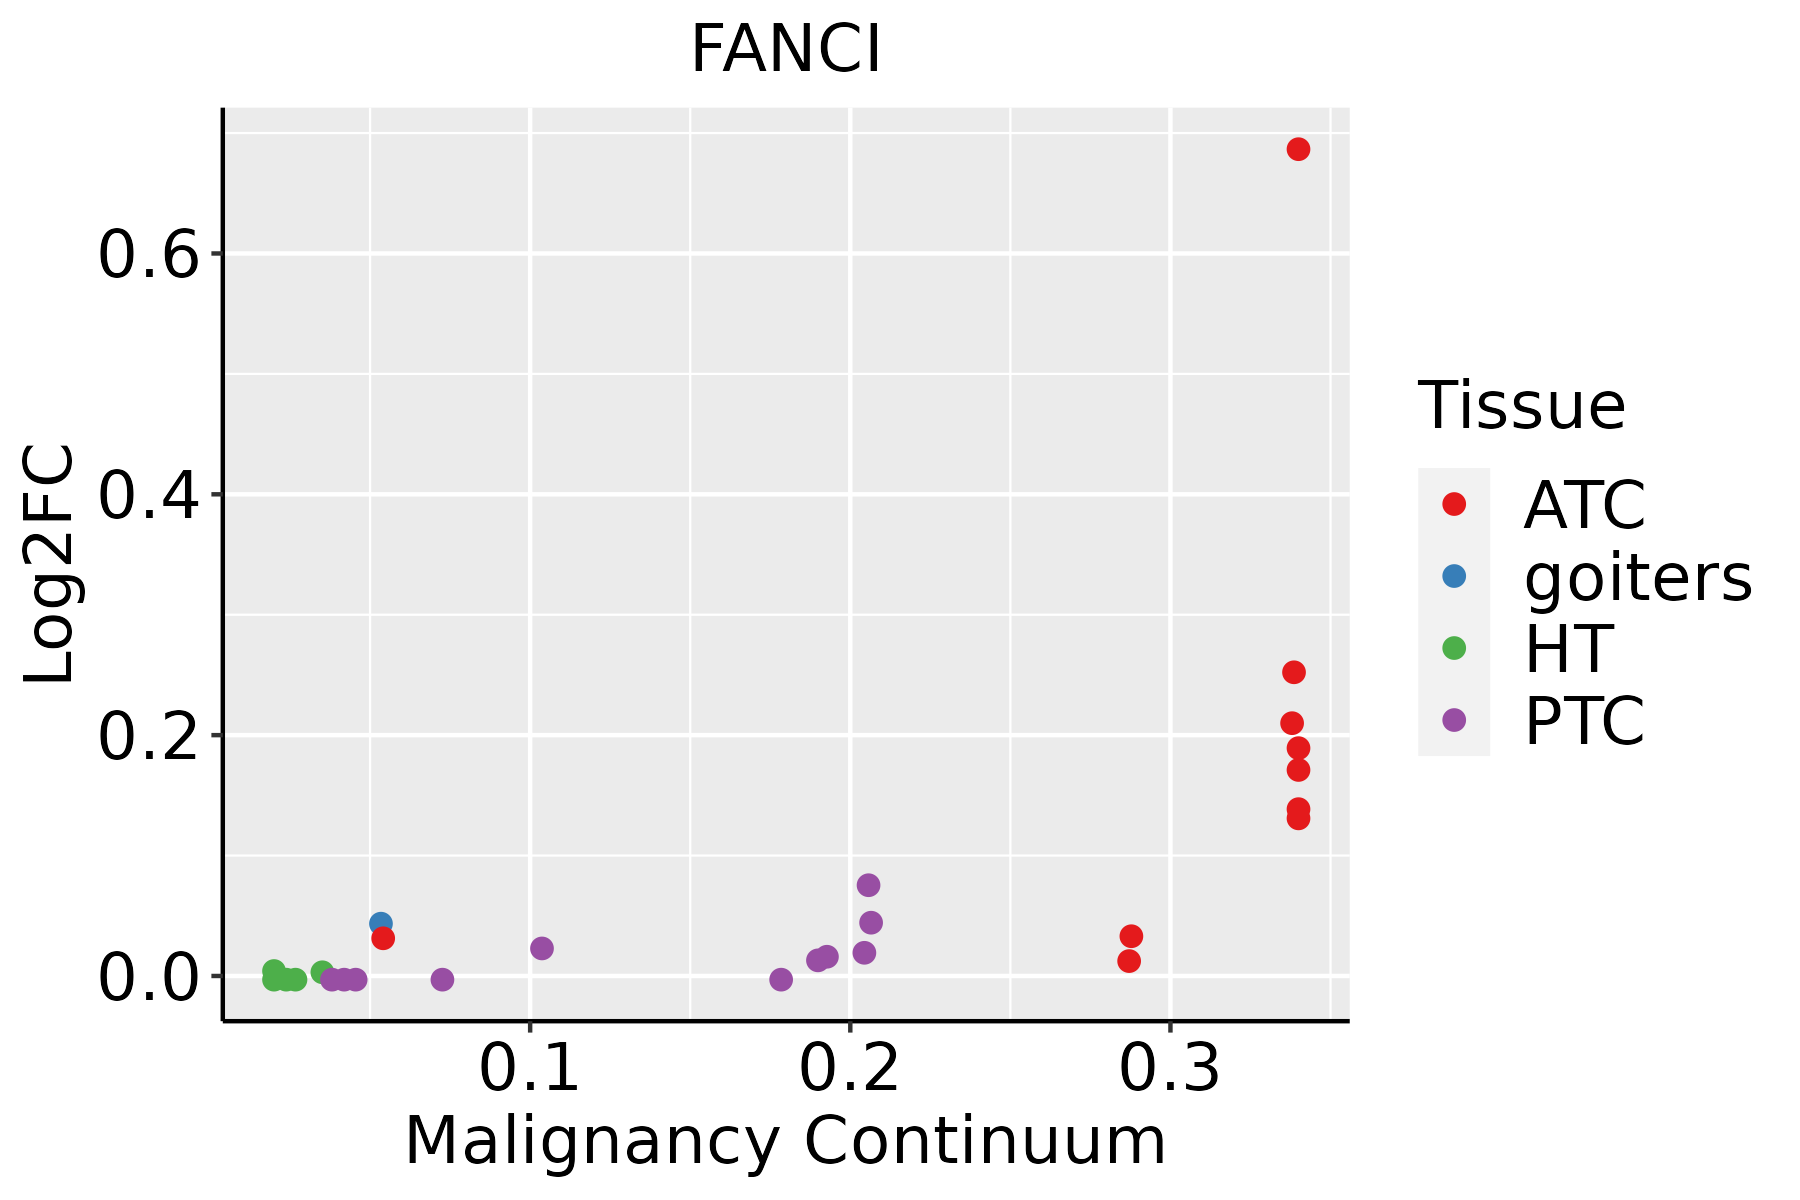
ATC: Anaplastic thyroid cancer
HT: Hashimoto's thyroiditis
PTC: Papillary thyroid cancer
∗log2FC in expression of this searched gene in stem-like cells from each diseased tissue sample relative to stem-like cells in normal samples in each tissue plotted against the malignancy continuum. Samples are colored based on if they are from different disease stage.

Top

Malignant transformation related pathway analysis

check buttonFind out the enriched GO biological processes and KEGG pathways involved in transition from healthy to precancer to cancer
check button Figure of enriched GO biological processes.
TissueDisease StageEnriched GO biological Processes
ColorectumADGO analysis - Figure of enriched GO biological processes: Top 15 enriched GO BP terms are showed in the bar plot of each disease state in each tissue. Each row represents a significant GO biological process which is colored according to the -log10(p.adjust).
ColorectumSERGO analysis - Figure of enriched GO biological processes: Top 15 enriched GO BP terms are showed in the bar plot of each disease state in each tissue. Each row represents a significant GO biological process which is colored according to the -log10(p.adjust).
ColorectumMSSGO analysis - Figure of enriched GO biological processes: Top 15 enriched GO BP terms are showed in the bar plot of each disease state in each tissue. Each row represents a significant GO biological process which is colored according to the -log10(p.adjust).
ColorectumMSI-HGO analysis - Figure of enriched GO biological processes: Top 15 enriched GO BP terms are showed in the bar plot of each disease state in each tissue. Each row represents a significant GO biological process which is colored according to the -log10(p.adjust).
ColorectumFAPGO analysis - Figure of enriched GO biological processes: Top 15 enriched GO BP terms are showed in the bar plot of each disease state in each tissue. Each row represents a significant GO biological process which is colored according to the -log10(p.adjust).
∗Top 15 enriched GO BP terms are showed in the bar plot of each disease state in each tissue. Each row represents a significant GO biological process which is colored according to the -log10(p.adjust).
Page: 1 2 3 4 5 6 7 8 9 

check button Enriched GO biological processes.
GO IDTissueDisease StageDescriptionGene RatioBg Ratiopvaluep.adjustCount
GO:190332010CervixCCregulation of protein modification by small protein conjugation or removal66/2311242/187232.31e-103.46e-0866
GO:003139610CervixCCregulation of protein ubiquitination59/2311210/187235.90e-107.51e-0859
GO:00313983CervixCCpositive regulation of protein ubiquitination25/2311119/187235.09e-033.01e-0225
GO:19033224CervixCCpositive regulation of protein modification by small protein conjugation or removal28/2311138/187235.26e-033.08e-0228
GO:003139615CervixHSIL_HPVregulation of protein ubiquitination33/737210/187231.02e-116.81e-0933
GO:190332015CervixHSIL_HPVregulation of protein modification by small protein conjugation or removal34/737242/187231.16e-104.31e-0834
GO:003139812CervixHSIL_HPVpositive regulation of protein ubiquitination13/737119/187238.24e-041.07e-0213
GO:190332212CervixHSIL_HPVpositive regulation of protein modification by small protein conjugation or removal13/737138/187233.16e-032.88e-0213
GO:1903320111EsophagusESCCregulation of protein modification by small protein conjugation or removal181/8552242/187231.80e-202.60e-18181
GO:0031396111EsophagusESCCregulation of protein ubiquitination154/8552210/187232.70e-162.04e-14154
GO:190332216EsophagusESCCpositive regulation of protein modification by small protein conjugation or removal99/8552138/187234.39e-101.16e-0899
GO:003139816EsophagusESCCpositive regulation of protein ubiquitination82/8552119/187232.41e-073.64e-0682
GO:190332022LiverHCCregulation of protein modification by small protein conjugation or removal167/7958242/187234.99e-174.72e-15167
GO:003139622LiverHCCregulation of protein ubiquitination142/7958210/187231.39e-137.81e-12142
GO:19033221LiverHCCpositive regulation of protein modification by small protein conjugation or removal94/7958138/187239.87e-103.01e-0894
GO:00313981LiverHCCpositive regulation of protein ubiquitination79/7958119/187231.18e-072.26e-0679
GO:190332020Oral cavityOSCCregulation of protein modification by small protein conjugation or removal165/7305242/187232.52e-203.99e-18165
GO:003139620Oral cavityOSCCregulation of protein ubiquitination143/7305210/187231.01e-179.80e-16143
GO:19033227Oral cavityOSCCpositive regulation of protein modification by small protein conjugation or removal88/7305138/187233.24e-097.39e-0888
GO:00313986Oral cavityOSCCpositive regulation of protein ubiquitination75/7305119/187239.46e-081.65e-0675
Page: 1 2 

check button Enriched KEGG pathways.
Pathway IDTissueDisease StageDescriptionGene RatioBg Ratiopvaluep.adjustqvalueCount
Page: 1 

Top

Cell-cell communication analysis

check buttonIdentification of potential cell-cell interactions between two cell types and their ligand-receptor pairs for different disease states
LigandReceptorLRpairPathwayTissueDisease Stage
Page: 1 

Top

Single-cell gene regulatory network inference analysis

check buttonFind out the significant the regulons (TFs) and the target genes of each regulon across cell types for different disease states
TFCell TypeTissueDisease StageTarget GeneRSSRegulon Activity
∗The dot plots of a searched regulon are shown for all cell subpopulations in each disease state of each tissue based on the regulon specific score inferred using pySCENIC and by calculating the average expression.
Page: 1 

Top

Somatic mutation of malignant transformation related genes

check buttonAnnotation of somatic variants for genes involved in malignant transformation
Hugo SymbolVariant ClassVariant ClassificationdbSNP RSHGVScHGVSpHGVSp ShortSWISSPROTBIOTYPESIFTPolyPhenTumor Sample BarcodeTissueHistologySexAgeStageTherapy TypesDrugsOutcome
FANCISNVMissense_Mutationc.3608C>Gp.Ser1203Cysp.S1203CQ9NVI1protein_codingdeleterious(0)probably_damaging(0.976)TCGA-A8-A07W-01Breastbreast invasive carcinomaFemale>=65III/IVHormone TherapyexemestaneSD
FANCISNVMissense_Mutationc.629N>Cp.Ile210Thrp.I210TQ9NVI1protein_codingdeleterious(0)possibly_damaging(0.72)TCGA-A8-A08R-01Breastbreast invasive carcinomaFemale<65I/IIUnknownUnknownSD
FANCISNVMissense_Mutationc.1082C>Tp.Ser361Leup.S361LQ9NVI1protein_codingtolerated(0.11)benign(0.027)TCGA-AC-A23H-01Breastbreast invasive carcinomaFemale>=65I/IIUnknownUnknownPD
FANCISNVMissense_Mutationnovelc.2068G>Ap.Glu690Lysp.E690KQ9NVI1protein_codingtolerated(0.07)benign(0.167)TCGA-AC-A5XS-01Breastbreast invasive carcinomaFemale>=65I/IIHormone TherapyfemaraSD
FANCISNVMissense_Mutationc.1730C>Tp.Ser577Phep.S577FQ9NVI1protein_codingdeleterious(0.01)possibly_damaging(0.812)TCGA-AN-A046-01Breastbreast invasive carcinomaFemale>=65I/IIUnknownUnknownSD
FANCISNVMissense_Mutationc.3407T>Gp.Met1136Argp.M1136RQ9NVI1protein_codingdeleterious(0.02)benign(0.005)TCGA-AO-A0JB-01Breastbreast invasive carcinomaFemale<65III/IVChemotherapycyclophosphamideSD
FANCISNVMissense_Mutationc.615N>Ap.Met205Ilep.M205IQ9NVI1protein_codingdeleterious(0.01)benign(0.011)TCGA-AR-A1AS-01Breastbreast invasive carcinomaFemale<65I/IIChemotherapydoxorubicinSD
FANCISNVMissense_Mutationnovelc.2086N>Ap.Glu696Lysp.E696KQ9NVI1protein_codingtolerated(0.31)benign(0.037)TCGA-GM-A2DO-01Breastbreast invasive carcinomaFemale<65I/IIHormone TherapytamoxiphenCR
FANCISNVMissense_Mutationnovelc.608C>Tp.Ser203Phep.S203FQ9NVI1protein_codingdeleterious(0.04)benign(0.397)TCGA-PL-A8LV-01Breastbreast invasive carcinomaFemale<65III/IVUnknownUnknownSD
FANCIinsertionNonsense_Mutationnovelc.2653_2654insGCTAAAAAATAGATAATAGAATATTAp.Tyr885CysfsTer2p.Y885Cfs*2Q9NVI1protein_codingTCGA-A8-A0A4-01Breastbreast invasive carcinomaFemale>=65I/IIHormone TherapytamoxiphenCR
Page: 1 2 3 4 5 6 7 8 9 10 11 12 13 14 

Top

Related drugs of malignant transformation related genes

check buttonIdentification of chemicals and drugs interact with genes involved in malignant transfromation
(DGIdb 4.0)
Entrez IDSymbolCategoryInteraction TypesDrug Claim NameDrug NamePMIDs
Page: 1