
|
|||||
|
 | |
| |
| |
| |
| |
| |
|
Gene: FANCF |
Gene summary for FANCF |
| Gene information | Species | Human | Gene symbol | FANCF | Gene ID | 2188 |
| Gene name | FA complementation group F | |
| Gene Alias | FAF | |
| Cytomap | 11p14.3 | |
| Gene Type | protein-coding | GO ID | GO:0006139 | UniProtAcc | A3KME0 |
Top |
Malignant transformation analysis |
| Identification of the aberrant gene expression in precancerous and cancerous lesions by comparing the gene expression of stem-like cells in diseased tissues with normal stem cells |
| Entrez ID | Symbol | Replicates | Species | Organ | Tissue | Adj P-value | Log2FC | Malignancy |
| 2188 | FANCF | LZE4T | Human | Esophagus | ESCC | 1.31e-03 | 1.71e-01 | 0.0811 |
| 2188 | FANCF | LZE8T | Human | Esophagus | ESCC | 2.01e-02 | 1.44e-01 | 0.067 |
| 2188 | FANCF | LZE24T | Human | Esophagus | ESCC | 3.78e-03 | 1.87e-01 | 0.0596 |
| 2188 | FANCF | P2T-E | Human | Esophagus | ESCC | 5.02e-20 | 3.87e-01 | 0.1177 |
| 2188 | FANCF | P4T-E | Human | Esophagus | ESCC | 1.41e-13 | 2.92e-01 | 0.1323 |
| 2188 | FANCF | P5T-E | Human | Esophagus | ESCC | 1.80e-09 | 1.25e-01 | 0.1327 |
| 2188 | FANCF | P8T-E | Human | Esophagus | ESCC | 2.62e-11 | 2.03e-01 | 0.0889 |
| 2188 | FANCF | P9T-E | Human | Esophagus | ESCC | 1.45e-04 | 1.57e-01 | 0.1131 |
| 2188 | FANCF | P10T-E | Human | Esophagus | ESCC | 4.38e-17 | 3.53e-01 | 0.116 |
| 2188 | FANCF | P11T-E | Human | Esophagus | ESCC | 3.24e-06 | 2.40e-01 | 0.1426 |
| 2188 | FANCF | P12T-E | Human | Esophagus | ESCC | 3.86e-12 | 2.79e-01 | 0.1122 |
| 2188 | FANCF | P15T-E | Human | Esophagus | ESCC | 6.52e-09 | 2.51e-01 | 0.1149 |
| 2188 | FANCF | P16T-E | Human | Esophagus | ESCC | 4.35e-22 | 3.51e-01 | 0.1153 |
| 2188 | FANCF | P17T-E | Human | Esophagus | ESCC | 2.08e-09 | 3.89e-01 | 0.1278 |
| 2188 | FANCF | P20T-E | Human | Esophagus | ESCC | 1.63e-11 | 3.35e-01 | 0.1124 |
| 2188 | FANCF | P21T-E | Human | Esophagus | ESCC | 4.14e-13 | 2.44e-01 | 0.1617 |
| 2188 | FANCF | P22T-E | Human | Esophagus | ESCC | 1.86e-23 | 4.12e-01 | 0.1236 |
| 2188 | FANCF | P23T-E | Human | Esophagus | ESCC | 3.10e-11 | 2.65e-01 | 0.108 |
| 2188 | FANCF | P24T-E | Human | Esophagus | ESCC | 1.02e-09 | 1.80e-01 | 0.1287 |
| 2188 | FANCF | P26T-E | Human | Esophagus | ESCC | 1.43e-12 | 2.32e-01 | 0.1276 |
| Page: 1 2 3 4 |
| Tissue | Expression Dynamics | Abbreviation |
| Esophagus | 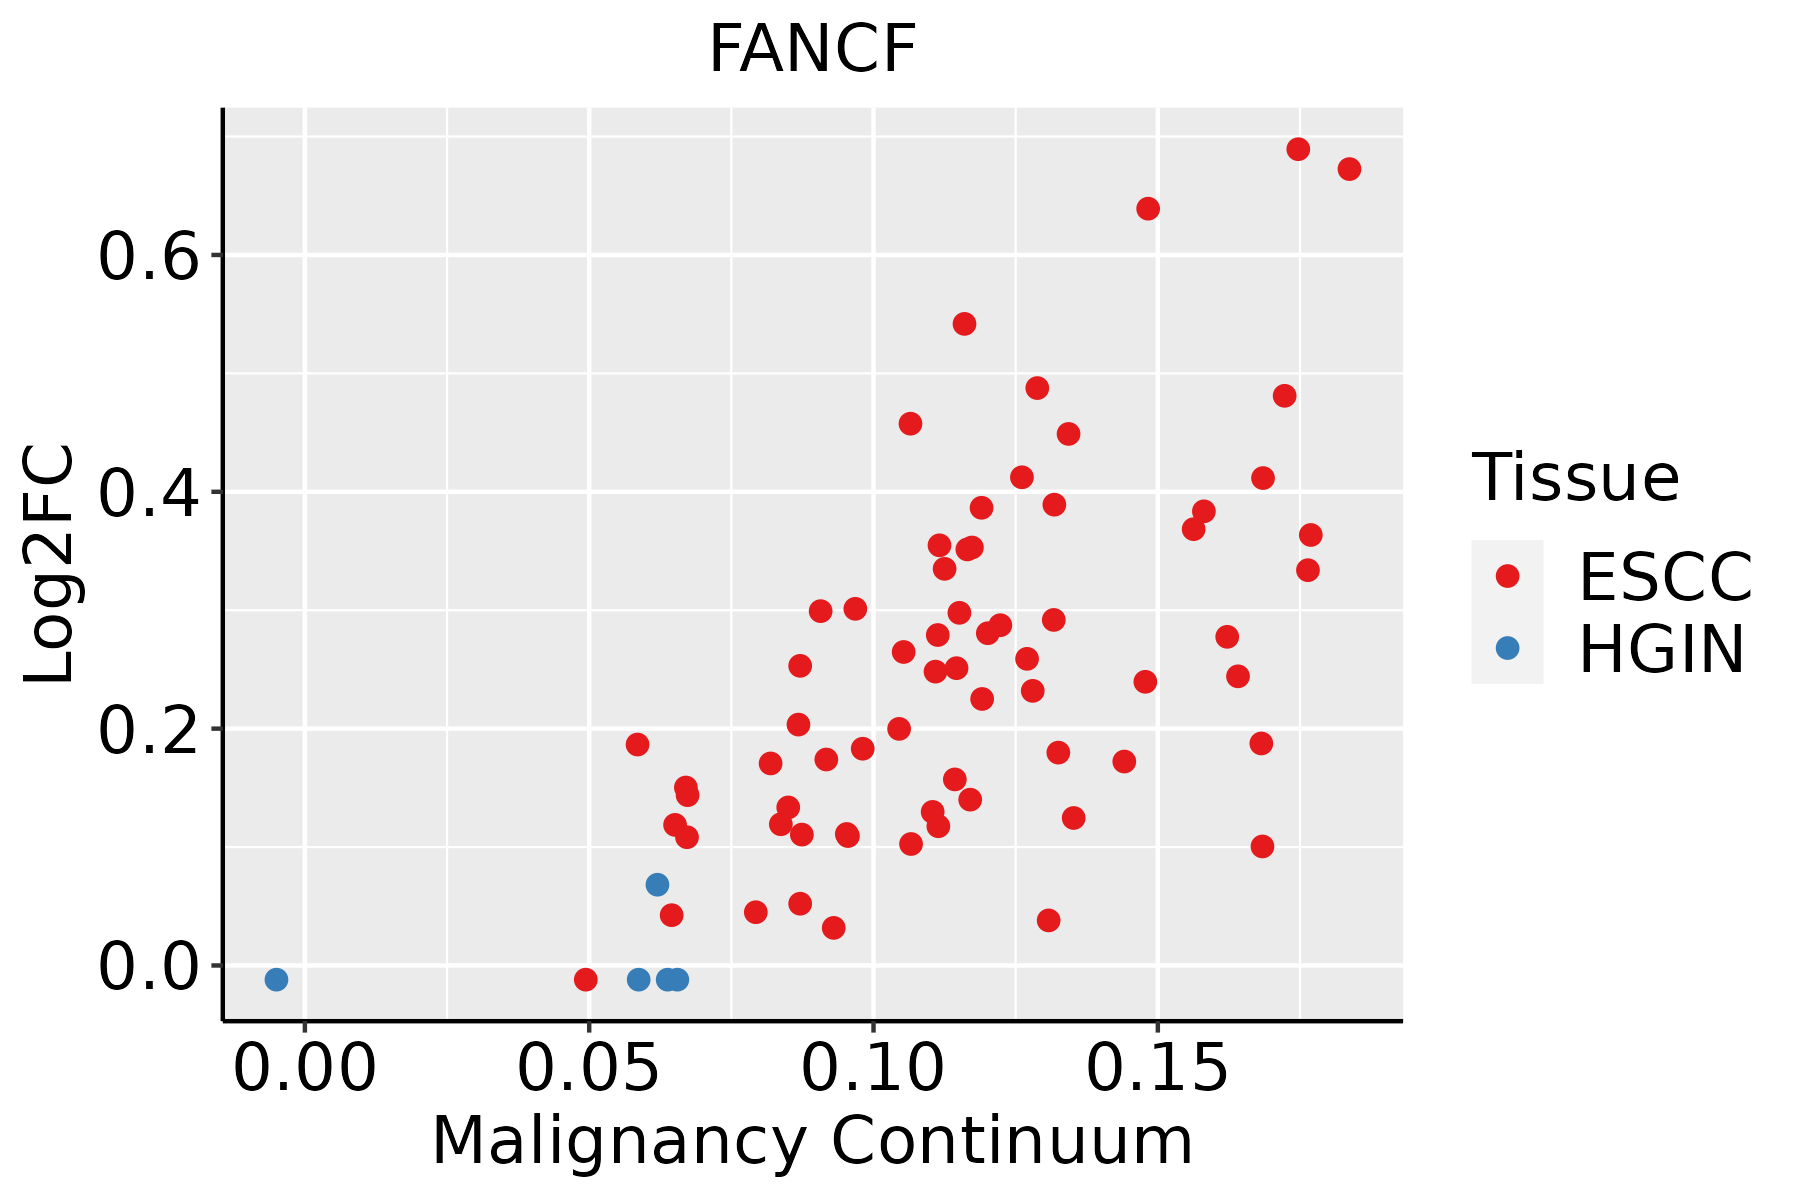 | ESCC: Esophageal squamous cell carcinoma |
| HGIN: High-grade intraepithelial neoplasias | ||
| LGIN: Low-grade intraepithelial neoplasias | ||
| Oral Cavity | 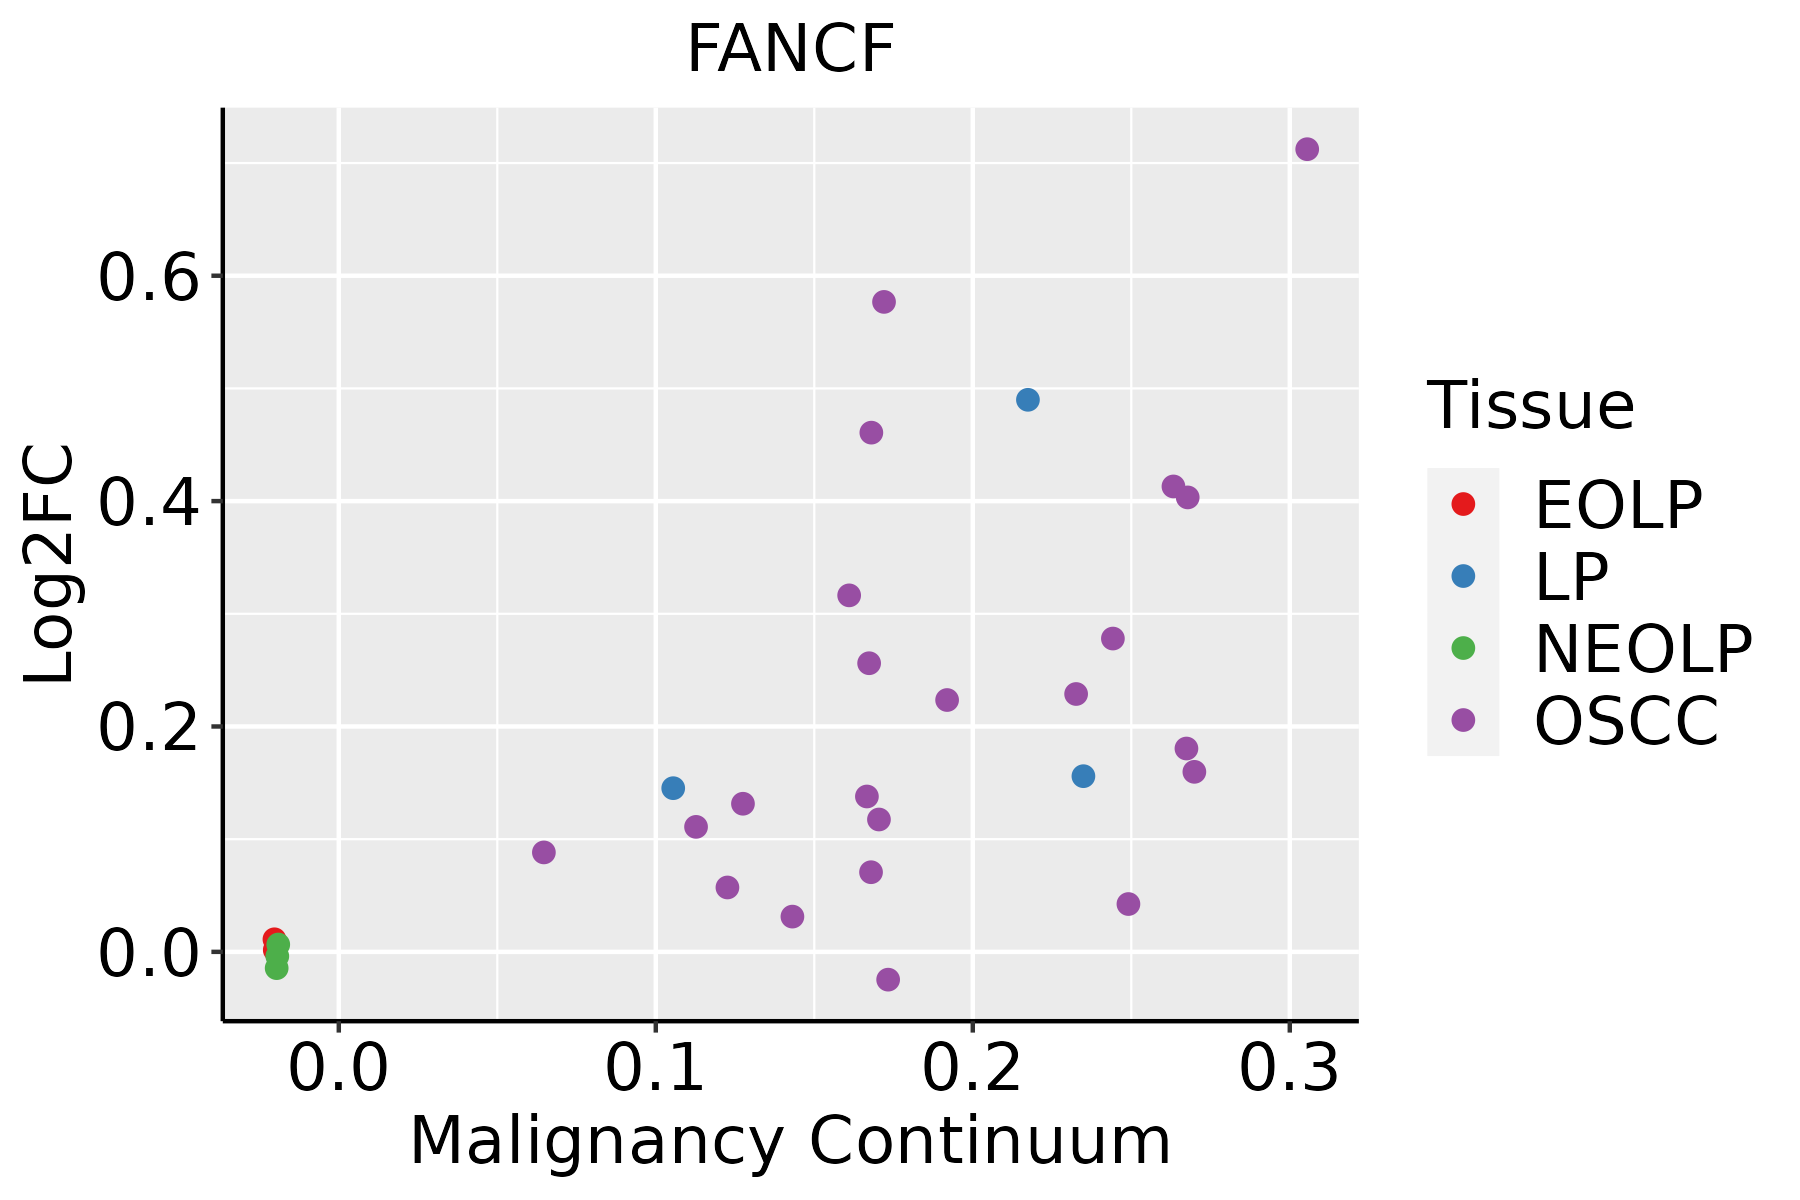 | EOLP: Erosive Oral lichen planus |
| LP: leukoplakia | ||
| NEOLP: Non-erosive oral lichen planus | ||
| OSCC: Oral squamous cell carcinoma | ||
| Skin |  | AK: Actinic keratosis |
| cSCC: Cutaneous squamous cell carcinoma | ||
| SCCIS:squamous cell carcinoma in situ |
| ∗log2FC in expression of this searched gene in stem-like cells from each diseased tissue sample relative to stem-like cells in normal samples in each tissue plotted against the malignancy continuum. Samples are colored based on if they are from different disease stage. |
Top |
Malignant transformation related pathway analysis |
| Find out the enriched GO biological processes and KEGG pathways involved in transition from healthy to precancer to cancer |
| Tissue | Disease Stage | Enriched GO biological Processes |
| Colorectum | AD |  |
| Colorectum | SER |  |
| Colorectum | MSS |  |
| Colorectum | MSI-H |  |
| Colorectum | FAP |  |
| ∗Top 15 enriched GO BP terms are showed in the bar plot of each disease state in each tissue. Each row represents a significant GO biological process which is colored according to the -log10(p.adjust). |
| Page: 1 2 3 4 5 6 7 8 9 |
| GO ID | Tissue | Disease Stage | Description | Gene Ratio | Bg Ratio | pvalue | p.adjust | Count |
| Page: 1 |
| Pathway ID | Tissue | Disease Stage | Description | Gene Ratio | Bg Ratio | pvalue | p.adjust | qvalue | Count |
| Page: 1 |
Top |
Cell-cell communication analysis |
| Identification of potential cell-cell interactions between two cell types and their ligand-receptor pairs for different disease states |
| Ligand | Receptor | LRpair | Pathway | Tissue | Disease Stage |
| Page: 1 |
Top |
Single-cell gene regulatory network inference analysis |
| Find out the significant the regulons (TFs) and the target genes of each regulon across cell types for different disease states |
| TF | Cell Type | Tissue | Disease Stage | Target Gene | RSS | Regulon Activity |
| ∗The dot plots of a searched regulon are shown for all cell subpopulations in each disease state of each tissue based on the regulon specific score inferred using pySCENIC and by calculating the average expression. |
| Page: 1 |
Top |
Somatic mutation of malignant transformation related genes |
| Annotation of somatic variants for genes involved in malignant transformation |
| Hugo Symbol | Variant Class | Variant Classification | dbSNP RS | HGVSc | HGVSp | HGVSp Short | SWISSPROT | BIOTYPE | SIFT | PolyPhen | Tumor Sample Barcode | Tissue | Histology | Sex | Age | Stage | Therapy Types | Drugs | Outcome |
| FANCF | SNV | Missense_Mutation | c.1072N>A | p.Ala358Thr | p.A358T | Q9NPI8 | protein_coding | tolerated(0.07) | benign(0.077) | TCGA-A2-A0EU-01 | Breast | breast invasive carcinoma | Female | >=65 | I/II | Unknown | Unknown | SD | |
| FANCF | SNV | Missense_Mutation | c.559A>T | p.Arg187Trp | p.R187W | Q9NPI8 | protein_coding | deleterious(0.04) | benign(0.001) | TCGA-A2-A0T2-01 | Breast | breast invasive carcinoma | Female | >=65 | III/IV | Chemotherapy | xeloda | PD | |
| FANCF | insertion | Frame_Shift_Ins | novel | c.447_448insAGAGATATTTATTTTGTGTTTTTTCCCTATGTCCTATCAAATGAGG | p.Gly150ArgfsTer18 | p.G150Rfs*18 | Q9NPI8 | protein_coding | TCGA-A8-A09E-01 | Breast | breast invasive carcinoma | Female | >=65 | III/IV | Hormone Therapy | anastrozole | SD | ||
| FANCF | insertion | Frame_Shift_Ins | novel | c.7_8insTAGTATGGTTTATTTTTCTAGGTTTTCTGTCCCTC | p.Ser3LeufsTer90 | p.S3Lfs*90 | Q9NPI8 | protein_coding | TCGA-AO-A0J3-01 | Breast | breast invasive carcinoma | Female | >=65 | I/II | Chemotherapy | cyclophosphamide | SD | ||
| FANCF | insertion | Frame_Shift_Ins | novel | c.880_881insT | p.Trp294LeufsTer5 | p.W294Lfs*5 | Q9NPI8 | protein_coding | TCGA-D8-A1XQ-01 | Breast | breast invasive carcinoma | Female | >=65 | I/II | Unknown | Unknown | SD | ||
| FANCF | SNV | Missense_Mutation | c.53C>T | p.Ser18Leu | p.S18L | Q9NPI8 | protein_coding | deleterious(0) | probably_damaging(0.979) | TCGA-EA-A3HU-01 | Cervix | cervical & endocervical cancer | Female | <65 | I/II | Unknown | Unknown | SD | |
| FANCF | SNV | Missense_Mutation | rs758608960 | c.859N>C | p.Tyr287His | p.Y287H | Q9NPI8 | protein_coding | deleterious(0) | possibly_damaging(0.745) | TCGA-AA-3966-01 | Colorectum | colon adenocarcinoma | Female | >=65 | I/II | Unknown | Unknown | SD |
| FANCF | SNV | Missense_Mutation | novel | c.1089N>C | p.Gln363His | p.Q363H | Q9NPI8 | protein_coding | tolerated_low_confidence(0.17) | benign(0.003) | TCGA-CA-6717-01 | Colorectum | colon adenocarcinoma | Male | <65 | I/II | Chemotherapy | oxaliplatin | CR |
| FANCF | SNV | Missense_Mutation | c.68N>C | p.Val23Ala | p.V23A | Q9NPI8 | protein_coding | deleterious(0) | possibly_damaging(0.873) | TCGA-AG-A002-01 | Colorectum | rectum adenocarcinoma | Male | <65 | I/II | Unknown | Unknown | SD | |
| FANCF | SNV | Missense_Mutation | novel | c.482N>A | p.Ser161Tyr | p.S161Y | Q9NPI8 | protein_coding | deleterious(0) | possibly_damaging(0.69) | TCGA-A5-A0G2-01 | Endometrium | uterine corpus endometrioid carcinoma | Female | <65 | III/IV | Unknown | Unknown | SD |
| Page: 1 2 3 4 |
Top |
Related drugs of malignant transformation related genes |
| Identification of chemicals and drugs interact with genes involved in malignant transfromation |
| (DGIdb 4.0) |
| Entrez ID | Symbol | Category | Interaction Types | Drug Claim Name | Drug Name | PMIDs |
| Page: 1 |

Copyright 2023-Present -The University of Texas Health Science Center at Houston |