
|
|||||
|
 | |
| |
| |
| |
| |
| |
|
Gene: FANCE |
Gene summary for FANCE |
| Gene information | Species | Human | Gene symbol | FANCE | Gene ID | 2178 |
| Gene name | FA complementation group E | |
| Gene Alias | FACE | |
| Cytomap | 6p21.31 | |
| Gene Type | protein-coding | GO ID | GO:0006139 | UniProtAcc | Q9HB96 |
Top |
Malignant transformation analysis |
| Identification of the aberrant gene expression in precancerous and cancerous lesions by comparing the gene expression of stem-like cells in diseased tissues with normal stem cells |
| Entrez ID | Symbol | Replicates | Species | Organ | Tissue | Adj P-value | Log2FC | Malignancy |
| 2178 | FANCE | P1T-E | Human | Esophagus | ESCC | 8.13e-03 | 1.53e-01 | 0.0875 |
| 2178 | FANCE | P2T-E | Human | Esophagus | ESCC | 1.57e-07 | 1.90e-01 | 0.1177 |
| 2178 | FANCE | P4T-E | Human | Esophagus | ESCC | 9.14e-08 | 2.03e-01 | 0.1323 |
| 2178 | FANCE | P5T-E | Human | Esophagus | ESCC | 2.32e-02 | 1.31e-01 | 0.1327 |
| 2178 | FANCE | P8T-E | Human | Esophagus | ESCC | 2.78e-02 | 5.44e-02 | 0.0889 |
| 2178 | FANCE | P9T-E | Human | Esophagus | ESCC | 7.15e-07 | 2.09e-01 | 0.1131 |
| 2178 | FANCE | P10T-E | Human | Esophagus | ESCC | 1.41e-03 | 9.02e-02 | 0.116 |
| 2178 | FANCE | P12T-E | Human | Esophagus | ESCC | 2.41e-11 | 2.73e-01 | 0.1122 |
| 2178 | FANCE | P15T-E | Human | Esophagus | ESCC | 1.86e-11 | 1.74e-01 | 0.1149 |
| 2178 | FANCE | P17T-E | Human | Esophagus | ESCC | 1.42e-02 | 2.10e-01 | 0.1278 |
| 2178 | FANCE | P21T-E | Human | Esophagus | ESCC | 4.39e-05 | 1.56e-01 | 0.1617 |
| 2178 | FANCE | P22T-E | Human | Esophagus | ESCC | 6.95e-06 | 1.81e-01 | 0.1236 |
| 2178 | FANCE | P23T-E | Human | Esophagus | ESCC | 3.12e-04 | 1.73e-01 | 0.108 |
| 2178 | FANCE | P24T-E | Human | Esophagus | ESCC | 3.49e-02 | 8.66e-02 | 0.1287 |
| 2178 | FANCE | P26T-E | Human | Esophagus | ESCC | 1.34e-03 | 7.61e-02 | 0.1276 |
| 2178 | FANCE | P27T-E | Human | Esophagus | ESCC | 1.48e-05 | 1.38e-01 | 0.1055 |
| 2178 | FANCE | P28T-E | Human | Esophagus | ESCC | 1.17e-13 | 3.25e-01 | 0.1149 |
| 2178 | FANCE | P30T-E | Human | Esophagus | ESCC | 1.75e-11 | 4.03e-01 | 0.137 |
| 2178 | FANCE | P31T-E | Human | Esophagus | ESCC | 5.97e-10 | 2.51e-01 | 0.1251 |
| 2178 | FANCE | P37T-E | Human | Esophagus | ESCC | 3.10e-10 | 1.96e-01 | 0.1371 |
| Page: 1 2 3 |
| Tissue | Expression Dynamics | Abbreviation |
| Esophagus |  | ESCC: Esophageal squamous cell carcinoma |
| HGIN: High-grade intraepithelial neoplasias | ||
| LGIN: Low-grade intraepithelial neoplasias | ||
| Oral Cavity | 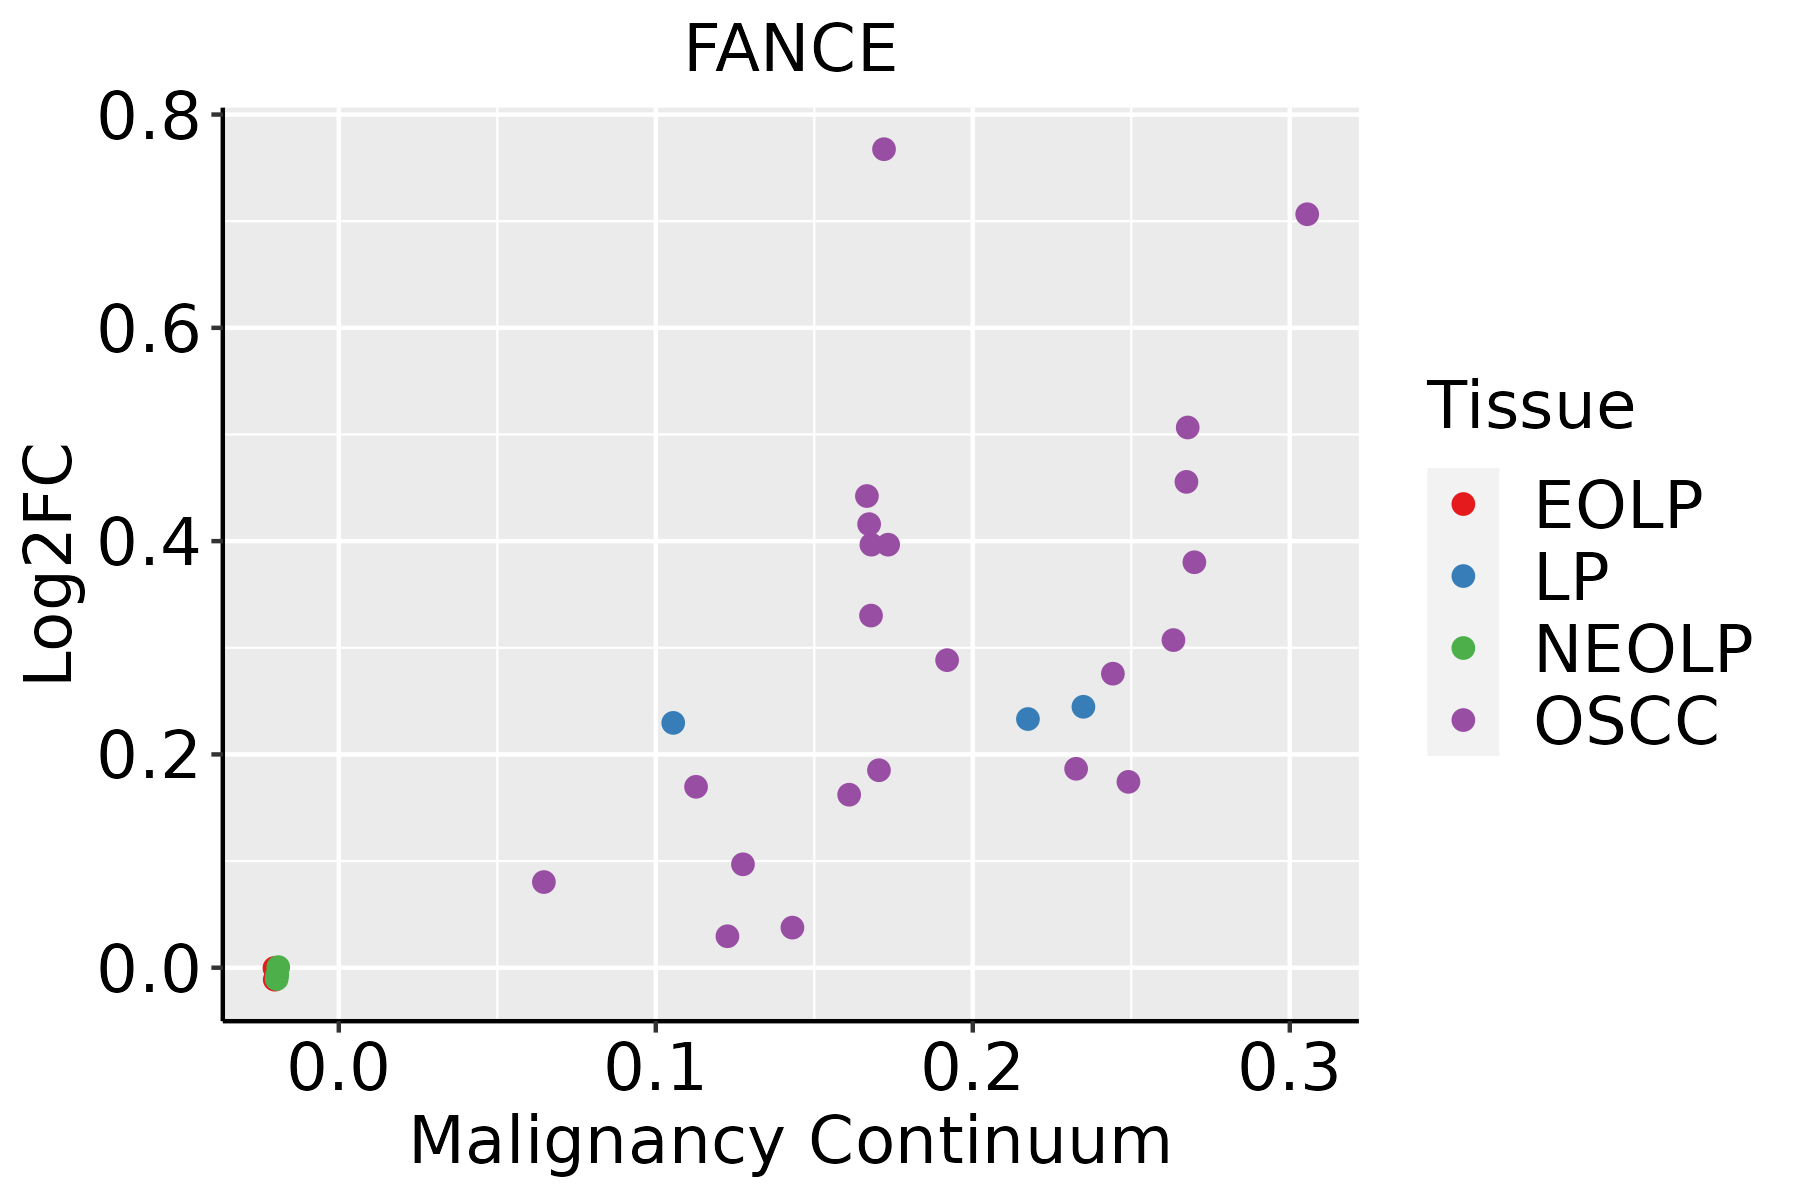 | EOLP: Erosive Oral lichen planus |
| LP: leukoplakia | ||
| NEOLP: Non-erosive oral lichen planus | ||
| OSCC: Oral squamous cell carcinoma |
| ∗log2FC in expression of this searched gene in stem-like cells from each diseased tissue sample relative to stem-like cells in normal samples in each tissue plotted against the malignancy continuum. Samples are colored based on if they are from different disease stage. |
Top |
Malignant transformation related pathway analysis |
| Find out the enriched GO biological processes and KEGG pathways involved in transition from healthy to precancer to cancer |
| Tissue | Disease Stage | Enriched GO biological Processes |
| Colorectum | AD |  |
| Colorectum | SER |  |
| Colorectum | MSS |  |
| Colorectum | MSI-H |  |
| Colorectum | FAP |  |
| ∗Top 15 enriched GO BP terms are showed in the bar plot of each disease state in each tissue. Each row represents a significant GO biological process which is colored according to the -log10(p.adjust). |
| Page: 1 2 3 4 5 6 7 8 9 |
| GO ID | Tissue | Disease Stage | Description | Gene Ratio | Bg Ratio | pvalue | p.adjust | Count |
| Page: 1 |
| Pathway ID | Tissue | Disease Stage | Description | Gene Ratio | Bg Ratio | pvalue | p.adjust | qvalue | Count |
| Page: 1 |
Top |
Cell-cell communication analysis |
| Identification of potential cell-cell interactions between two cell types and their ligand-receptor pairs for different disease states |
| Ligand | Receptor | LRpair | Pathway | Tissue | Disease Stage |
| Page: 1 |
Top |
Single-cell gene regulatory network inference analysis |
| Find out the significant the regulons (TFs) and the target genes of each regulon across cell types for different disease states |
| TF | Cell Type | Tissue | Disease Stage | Target Gene | RSS | Regulon Activity |
| ∗The dot plots of a searched regulon are shown for all cell subpopulations in each disease state of each tissue based on the regulon specific score inferred using pySCENIC and by calculating the average expression. |
| Page: 1 |
Top |
Somatic mutation of malignant transformation related genes |
| Annotation of somatic variants for genes involved in malignant transformation |
| Hugo Symbol | Variant Class | Variant Classification | dbSNP RS | HGVSc | HGVSp | HGVSp Short | SWISSPROT | BIOTYPE | SIFT | PolyPhen | Tumor Sample Barcode | Tissue | Histology | Sex | Age | Stage | Therapy Types | Drugs | Outcome |
| FANCE | SNV | Missense_Mutation | c.698N>A | p.Arg233Lys | p.R233K | Q9HB96 | protein_coding | tolerated(0.55) | benign(0.018) | TCGA-A2-A0ST-01 | Breast | breast invasive carcinoma | Female | <65 | I/II | Chemotherapy | adriamycin | SD | |
| FANCE | SNV | Missense_Mutation | c.487N>G | p.Gln163Glu | p.Q163E | Q9HB96 | protein_coding | deleterious(0.01) | benign(0.079) | TCGA-AR-A250-01 | Breast | breast invasive carcinoma | Female | <65 | I/II | Chemotherapy | doxorubicin | SD | |
| FANCE | SNV | Missense_Mutation | rs373159305 | c.313N>A | p.Val105Ile | p.V105I | Q9HB96 | protein_coding | deleterious(0.02) | benign(0.296) | TCGA-BH-A0DX-01 | Breast | breast invasive carcinoma | Female | <65 | I/II | Chemotherapy | taxotere | CR |
| FANCE | SNV | Missense_Mutation | rs375195621 | c.274N>T | p.Arg92Trp | p.R92W | Q9HB96 | protein_coding | tolerated(0.19) | benign(0) | TCGA-BH-A0HF-01 | Breast | breast invasive carcinoma | Female | >=65 | I/II | Hormone Therapy | arimidex | SD |
| FANCE | insertion | Frame_Shift_Ins | novel | c.696_697insGGCCTGTCATATGATAGAT | p.Arg233GlyfsTer7 | p.R233Gfs*7 | Q9HB96 | protein_coding | TCGA-A2-A0CM-01 | Breast | breast invasive carcinoma | Female | <65 | I/II | Chemotherapy | adriamycin | PD | ||
| FANCE | deletion | Frame_Shift_Del | novel | c.1571delN | p.Lys525SerfsTer3 | p.K525Sfs*3 | Q9HB96 | protein_coding | TCGA-EW-A2FV-01 | Breast | breast invasive carcinoma | Female | <65 | III/IV | Chemotherapy | docetaxel | SD | ||
| FANCE | SNV | Missense_Mutation | rs377415237 | c.1588G>A | p.Ala530Thr | p.A530T | Q9HB96 | protein_coding | tolerated(0.1) | benign(0.134) | TCGA-2W-A8YY-01 | Cervix | cervical & endocervical cancer | Female | <65 | I/II | Chemotherapy | cisplatin | CR |
| FANCE | SNV | Missense_Mutation | rs754914337 | c.952N>A | p.Glu318Lys | p.E318K | Q9HB96 | protein_coding | deleterious(0.02) | possibly_damaging(0.677) | TCGA-AA-3984-01 | Colorectum | colon adenocarcinoma | Female | <65 | I/II | Unknown | Unknown | SD |
| FANCE | SNV | Missense_Mutation | rs763151358 | c.598C>T | p.Arg200Cys | p.R200C | Q9HB96 | protein_coding | deleterious(0.02) | possibly_damaging(0.828) | TCGA-DM-A28E-01 | Colorectum | colon adenocarcinoma | Female | >=65 | I/II | Unknown | Unknown | SD |
| FANCE | SNV | Missense_Mutation | rs763151358 | c.598N>T | p.Arg200Cys | p.R200C | Q9HB96 | protein_coding | deleterious(0.02) | possibly_damaging(0.828) | TCGA-WS-AB45-01 | Colorectum | colon adenocarcinoma | Female | <65 | I/II | Unknown | Unknown | SD |
| Page: 1 2 3 4 5 6 |
Top |
Related drugs of malignant transformation related genes |
| Identification of chemicals and drugs interact with genes involved in malignant transfromation |
| (DGIdb 4.0) |
| Entrez ID | Symbol | Category | Interaction Types | Drug Claim Name | Drug Name | PMIDs |
| Page: 1 |

Copyright 2023-Present -The University of Texas Health Science Center at Houston |