
|
|||||
|
 | |
| |
| |
| |
| |
| |
|
Gene: FAM98B |
Gene summary for FAM98B |
| Gene information | Species | Human | Gene symbol | FAM98B | Gene ID | 283742 |
| Gene name | family with sequence similarity 98 member B | |
| Gene Alias | FAM98B | |
| Cytomap | 15q14 | |
| Gene Type | protein-coding | GO ID | GO:0006464 | UniProtAcc | Q52LJ0 |
Top |
Malignant transformation analysis |
| Identification of the aberrant gene expression in precancerous and cancerous lesions by comparing the gene expression of stem-like cells in diseased tissues with normal stem cells |
| Entrez ID | Symbol | Replicates | Species | Organ | Tissue | Adj P-value | Log2FC | Malignancy |
| 283742 | FAM98B | LZE4T | Human | Esophagus | ESCC | 8.01e-06 | 1.08e-01 | 0.0811 |
| 283742 | FAM98B | LZE24T | Human | Esophagus | ESCC | 9.92e-05 | 5.22e-02 | 0.0596 |
| 283742 | FAM98B | P2T-E | Human | Esophagus | ESCC | 2.69e-16 | 2.53e-01 | 0.1177 |
| 283742 | FAM98B | P4T-E | Human | Esophagus | ESCC | 2.61e-17 | 4.69e-01 | 0.1323 |
| 283742 | FAM98B | P5T-E | Human | Esophagus | ESCC | 4.76e-09 | 2.10e-01 | 0.1327 |
| 283742 | FAM98B | P8T-E | Human | Esophagus | ESCC | 5.03e-14 | 2.37e-01 | 0.0889 |
| 283742 | FAM98B | P9T-E | Human | Esophagus | ESCC | 2.20e-03 | 1.22e-01 | 0.1131 |
| 283742 | FAM98B | P10T-E | Human | Esophagus | ESCC | 7.38e-27 | 4.60e-01 | 0.116 |
| 283742 | FAM98B | P11T-E | Human | Esophagus | ESCC | 1.04e-05 | 2.40e-01 | 0.1426 |
| 283742 | FAM98B | P12T-E | Human | Esophagus | ESCC | 1.73e-12 | 2.79e-01 | 0.1122 |
| 283742 | FAM98B | P15T-E | Human | Esophagus | ESCC | 9.29e-13 | 3.12e-01 | 0.1149 |
| 283742 | FAM98B | P16T-E | Human | Esophagus | ESCC | 8.15e-19 | 2.85e-01 | 0.1153 |
| 283742 | FAM98B | P20T-E | Human | Esophagus | ESCC | 2.65e-09 | 8.59e-02 | 0.1124 |
| 283742 | FAM98B | P21T-E | Human | Esophagus | ESCC | 8.53e-12 | 1.81e-01 | 0.1617 |
| 283742 | FAM98B | P22T-E | Human | Esophagus | ESCC | 2.59e-15 | 2.78e-01 | 0.1236 |
| 283742 | FAM98B | P23T-E | Human | Esophagus | ESCC | 4.83e-16 | 2.96e-01 | 0.108 |
| 283742 | FAM98B | P24T-E | Human | Esophagus | ESCC | 3.44e-05 | 1.21e-01 | 0.1287 |
| 283742 | FAM98B | P26T-E | Human | Esophagus | ESCC | 2.70e-17 | 2.91e-01 | 0.1276 |
| 283742 | FAM98B | P27T-E | Human | Esophagus | ESCC | 1.41e-14 | 2.28e-01 | 0.1055 |
| 283742 | FAM98B | P28T-E | Human | Esophagus | ESCC | 5.00e-15 | 3.20e-01 | 0.1149 |
| Page: 1 2 3 4 |
| Tissue | Expression Dynamics | Abbreviation |
| Esophagus | 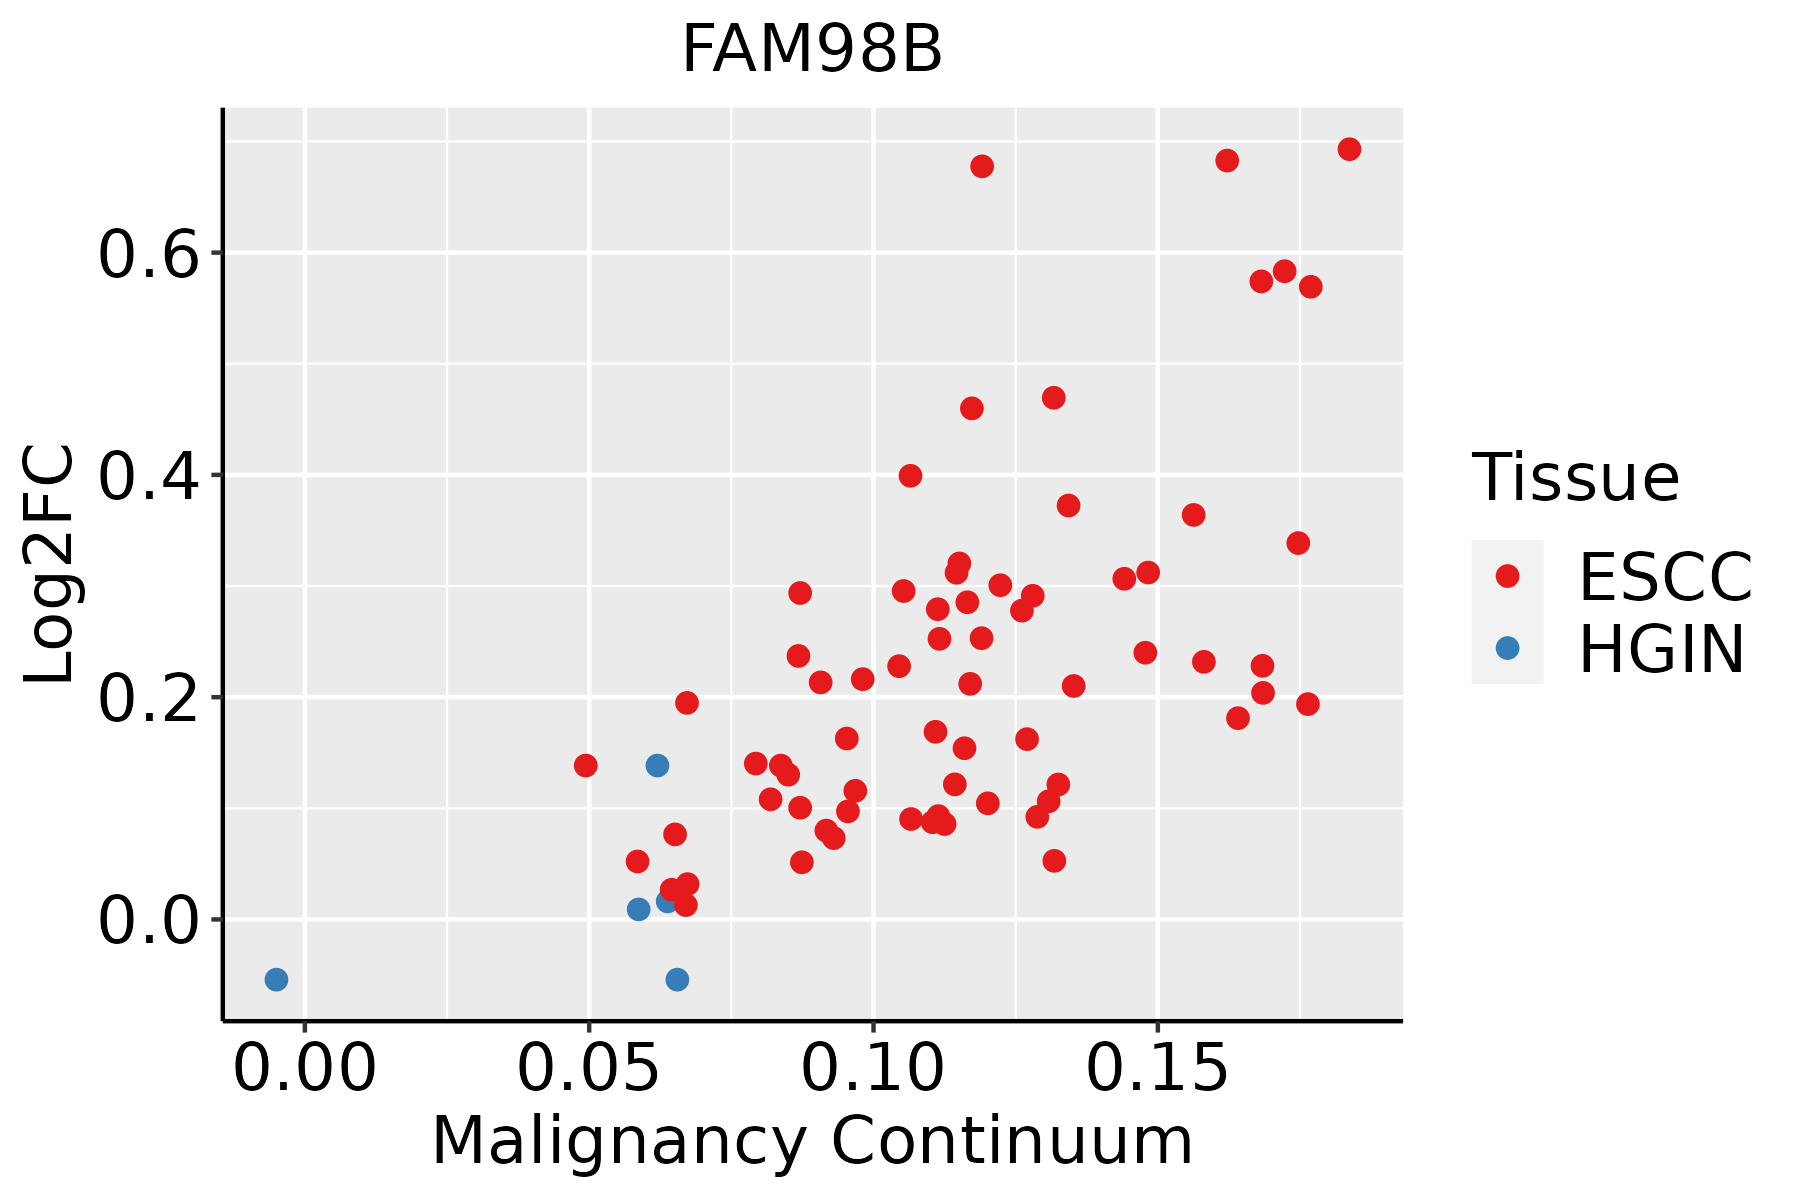 | ESCC: Esophageal squamous cell carcinoma |
| HGIN: High-grade intraepithelial neoplasias | ||
| LGIN: Low-grade intraepithelial neoplasias | ||
| Liver |  | HCC: Hepatocellular carcinoma |
| NAFLD: Non-alcoholic fatty liver disease | ||
| Oral Cavity | 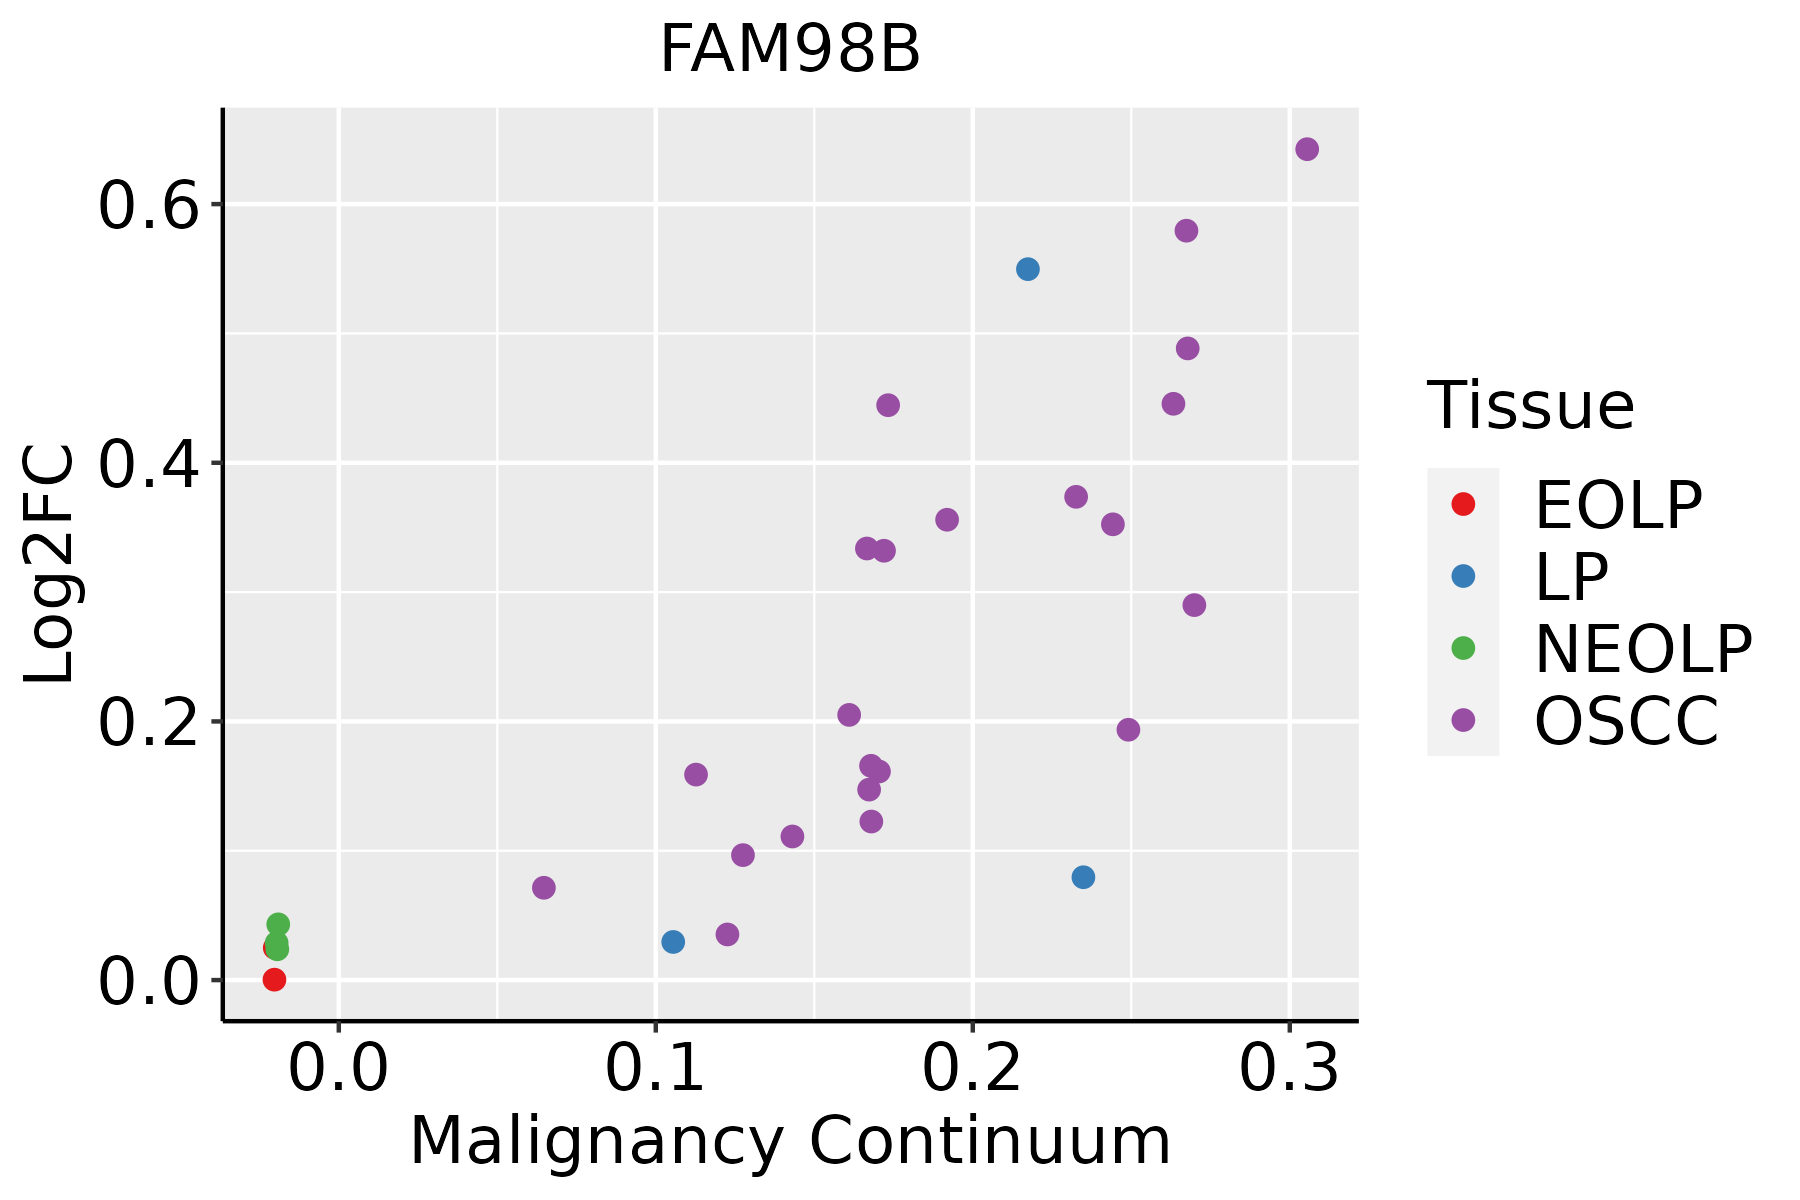 | EOLP: Erosive Oral lichen planus |
| LP: leukoplakia | ||
| NEOLP: Non-erosive oral lichen planus | ||
| OSCC: Oral squamous cell carcinoma | ||
| Skin |  | AK: Actinic keratosis |
| cSCC: Cutaneous squamous cell carcinoma | ||
| SCCIS:squamous cell carcinoma in situ |
| ∗log2FC in expression of this searched gene in stem-like cells from each diseased tissue sample relative to stem-like cells in normal samples in each tissue plotted against the malignancy continuum. Samples are colored based on if they are from different disease stage. |
Top |
Malignant transformation related pathway analysis |
| Find out the enriched GO biological processes and KEGG pathways involved in transition from healthy to precancer to cancer |
| Tissue | Disease Stage | Enriched GO biological Processes |
| Colorectum | AD |  |
| Colorectum | SER |  |
| Colorectum | MSS |  |
| Colorectum | MSI-H |  |
| Colorectum | FAP |  |
| ∗Top 15 enriched GO BP terms are showed in the bar plot of each disease state in each tissue. Each row represents a significant GO biological process which is colored according to the -log10(p.adjust). |
| Page: 1 2 3 4 5 6 7 8 9 |
| GO ID | Tissue | Disease Stage | Description | Gene Ratio | Bg Ratio | pvalue | p.adjust | Count |
| GO:00434143 | Esophagus | ESCC | macromolecule methylation | 199/8552 | 316/18723 | 3.44e-10 | 9.57e-09 | 199 |
| GO:00322592 | Esophagus | ESCC | methylation | 222/8552 | 364/18723 | 2.26e-09 | 5.09e-08 | 222 |
| GO:000647914 | Esophagus | ESCC | protein methylation | 115/8552 | 181/18723 | 9.07e-07 | 1.16e-05 | 115 |
| GO:000821314 | Esophagus | ESCC | protein alkylation | 115/8552 | 181/18723 | 9.07e-07 | 1.16e-05 | 115 |
| GO:00434141 | Liver | HCC | macromolecule methylation | 183/7958 | 316/18723 | 2.00e-08 | 4.72e-07 | 183 |
| GO:0032259 | Liver | HCC | methylation | 206/7958 | 364/18723 | 3.35e-08 | 7.53e-07 | 206 |
| GO:00064792 | Liver | HCC | protein methylation | 111/7958 | 181/18723 | 2.36e-07 | 4.18e-06 | 111 |
| GO:00082132 | Liver | HCC | protein alkylation | 111/7958 | 181/18723 | 2.36e-07 | 4.18e-06 | 111 |
| GO:00064797 | Oral cavity | OSCC | protein methylation | 92/7305 | 181/18723 | 7.86e-04 | 4.26e-03 | 92 |
| GO:00082137 | Oral cavity | OSCC | protein alkylation | 92/7305 | 181/18723 | 7.86e-04 | 4.26e-03 | 92 |
| GO:00434142 | Oral cavity | OSCC | macromolecule methylation | 149/7305 | 316/18723 | 1.82e-03 | 8.60e-03 | 149 |
| GO:00322591 | Oral cavity | OSCC | methylation | 168/7305 | 364/18723 | 3.03e-03 | 1.31e-02 | 168 |
| GO:000647915 | Skin | cSCC | protein methylation | 67/4864 | 181/18723 | 6.65e-04 | 4.75e-03 | 67 |
| GO:000821315 | Skin | cSCC | protein alkylation | 67/4864 | 181/18723 | 6.65e-04 | 4.75e-03 | 67 |
| GO:004341411 | Skin | cSCC | macromolecule methylation | 107/4864 | 316/18723 | 1.03e-03 | 6.94e-03 | 107 |
| GO:00322593 | Skin | cSCC | methylation | 120/4864 | 364/18723 | 1.61e-03 | 9.93e-03 | 120 |
| Page: 1 |
| Pathway ID | Tissue | Disease Stage | Description | Gene Ratio | Bg Ratio | pvalue | p.adjust | qvalue | Count |
| Page: 1 |
Top |
Cell-cell communication analysis |
| Identification of potential cell-cell interactions between two cell types and their ligand-receptor pairs for different disease states |
| Ligand | Receptor | LRpair | Pathway | Tissue | Disease Stage |
| Page: 1 |
Top |
Single-cell gene regulatory network inference analysis |
| Find out the significant the regulons (TFs) and the target genes of each regulon across cell types for different disease states |
| TF | Cell Type | Tissue | Disease Stage | Target Gene | RSS | Regulon Activity |
| ∗The dot plots of a searched regulon are shown for all cell subpopulations in each disease state of each tissue based on the regulon specific score inferred using pySCENIC and by calculating the average expression. |
| Page: 1 |
Top |
Somatic mutation of malignant transformation related genes |
| Annotation of somatic variants for genes involved in malignant transformation |
| Hugo Symbol | Variant Class | Variant Classification | dbSNP RS | HGVSc | HGVSp | HGVSp Short | SWISSPROT | BIOTYPE | SIFT | PolyPhen | Tumor Sample Barcode | Tissue | Histology | Sex | Age | Stage | Therapy Types | Drugs | Outcome |
| FAM98B | SNV | Missense_Mutation | novel | c.716N>G | p.Ser239Cys | p.S239C | Q52LJ0 | protein_coding | deleterious(0.03) | possibly_damaging(0.582) | TCGA-5L-AAT1-01 | Breast | breast invasive carcinoma | Female | <65 | III/IV | Hormone Therapy | letrozol | SD |
| FAM98B | SNV | Missense_Mutation | novel | c.207N>G | p.Ile69Met | p.I69M | Q52LJ0 | protein_coding | tolerated(0.06) | possibly_damaging(0.5) | TCGA-BH-A0B6-01 | Breast | breast invasive carcinoma | Female | <65 | I/II | Unknown | Unknown | SD |
| FAM98B | SNV | Missense_Mutation | rs777802537 | c.316N>T | p.Arg106Cys | p.R106C | Q52LJ0 | protein_coding | deleterious(0) | probably_damaging(0.959) | TCGA-BH-A18U-01 | Breast | breast invasive carcinoma | Female | >=65 | III/IV | Unknown | Unknown | SD |
| FAM98B | deletion | In_Frame_Del | novel | c.1242_1274delNNNNNNNNNNNNNNNNNNNNNNNNNNNNNNNNN | p.Gly415_Gly425del | p.G415_G425del | Q52LJ0 | protein_coding | TCGA-BH-A18U-01 | Breast | breast invasive carcinoma | Female | >=65 | III/IV | Unknown | Unknown | SD | ||
| FAM98B | SNV | Missense_Mutation | novel | c.961G>A | p.Glu321Lys | p.E321K | Q52LJ0 | protein_coding | deleterious(0) | probably_damaging(0.998) | TCGA-HM-A4S6-01 | Cervix | cervical & endocervical cancer | Female | <65 | III/IV | Chemotherapy | cisplatin | CR |
| FAM98B | SNV | Missense_Mutation | rs112596936 | c.880G>A | p.Ala294Thr | p.A294T | Q52LJ0 | protein_coding | tolerated(0.11) | benign(0.027) | TCGA-AA-3977-01 | Colorectum | colon adenocarcinoma | Male | >=65 | I/II | Unknown | Unknown | SD |
| FAM98B | SNV | Missense_Mutation | novel | c.399N>T | p.Lys133Asn | p.K133N | Q52LJ0 | protein_coding | deleterious(0) | probably_damaging(0.978) | TCGA-AG-A002-01 | Colorectum | rectum adenocarcinoma | Male | <65 | I/II | Unknown | Unknown | SD |
| FAM98B | SNV | Missense_Mutation | novel | c.274N>A | p.Ala92Thr | p.A92T | Q52LJ0 | protein_coding | tolerated(0.52) | benign(0.266) | TCGA-A5-A0G2-01 | Endometrium | uterine corpus endometrioid carcinoma | Female | <65 | III/IV | Unknown | Unknown | SD |
| FAM98B | SNV | Missense_Mutation | c.338N>A | p.Cys113Tyr | p.C113Y | Q52LJ0 | protein_coding | tolerated(0.14) | possibly_damaging(0.83) | TCGA-A5-A0VQ-01 | Endometrium | uterine corpus endometrioid carcinoma | Female | <65 | I/II | Chemotherapy | carboplatin | SD | |
| FAM98B | SNV | Missense_Mutation | novel | c.461T>G | p.Phe154Cys | p.F154C | Q52LJ0 | protein_coding | tolerated(1) | benign(0) | TCGA-A5-A2K5-01 | Endometrium | uterine corpus endometrioid carcinoma | Female | >=65 | I/II | Unknown | Unknown | SD |
| Page: 1 2 3 4 |
Top |
Related drugs of malignant transformation related genes |
| Identification of chemicals and drugs interact with genes involved in malignant transfromation |
| (DGIdb 4.0) |
| Entrez ID | Symbol | Category | Interaction Types | Drug Claim Name | Drug Name | PMIDs |
| Page: 1 |

Copyright 2023-Present -The University of Texas Health Science Center at Houston |