Schematic overview of the cellular and molecular mechanisms involved in the cancer progression, including the proposed cellular and molecular mechanisms in cancer cells trajectory. AT1: alveolar type 1 cells; AT2: alveolar type 2 cells; AAH: atypical adenomatous hyperplasia; AIS: adenocarcinoma in situ; MIA: minimally invasive adenocarcinoma; IA: invasive adenocarcinoma; EMT: epithelial-mesenchymal transition

Home

Download

Statistics

Help

Contact

Center for Computational Systems Medicine
leaf

Gene summary

leaf

Malignant transformation analysis

leaf

Malignant transformation related pathway analysis

leaf

Cell-cell communication analysis

leaf

Single-cell gene regulatory network inference analysis

leaf

Somatic mutation of malignant transformation related genes

leaf

Related drugs of malignant transformation related genes

Gene: FAM98A

Gene summary for FAM98A

check button Gene summary.

Gene informationSpeciesHuman
Gene symbol

FAM98A

Gene ID

25940

Gene namefamily with sequence similarity 98 member A
Gene AliasFAM98A
Cytomap2p22.3
Gene Typeprotein-coding
GO ID

GO:0006464

UniProtAcc

B4DT23


Top

Malignant transformation analysis

check button Identification of the aberrant gene expression in precancerous and cancerous lesions by comparing the gene expression of stem-like cells in diseased tissues with normal stem cells
check button Malignant transformation involving gene list.
Entrez IDSymbolReplicatesSpeciesOrganTissueAdj P-valueLog2FCMalignancy
25940FAM98ALZE4THumanEsophagusESCC1.62e-082.34e-010.0811
25940FAM98ALZE22THumanEsophagusESCC7.92e-031.69e-010.068
25940FAM98ALZE24THumanEsophagusESCC3.53e-081.81e-010.0596
25940FAM98ALZE21THumanEsophagusESCC2.21e-041.20e-010.0655
25940FAM98ALZE6THumanEsophagusESCC2.40e-022.85e-020.0845
25940FAM98AP1T-EHumanEsophagusESCC1.48e-041.30e-010.0875
25940FAM98AP2T-EHumanEsophagusESCC4.64e-203.14e-010.1177
25940FAM98AP4T-EHumanEsophagusESCC5.96e-195.43e-010.1323
25940FAM98AP5T-EHumanEsophagusESCC1.66e-111.74e-010.1327
25940FAM98AP8T-EHumanEsophagusESCC3.10e-081.28e-010.0889
25940FAM98AP9T-EHumanEsophagusESCC1.28e-161.61e-010.1131
25940FAM98AP10T-EHumanEsophagusESCC2.77e-111.93e-010.116
25940FAM98AP11T-EHumanEsophagusESCC2.36e-165.08e-010.1426
25940FAM98AP12T-EHumanEsophagusESCC1.62e-102.09e-010.1122
25940FAM98AP15T-EHumanEsophagusESCC8.21e-122.30e-010.1149
25940FAM98AP16T-EHumanEsophagusESCC3.82e-122.68e-010.1153
25940FAM98AP17T-EHumanEsophagusESCC3.12e-092.19e-010.1278
25940FAM98AP19T-EHumanEsophagusESCC2.41e-097.67e-010.1662
25940FAM98AP20T-EHumanEsophagusESCC1.74e-112.64e-010.1124
25940FAM98AP21T-EHumanEsophagusESCC1.34e-243.61e-010.1617
Page: 1 2 3 4 5 

check button Transcriptomic changes along malignancy continuum.
TissueExpression DynamicsAbbreviation
EsophagusThe image shows the transcriptomic changes along malignancy continuum.log2FC in expression of this searched gene in stem-like cells from each diseased tissue sample relative to stem-like cells in normal samples in each tissue plotted against the malignancy continuum. Samples are colored based on if they are from different disease stage.ESCC: Esophageal squamous cell carcinoma
HGIN: High-grade intraepithelial neoplasias
LGIN: Low-grade intraepithelial neoplasias
LiverThe image shows the transcriptomic changes along malignancy continuum.log2FC in expression of this searched gene in stem-like cells from each diseased tissue sample relative to stem-like cells in normal samples in each tissue plotted against the malignancy continuum. Samples are colored based on if they are from different disease stage.
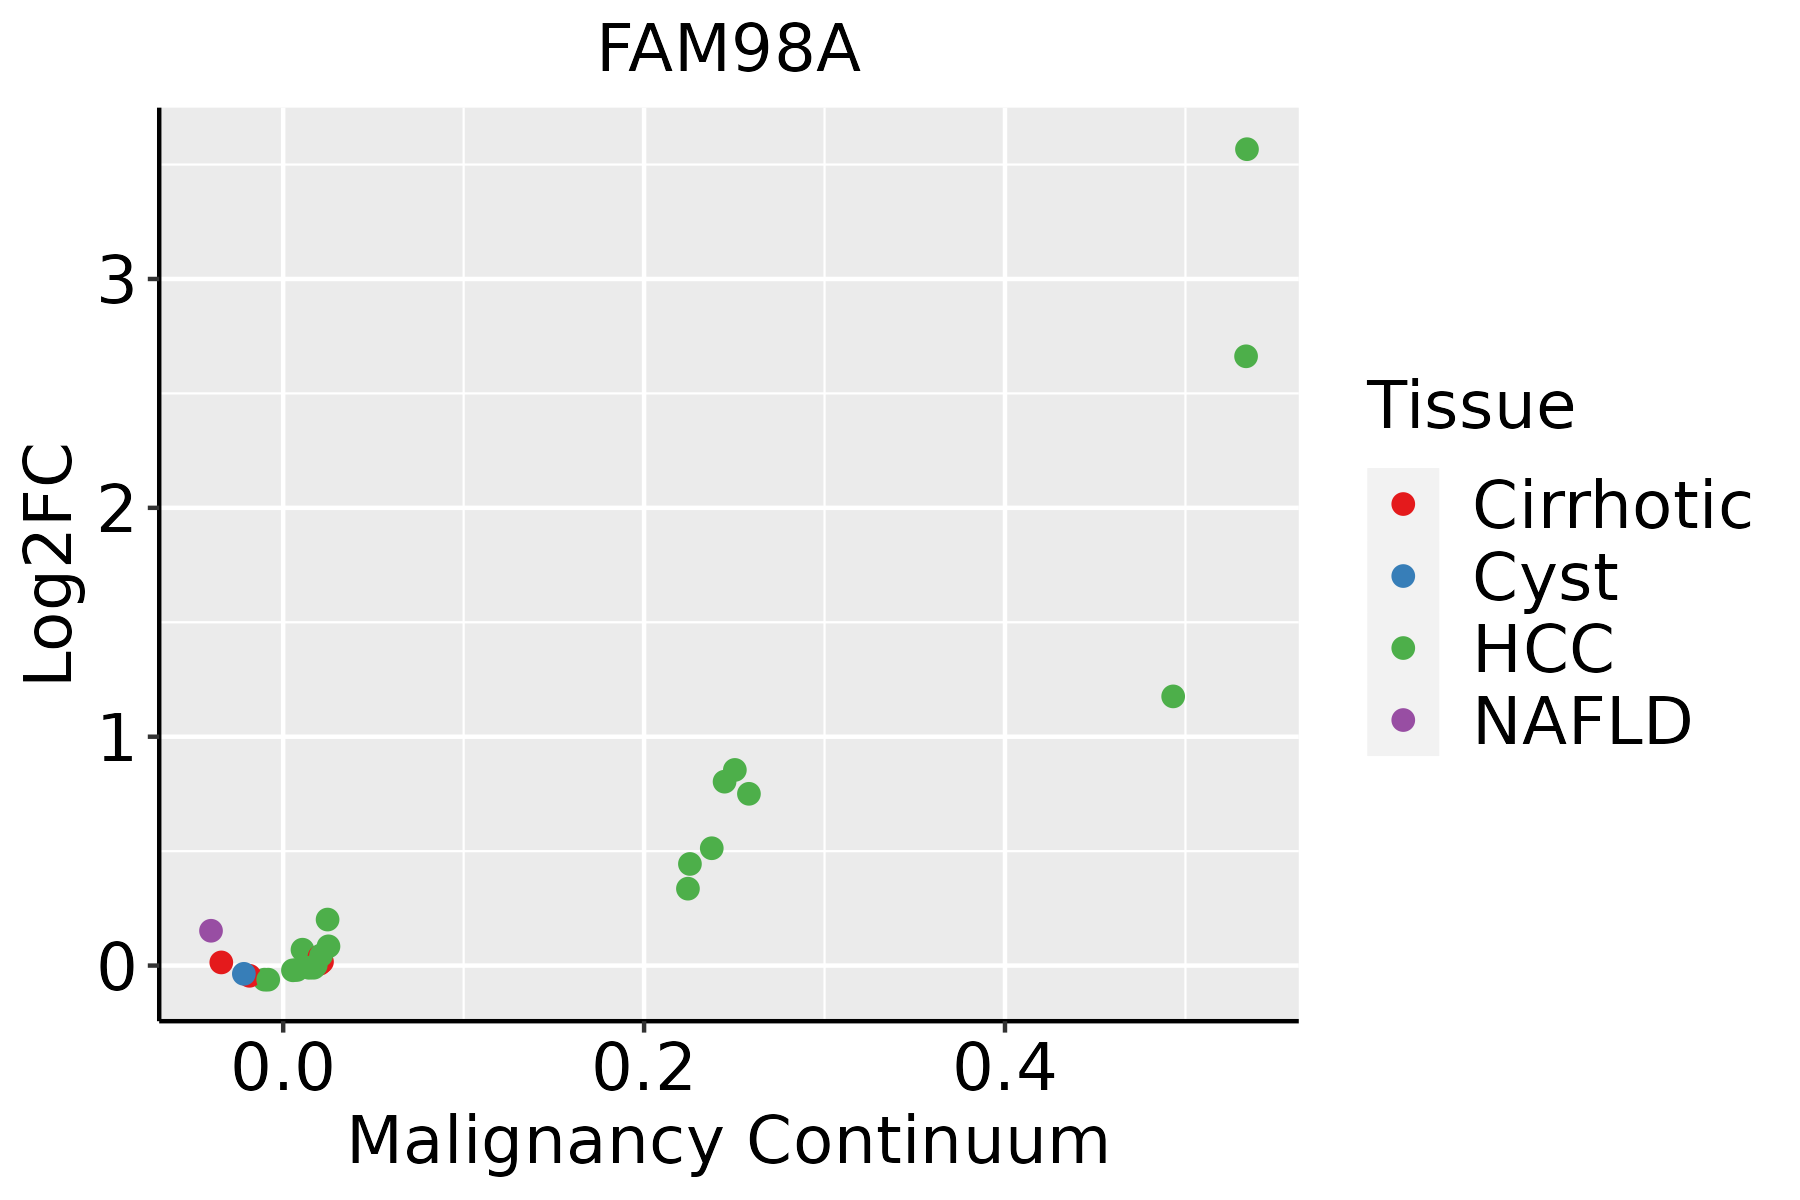
HCC: Hepatocellular carcinoma
NAFLD: Non-alcoholic fatty liver disease
Oral CavityThe image shows the transcriptomic changes along malignancy continuum.log2FC in expression of this searched gene in stem-like cells from each diseased tissue sample relative to stem-like cells in normal samples in each tissue plotted against the malignancy continuum. Samples are colored based on if they are from different disease stage.EOLP: Erosive Oral lichen planus
LP: leukoplakia
NEOLP: Non-erosive oral lichen planus
OSCC: Oral squamous cell carcinoma
ThyroidThe image shows the transcriptomic changes along malignancy continuum.log2FC in expression of this searched gene in stem-like cells from each diseased tissue sample relative to stem-like cells in normal samples in each tissue plotted against the malignancy continuum. Samples are colored based on if they are from different disease stage.
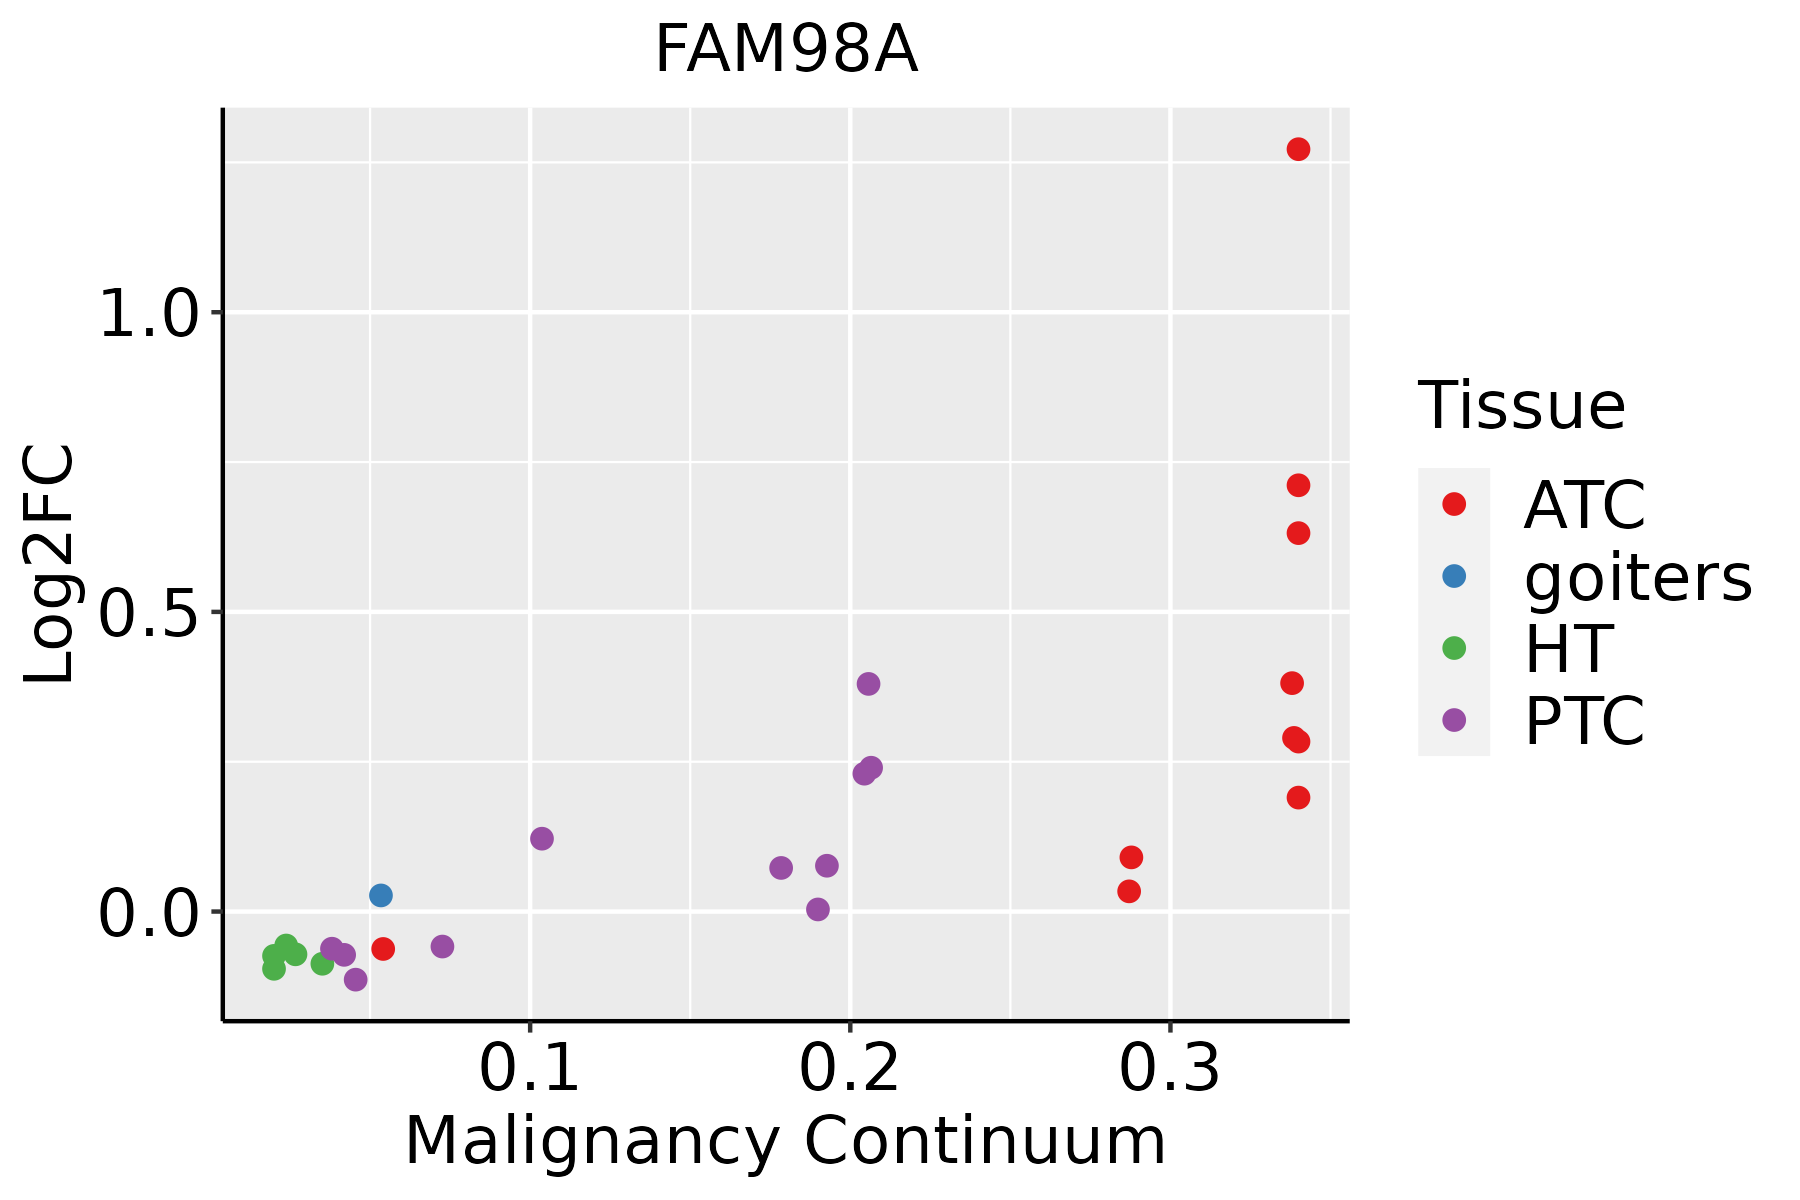
ATC: Anaplastic thyroid cancer
HT: Hashimoto's thyroiditis
PTC: Papillary thyroid cancer
∗log2FC in expression of this searched gene in stem-like cells from each diseased tissue sample relative to stem-like cells in normal samples in each tissue plotted against the malignancy continuum. Samples are colored based on if they are from different disease stage.

Top

Malignant transformation related pathway analysis

check buttonFind out the enriched GO biological processes and KEGG pathways involved in transition from healthy to precancer to cancer
check button Figure of enriched GO biological processes.
TissueDisease StageEnriched GO biological Processes
ColorectumADGO analysis - Figure of enriched GO biological processes: Top 15 enriched GO BP terms are showed in the bar plot of each disease state in each tissue. Each row represents a significant GO biological process which is colored according to the -log10(p.adjust).
ColorectumSERGO analysis - Figure of enriched GO biological processes: Top 15 enriched GO BP terms are showed in the bar plot of each disease state in each tissue. Each row represents a significant GO biological process which is colored according to the -log10(p.adjust).
ColorectumMSSGO analysis - Figure of enriched GO biological processes: Top 15 enriched GO BP terms are showed in the bar plot of each disease state in each tissue. Each row represents a significant GO biological process which is colored according to the -log10(p.adjust).
ColorectumMSI-HGO analysis - Figure of enriched GO biological processes: Top 15 enriched GO BP terms are showed in the bar plot of each disease state in each tissue. Each row represents a significant GO biological process which is colored according to the -log10(p.adjust).
ColorectumFAPGO analysis - Figure of enriched GO biological processes: Top 15 enriched GO BP terms are showed in the bar plot of each disease state in each tissue. Each row represents a significant GO biological process which is colored according to the -log10(p.adjust).
∗Top 15 enriched GO BP terms are showed in the bar plot of each disease state in each tissue. Each row represents a significant GO biological process which is colored according to the -log10(p.adjust).
Page: 1 2 3 4 5 6 7 8 9 

check button Enriched GO biological processes.
GO IDTissueDisease StageDescriptionGene RatioBg Ratiopvaluep.adjustCount
GO:00434143EsophagusESCCmacromolecule methylation199/8552316/187233.44e-109.57e-09199
GO:00322592EsophagusESCCmethylation222/8552364/187232.26e-095.09e-08222
GO:000647914EsophagusESCCprotein methylation115/8552181/187239.07e-071.16e-05115
GO:000821314EsophagusESCCprotein alkylation115/8552181/187239.07e-071.16e-05115
GO:003134616EsophagusESCCpositive regulation of cell projection organization201/8552353/187231.19e-051.11e-04201
GO:00315299EsophagusESCCruffle organization39/855256/187232.44e-041.51e-0339
GO:00971789EsophagusESCCruffle assembly32/855244/187232.50e-041.54e-0332
GO:006049118EsophagusESCCregulation of cell projection assembly110/8552188/187232.60e-041.58e-03110
GO:012003218EsophagusESCCregulation of plasma membrane bounded cell projection assembly108/8552186/187234.37e-042.46e-03108
GO:01200347EsophagusESCCpositive regulation of plasma membrane bounded cell projection assembly64/8552105/187231.15e-035.70e-0364
GO:19000277EsophagusESCCregulation of ruffle assembly21/855231/187231.10e-023.70e-0221
GO:00434141LiverHCCmacromolecule methylation183/7958316/187232.00e-084.72e-07183
GO:0032259LiverHCCmethylation206/7958364/187233.35e-087.53e-07206
GO:00064792LiverHCCprotein methylation111/7958181/187232.36e-074.18e-06111
GO:00082132LiverHCCprotein alkylation111/7958181/187232.36e-074.18e-06111
GO:003134611LiverHCCpositive regulation of cell projection organization193/7958353/187232.28e-063.08e-05193
GO:006049112LiverHCCregulation of cell projection assembly101/7958188/187231.20e-036.69e-03101
GO:012003212LiverHCCregulation of plasma membrane bounded cell projection assembly100/7958186/187231.23e-036.81e-03100
GO:003152911LiverHCCruffle organization34/795856/187234.54e-031.96e-0234
GO:01200344LiverHCCpositive regulation of plasma membrane bounded cell projection assembly58/7958105/187235.66e-032.36e-0258
Page: 1 2 3 

check button Enriched KEGG pathways.
Pathway IDTissueDisease StageDescriptionGene RatioBg Ratiopvaluep.adjustqvalueCount
Page: 1 

Top

Cell-cell communication analysis

check buttonIdentification of potential cell-cell interactions between two cell types and their ligand-receptor pairs for different disease states
LigandReceptorLRpairPathwayTissueDisease Stage
Page: 1 

Top

Single-cell gene regulatory network inference analysis

check buttonFind out the significant the regulons (TFs) and the target genes of each regulon across cell types for different disease states
TFCell TypeTissueDisease StageTarget GeneRSSRegulon Activity
∗The dot plots of a searched regulon are shown for all cell subpopulations in each disease state of each tissue based on the regulon specific score inferred using pySCENIC and by calculating the average expression.
Page: 1 

Top

Somatic mutation of malignant transformation related genes

check buttonAnnotation of somatic variants for genes involved in malignant transformation
Hugo SymbolVariant ClassVariant ClassificationdbSNP RSHGVScHGVSpHGVSp ShortSWISSPROTBIOTYPESIFTPolyPhenTumor Sample BarcodeTissueHistologySexAgeStageTherapy TypesDrugsOutcome
FAM98ASNVMissense_Mutationrs201777834c.625C>Ap.Gln209Lysp.Q209KQ8NCA5protein_codingtolerated(0.3)possibly_damaging(0.703)TCGA-A8-A06R-01Breastbreast invasive carcinomaFemale>=65I/IIChemotherapy5-fluorouracilCR
FAM98ASNVMissense_Mutationnovelc.791N>Ap.Ser264Tyrp.S264YQ8NCA5protein_codingdeleterious(0)probably_damaging(0.991)TCGA-AN-A046-01Breastbreast invasive carcinomaFemale>=65I/IIUnknownUnknownSD
FAM98ASNVMissense_Mutationc.1157N>Cp.Gly386Alap.G386AQ8NCA5protein_codingtolerated(0.28)possibly_damaging(0.537)TCGA-AN-A04D-01Breastbreast invasive carcinomaFemale<65I/IIUnknownUnknownSD
FAM98ASNVMissense_Mutationc.529G>Ap.Glu177Lysp.E177KQ8NCA5protein_codingtolerated(0.08)benign(0.12)TCGA-AN-A0FS-01Breastbreast invasive carcinomaFemale<65I/IIUnknownUnknownSD
FAM98ASNVMissense_Mutationc.1208N>Cp.Gly403Alap.G403AQ8NCA5protein_codingdeleterious_low_confidence(0.01)benign(0.177)TCGA-AO-A124-01Breastbreast invasive carcinomaFemale<65I/IIChemotherapydoxorubicinSD
FAM98ASNVMissense_Mutationrs201777834c.625N>Ap.Gln209Lysp.Q209KQ8NCA5protein_codingtolerated(0.3)possibly_damaging(0.703)TCGA-BH-A0HO-01Breastbreast invasive carcinomaFemale<65I/IIChemotherapycyclophosphamideSD
FAM98ASNVMissense_Mutationrs201777834c.625N>Ap.Gln209Lysp.Q209KQ8NCA5protein_codingtolerated(0.3)possibly_damaging(0.703)TCGA-BH-A0HQ-01Breastbreast invasive carcinomaFemale<65I/IIHormone TherapyarimidexSD
FAM98ASNVMissense_Mutationc.1514N>Cp.Tyr505Serp.Y505SQ8NCA5protein_codingdeleterious_low_confidence(0)possibly_damaging(0.485)TCGA-BH-A18L-01Breastbreast invasive carcinomaFemale<65III/IVUnknownUnknownSD
FAM98ASNVMissense_Mutationrs201777834c.625N>Ap.Gln209Lysp.Q209KQ8NCA5protein_codingtolerated(0.3)possibly_damaging(0.703)TCGA-BH-A1F8-01Breastbreast invasive carcinomaFemale>=65III/IVUnknownUnknownPD
FAM98ASNVMissense_Mutationrs763293643c.229N>Ap.Leu77Ilep.L77IQ8NCA5protein_codingtolerated(0.07)probably_damaging(0.994)TCGA-D8-A1J9-01Breastbreast invasive carcinomaFemale<65I/IIUnknownUnknownSD
Page: 1 2 3 4 5 6 7 8 

Top

Related drugs of malignant transformation related genes

check buttonIdentification of chemicals and drugs interact with genes involved in malignant transfromation
(DGIdb 4.0)
Entrez IDSymbolCategoryInteraction TypesDrug Claim NameDrug NamePMIDs
Page: 1