
|
|||||
|
 | |
| |
| |
| |
| |
| |
|
Gene: FAM96B |
Gene summary for FAM96B |
| Gene information | Species | Human | Gene symbol | FAM96B | Gene ID | 51647 |
| Gene name | cytosolic iron-sulfur assembly component 2B | |
| Gene Alias | CGI-128 | |
| Cytomap | 16q22.1 | |
| Gene Type | protein-coding | GO ID | GO:0006790 | UniProtAcc | Q9Y3D0 |
Top |
Malignant transformation analysis |
| Identification of the aberrant gene expression in precancerous and cancerous lesions by comparing the gene expression of stem-like cells in diseased tissues with normal stem cells |
| Entrez ID | Symbol | Replicates | Species | Organ | Tissue | Adj P-value | Log2FC | Malignancy |
| 51647 | FAM96B | GSM4909281 | Human | Breast | IDC | 1.18e-04 | 2.73e-01 | 0.21 |
| 51647 | FAM96B | GSM4909282 | Human | Breast | IDC | 9.79e-16 | 4.63e-01 | -0.0288 |
| 51647 | FAM96B | GSM4909288 | Human | Breast | IDC | 1.30e-04 | 1.24e-02 | 0.0988 |
| 51647 | FAM96B | GSM4909291 | Human | Breast | IDC | 3.60e-03 | 2.67e-01 | 0.1753 |
| 51647 | FAM96B | GSM4909294 | Human | Breast | IDC | 2.18e-05 | 1.49e-01 | 0.2022 |
| 51647 | FAM96B | GSM4909296 | Human | Breast | IDC | 3.27e-08 | -5.85e-02 | 0.1524 |
| 51647 | FAM96B | GSM4909297 | Human | Breast | IDC | 1.72e-16 | -9.02e-02 | 0.1517 |
| 51647 | FAM96B | GSM4909301 | Human | Breast | IDC | 7.84e-10 | 2.50e-01 | 0.1577 |
| 51647 | FAM96B | GSM4909311 | Human | Breast | IDC | 4.08e-32 | -2.38e-01 | 0.1534 |
| 51647 | FAM96B | GSM4909312 | Human | Breast | IDC | 1.24e-11 | -1.14e-01 | 0.1552 |
| 51647 | FAM96B | GSM4909313 | Human | Breast | IDC | 1.05e-02 | -2.38e-01 | 0.0391 |
| 51647 | FAM96B | GSM4909318 | Human | Breast | IDC | 1.82e-04 | 3.20e-01 | 0.2031 |
| 51647 | FAM96B | GSM4909319 | Human | Breast | IDC | 2.19e-42 | -2.23e-01 | 0.1563 |
| 51647 | FAM96B | GSM4909320 | Human | Breast | IDC | 4.01e-15 | 3.57e-01 | 0.1575 |
| 51647 | FAM96B | GSM4909321 | Human | Breast | IDC | 1.70e-38 | 5.18e-01 | 0.1559 |
| 51647 | FAM96B | brca1 | Human | Breast | Precancer | 1.11e-21 | 5.43e-01 | -0.0338 |
| 51647 | FAM96B | brca2 | Human | Breast | Precancer | 1.42e-04 | 2.07e-01 | -0.024 |
| 51647 | FAM96B | brca3 | Human | Breast | Precancer | 1.82e-09 | 2.62e-01 | -0.0263 |
| 51647 | FAM96B | M2 | Human | Breast | IDC | 5.70e-03 | 6.72e-02 | 0.21 |
| 51647 | FAM96B | NCCBC11 | Human | Breast | DCIS | 3.91e-02 | -2.34e-01 | 0.1232 |
| Page: 1 2 3 4 5 6 7 8 9 10 11 |
| Tissue | Expression Dynamics | Abbreviation |
| Breast | 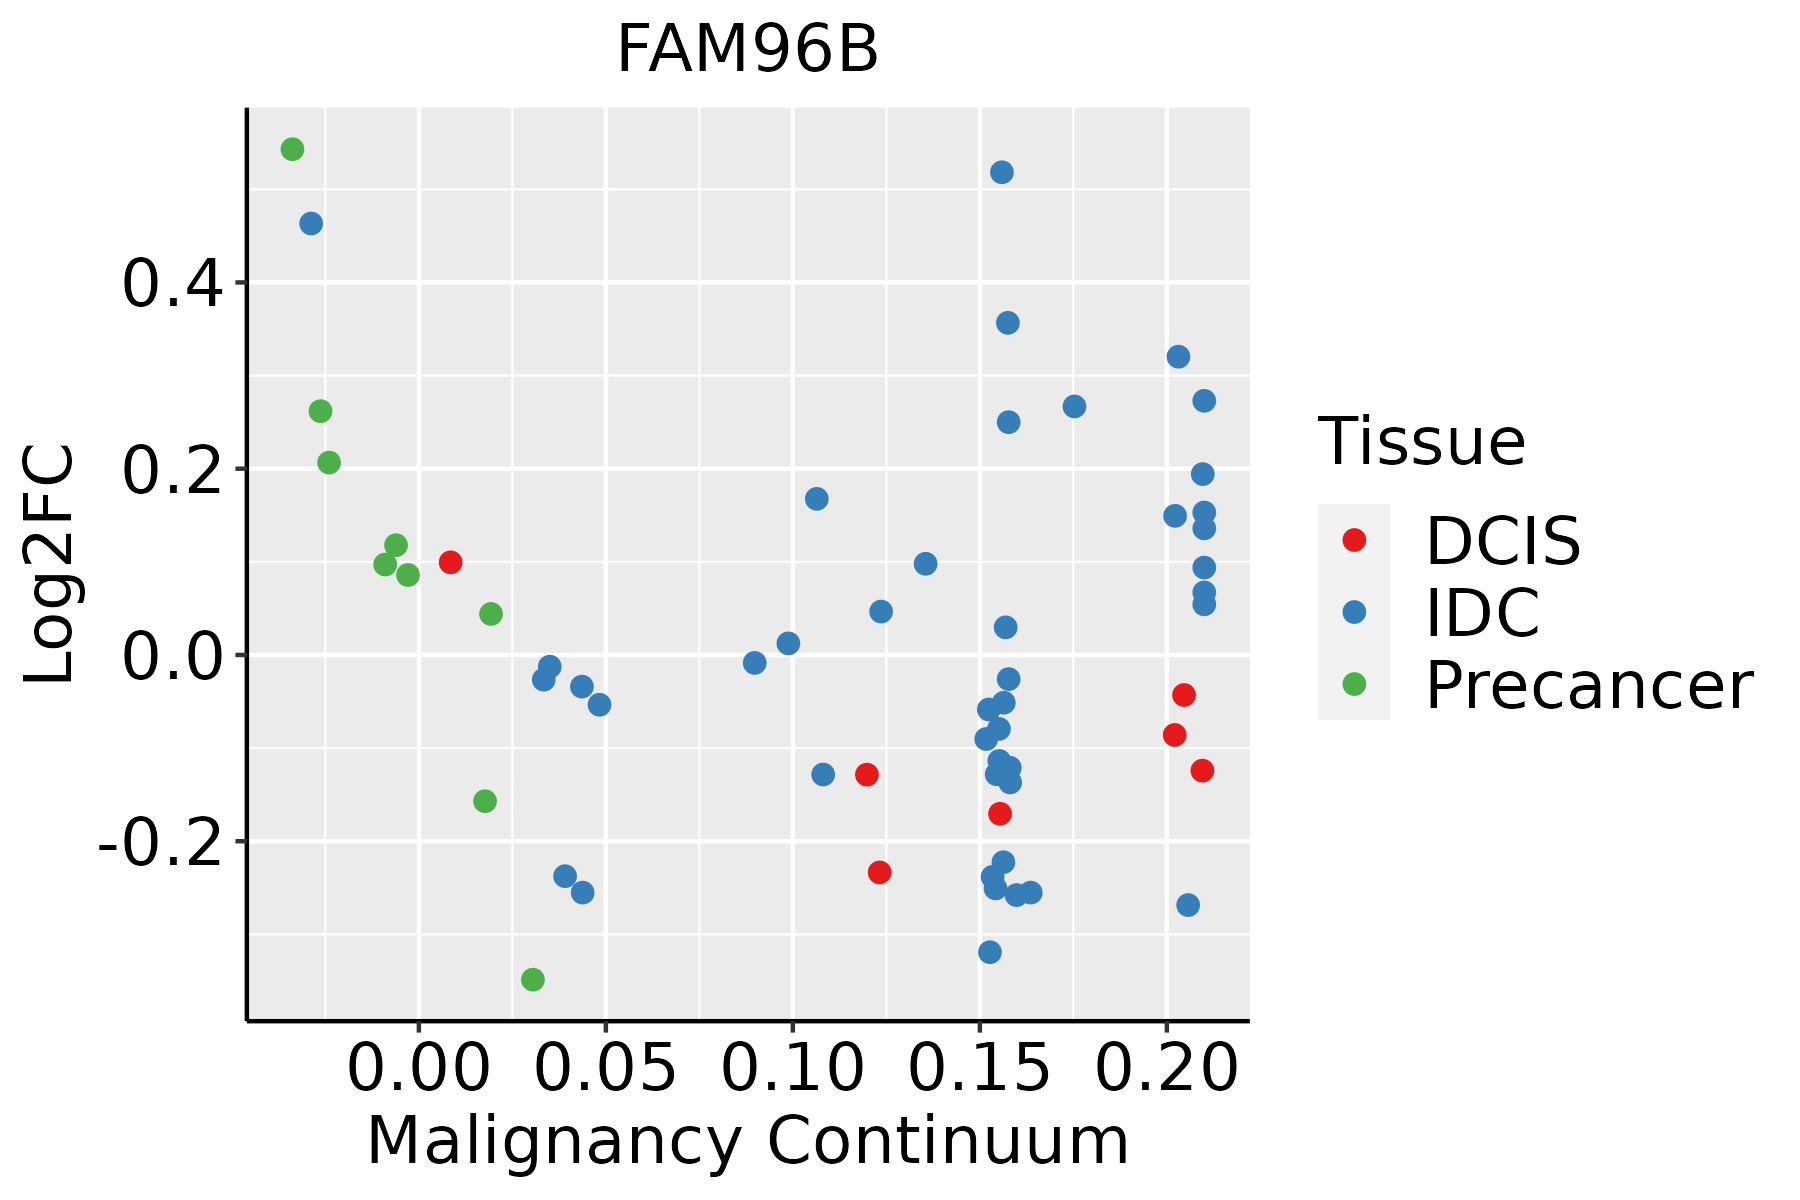 | IDC: Invasive ductal carcinoma |
| DCIS: Ductal carcinoma in situ | ||
| Precancer(BRCA1-mut): Precancerous lesion from BRCA1 mutation carriers | ||
| Colorectum (GSE201348) |  | FAP: Familial adenomatous polyposis |
| CRC: Colorectal cancer | ||
| Colorectum (HTA11) | 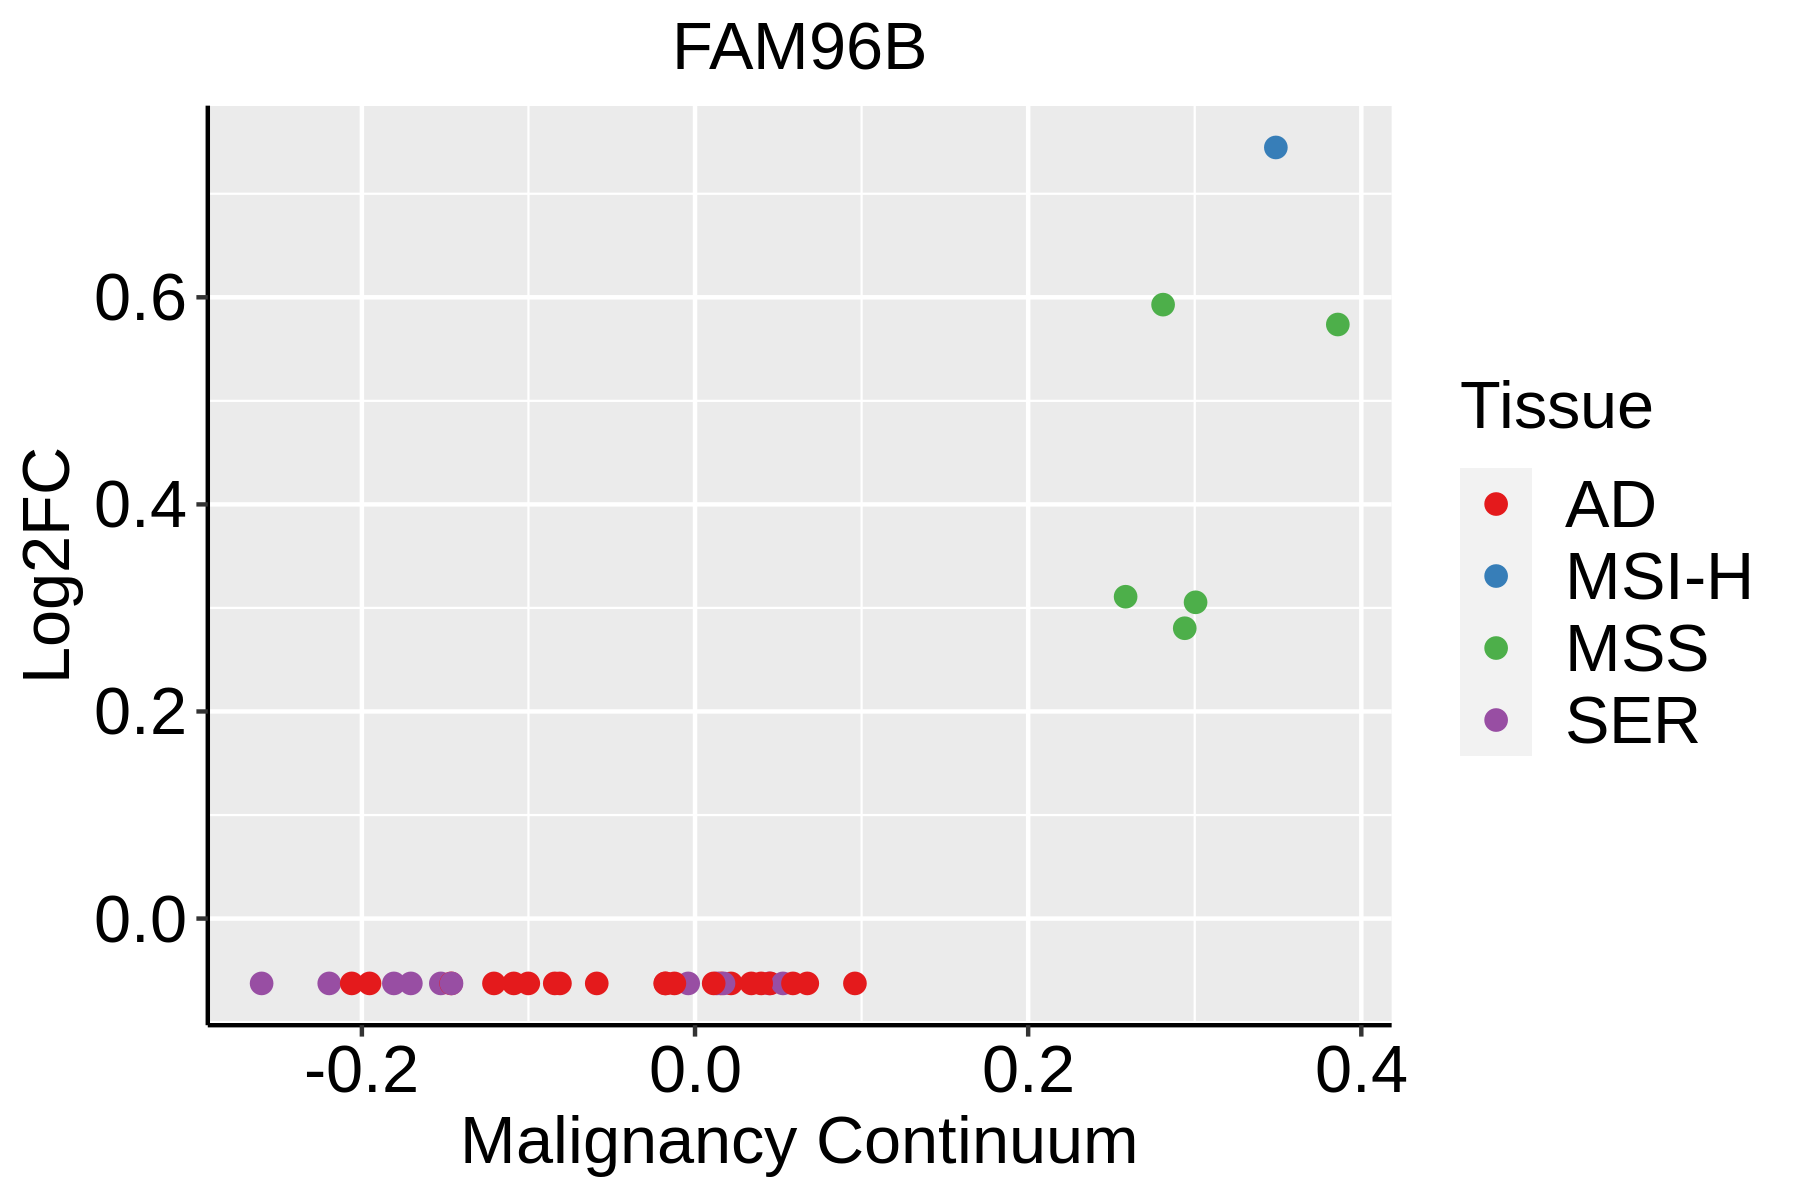 | AD: Adenomas |
| SER: Sessile serrated lesions | ||
| MSI-H: Microsatellite-high colorectal cancer | ||
| MSS: Microsatellite stable colorectal cancer | ||
| Endometrium | 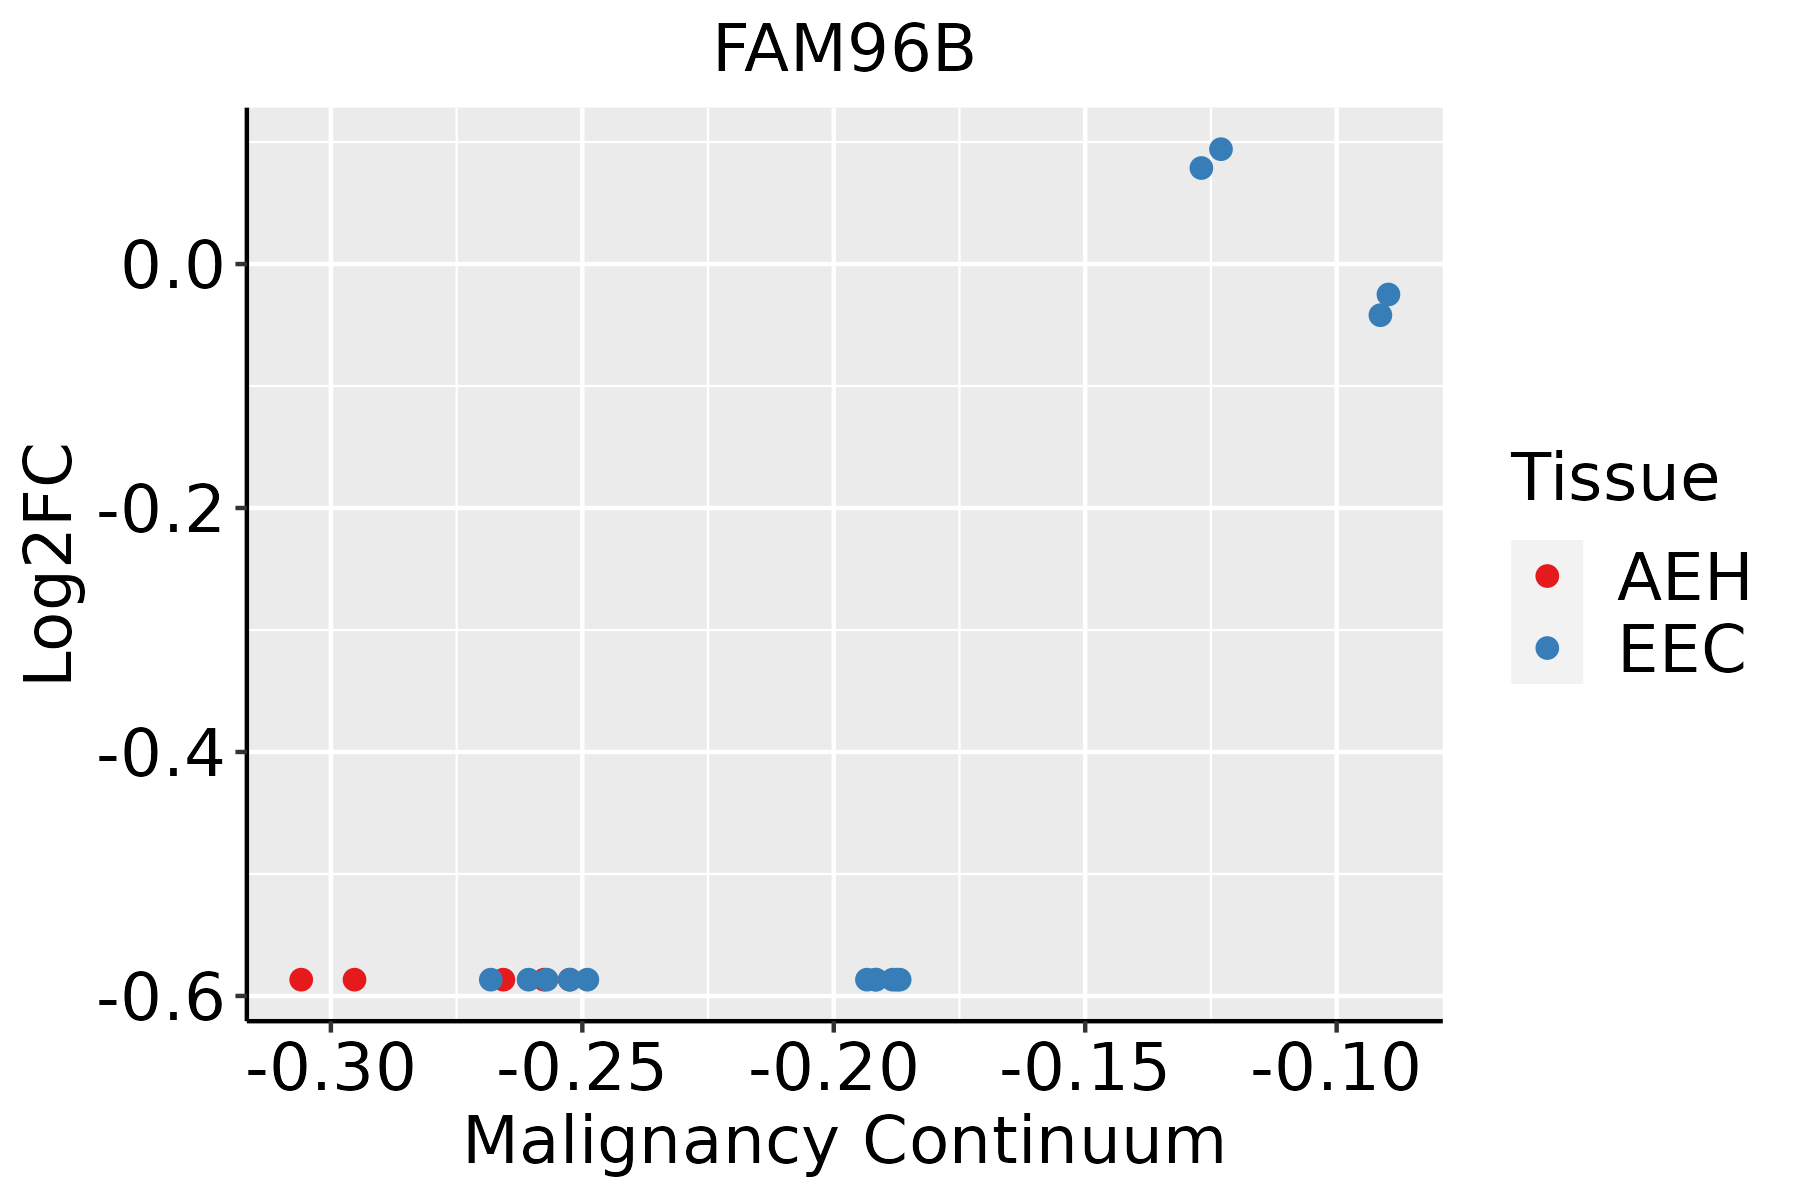 | AEH: Atypical endometrial hyperplasia |
| EEC: Endometrioid Cancer | ||
| Esophagus | 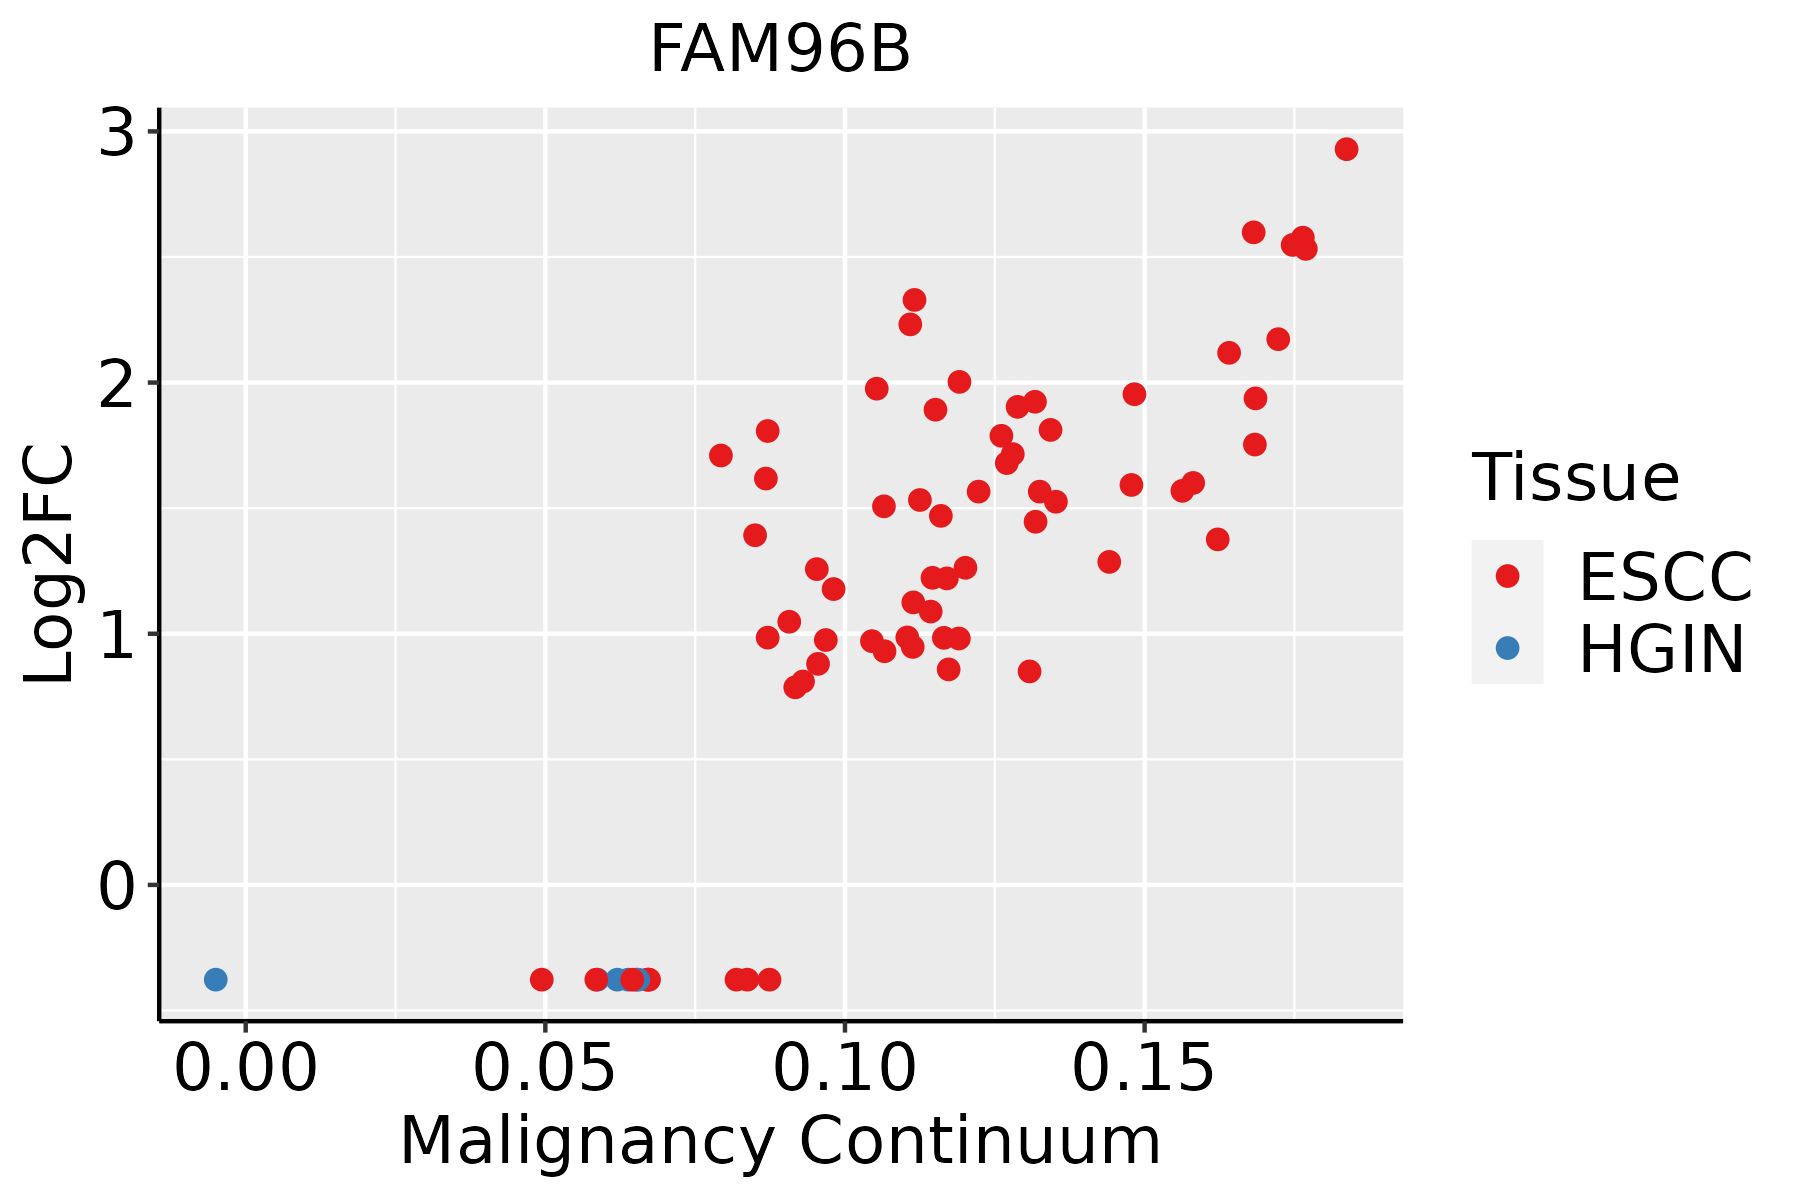 | ESCC: Esophageal squamous cell carcinoma |
| HGIN: High-grade intraepithelial neoplasias | ||
| LGIN: Low-grade intraepithelial neoplasias | ||
| Liver |  | HCC: Hepatocellular carcinoma |
| NAFLD: Non-alcoholic fatty liver disease | ||
| Oral Cavity | 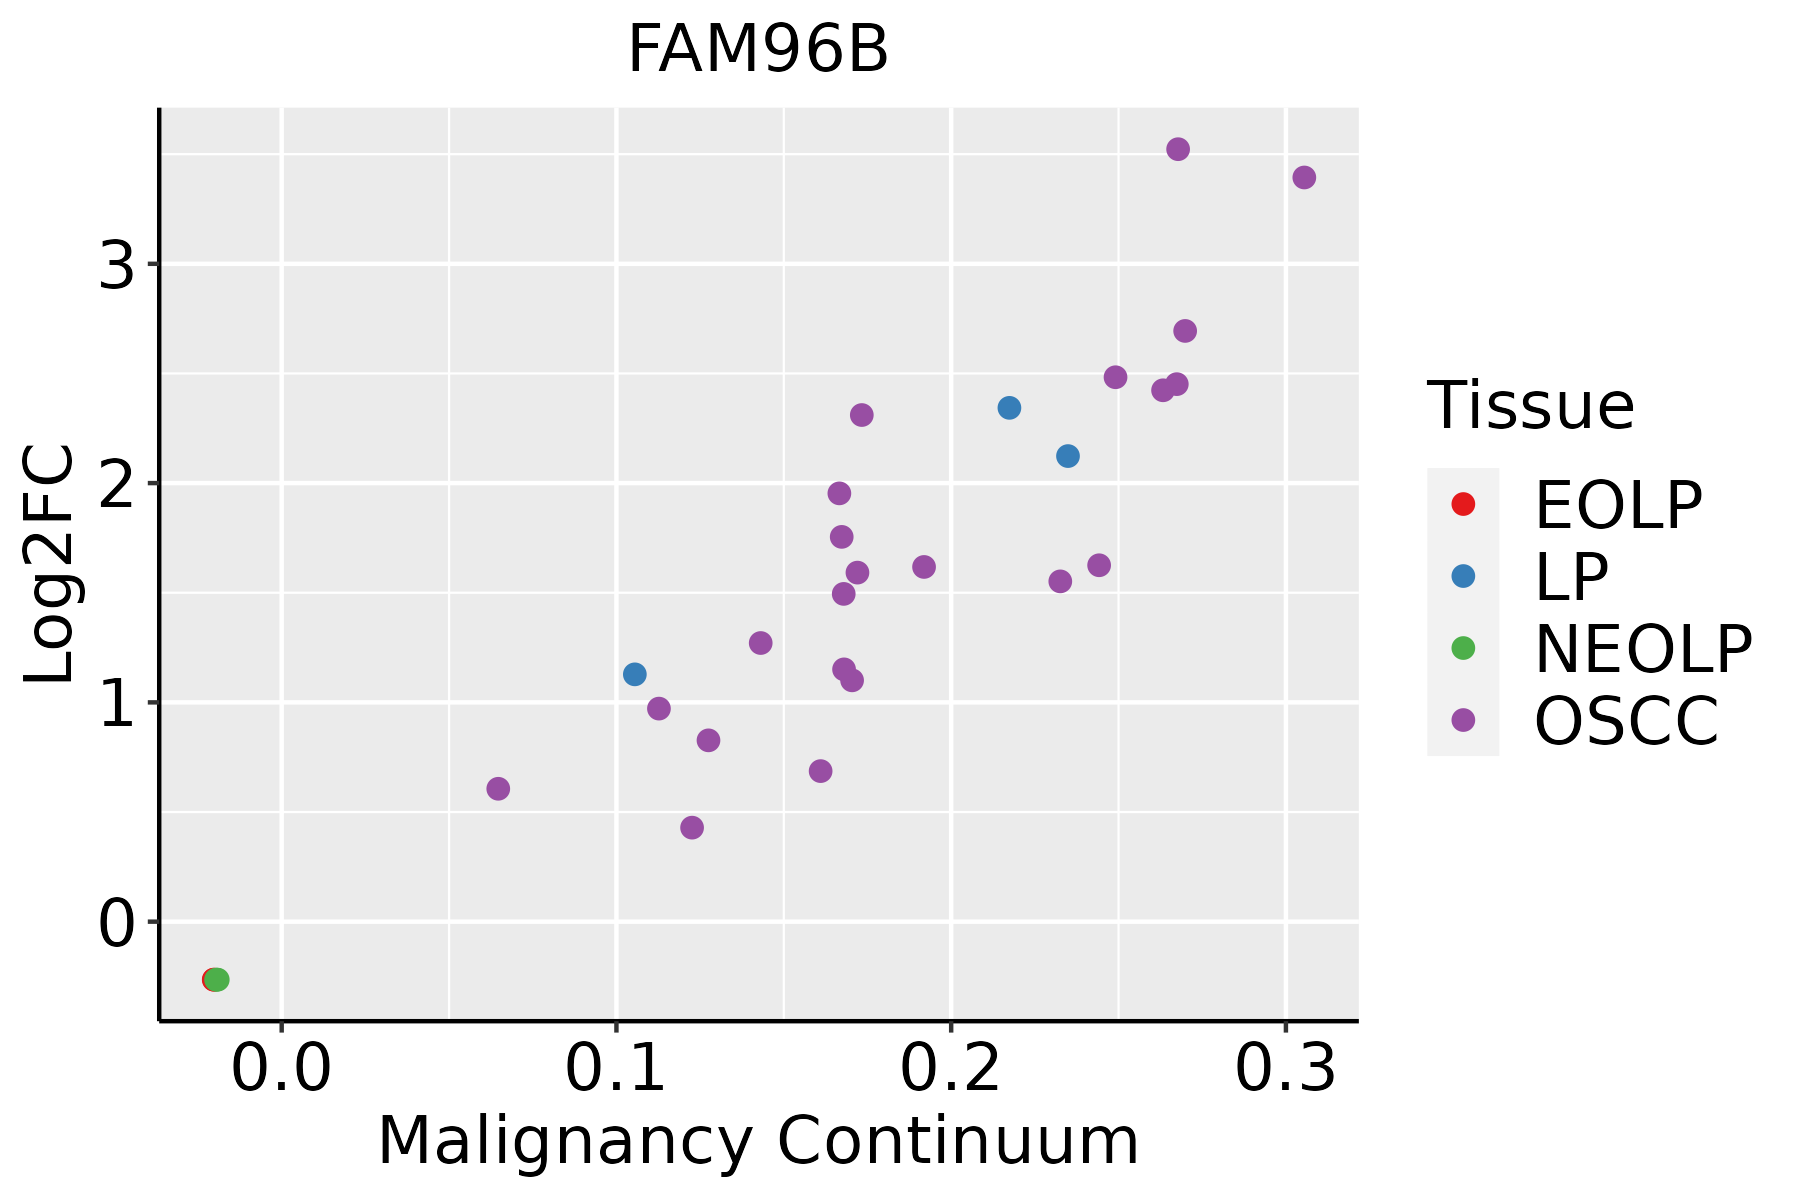 | EOLP: Erosive Oral lichen planus |
| LP: leukoplakia | ||
| NEOLP: Non-erosive oral lichen planus | ||
| OSCC: Oral squamous cell carcinoma | ||
| Prostate |  | BPH: Benign Prostatic Hyperplasia |
| Skin | 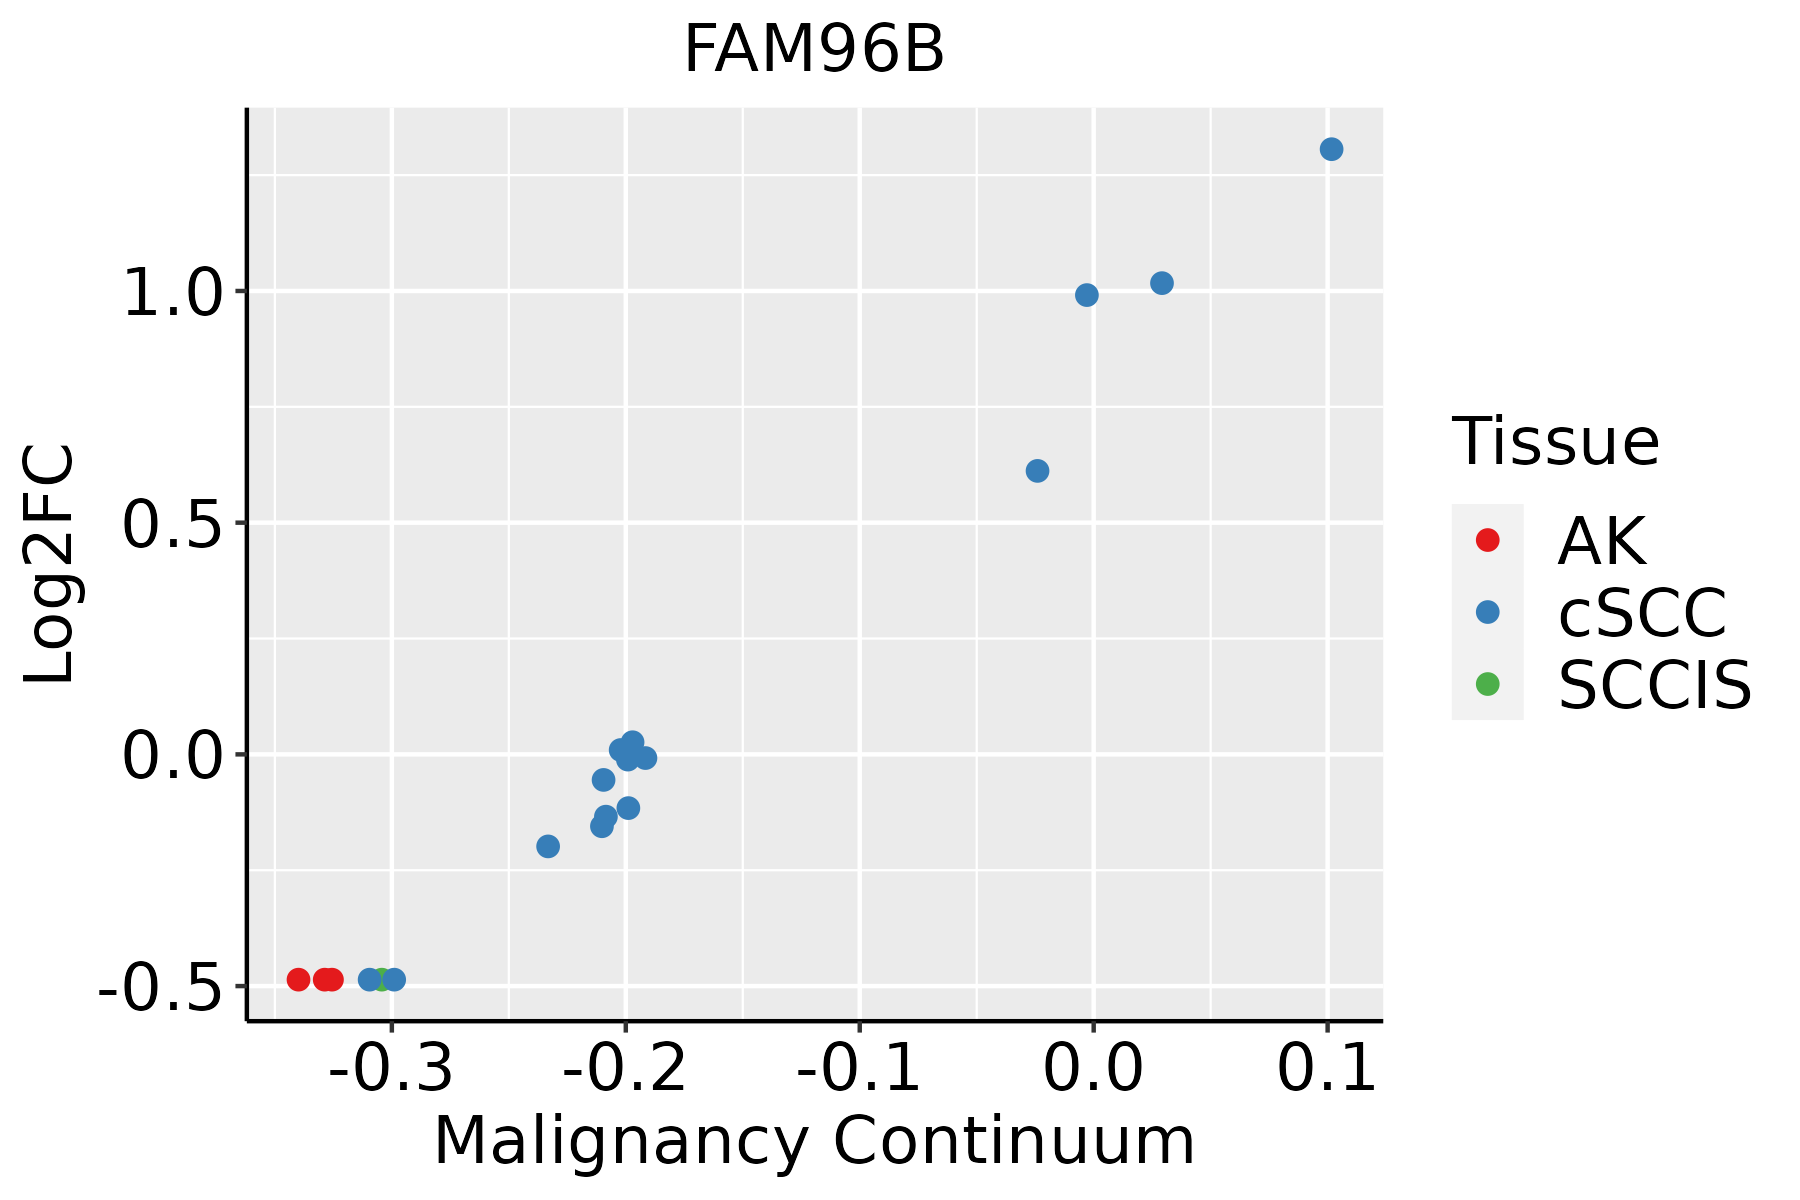 | AK: Actinic keratosis |
| cSCC: Cutaneous squamous cell carcinoma | ||
| SCCIS:squamous cell carcinoma in situ | ||
| Thyroid | 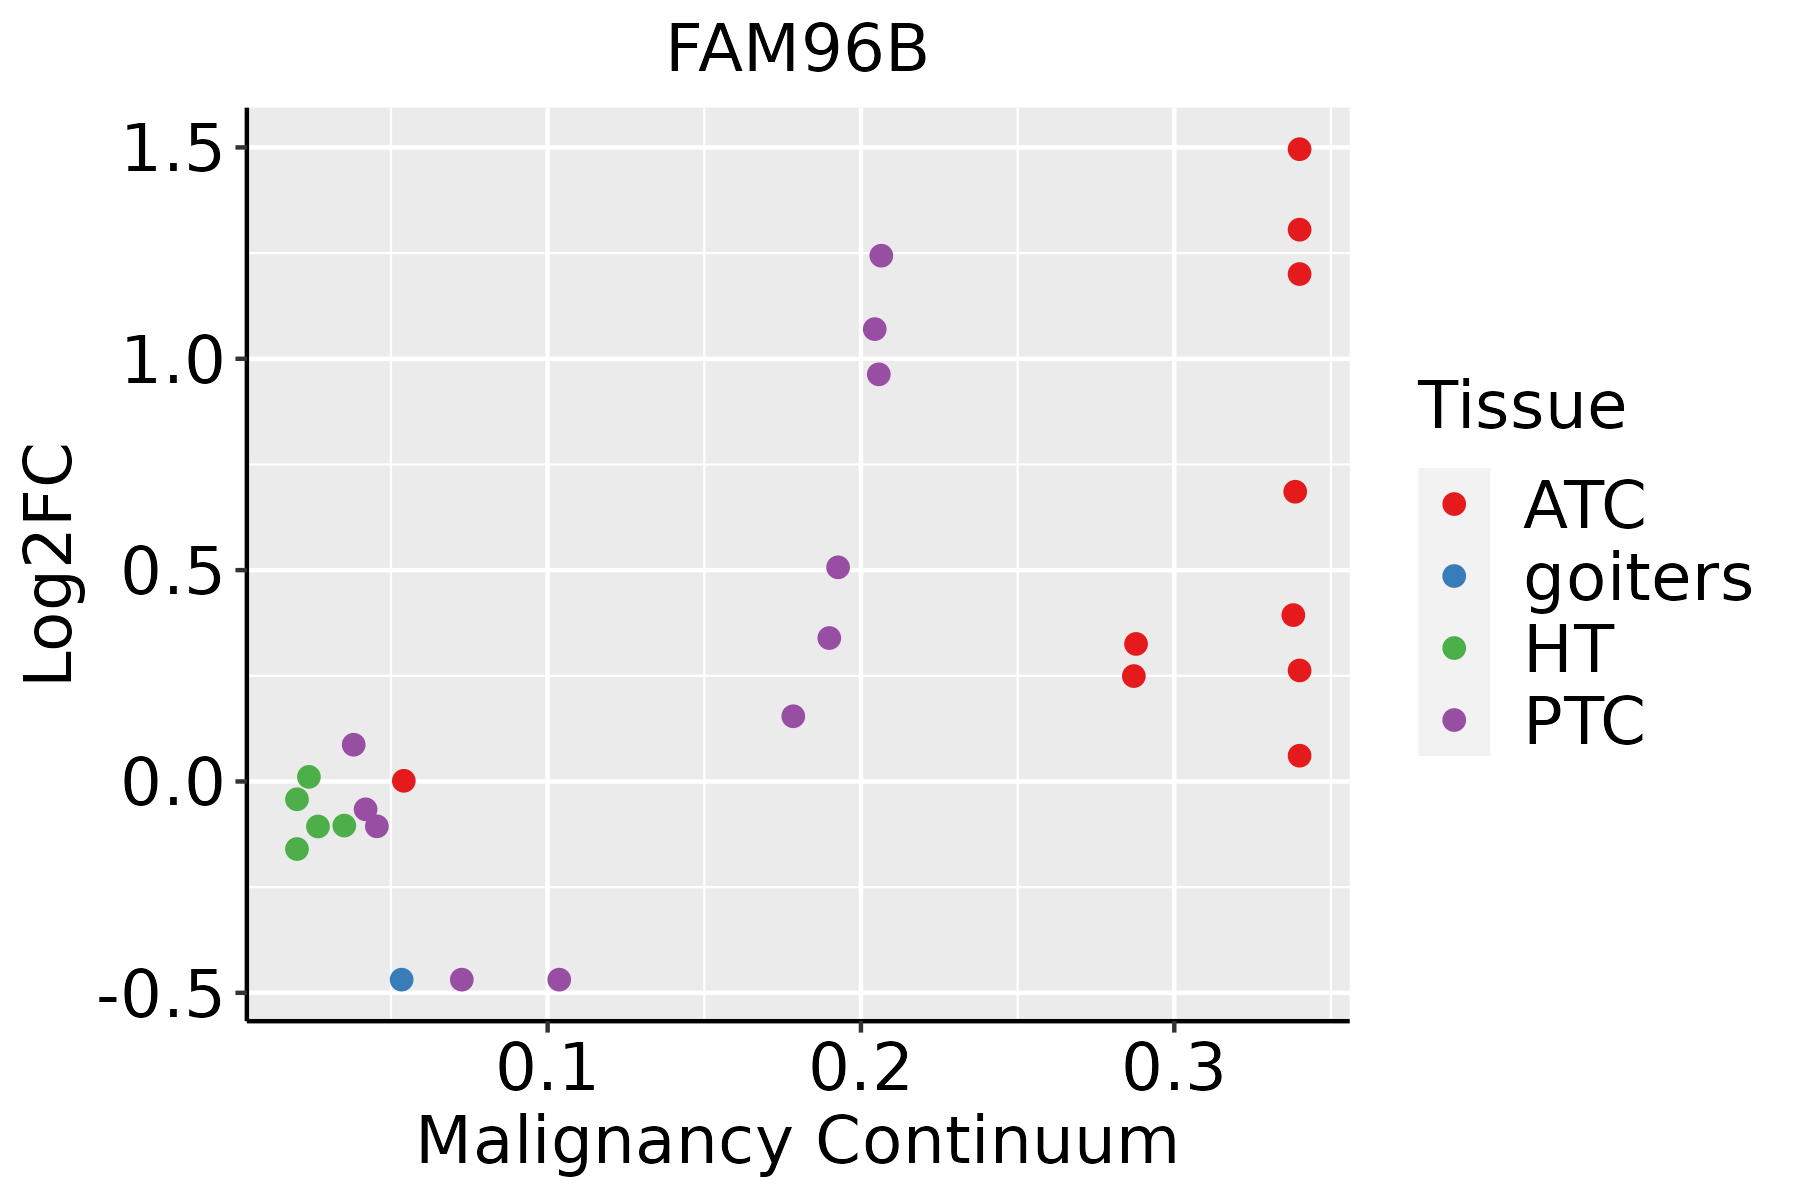 | ATC: Anaplastic thyroid cancer |
| HT: Hashimoto's thyroiditis | ||
| PTC: Papillary thyroid cancer |
| ∗log2FC in expression of this searched gene in stem-like cells from each diseased tissue sample relative to stem-like cells in normal samples in each tissue plotted against the malignancy continuum. Samples are colored based on if they are from different disease stage. |
Top |
Malignant transformation related pathway analysis |
| Find out the enriched GO biological processes and KEGG pathways involved in transition from healthy to precancer to cancer |
| Tissue | Disease Stage | Enriched GO biological Processes |
| Colorectum | AD |  |
| Colorectum | SER |  |
| Colorectum | MSS |  |
| Colorectum | MSI-H |  |
| Colorectum | FAP |  |
| ∗Top 15 enriched GO BP terms are showed in the bar plot of each disease state in each tissue. Each row represents a significant GO biological process which is colored according to the -log10(p.adjust). |
| Page: 1 2 3 4 5 6 7 8 9 |
| GO ID | Tissue | Disease Stage | Description | Gene Ratio | Bg Ratio | pvalue | p.adjust | Count |
| Page: 1 |
| Pathway ID | Tissue | Disease Stage | Description | Gene Ratio | Bg Ratio | pvalue | p.adjust | qvalue | Count |
| Page: 1 |
Top |
Cell-cell communication analysis |
| Identification of potential cell-cell interactions between two cell types and their ligand-receptor pairs for different disease states |
| Ligand | Receptor | LRpair | Pathway | Tissue | Disease Stage |
| Page: 1 |
Top |
Single-cell gene regulatory network inference analysis |
| Find out the significant the regulons (TFs) and the target genes of each regulon across cell types for different disease states |
| TF | Cell Type | Tissue | Disease Stage | Target Gene | RSS | Regulon Activity |
| ∗The dot plots of a searched regulon are shown for all cell subpopulations in each disease state of each tissue based on the regulon specific score inferred using pySCENIC and by calculating the average expression. |
| Page: 1 |
Top |
Somatic mutation of malignant transformation related genes |
| Annotation of somatic variants for genes involved in malignant transformation |
| Hugo Symbol | Variant Class | Variant Classification | dbSNP RS | HGVSc | HGVSp | HGVSp Short | SWISSPROT | BIOTYPE | SIFT | PolyPhen | Tumor Sample Barcode | Tissue | Histology | Sex | Age | Stage | Therapy Types | Drugs | Outcome |
| FAM96B | SNV | Missense_Mutation | c.484C>T | p.Arg162Cys | p.R162C | Q9Y3D0 | protein_coding | tolerated_low_confidence(0.1) | benign(0.01) | TCGA-D8-A13Z-01 | Breast | breast invasive carcinoma | Female | <65 | I/II | Chemotherapy | doxorubicine | SD | |
| FAM96B | insertion | Frame_Shift_Ins | novel | c.167_168insATTAGCAGAGAGGAAACTG | p.Glu57LeufsTer26 | p.E57Lfs*26 | Q9Y3D0 | protein_coding | TCGA-AN-A0FX-01 | Breast | breast invasive carcinoma | Female | <65 | I/II | Unknown | Unknown | SD | ||
| FAM96B | SNV | Missense_Mutation | c.484N>T | p.Arg162Cys | p.R162C | Q9Y3D0 | protein_coding | tolerated_low_confidence(0.1) | benign(0.01) | TCGA-EK-A2RN-01 | Cervix | cervical & endocervical cancer | Female | <65 | I/II | Unknown | Unknown | SD | |
| FAM96B | SNV | Missense_Mutation | novel | c.171N>T | p.Glu57Asp | p.E57D | Q9Y3D0 | protein_coding | deleterious(0) | probably_damaging(1) | TCGA-AA-A010-01 | Colorectum | colon adenocarcinoma | Female | <65 | I/II | Chemotherapy | folinic | CR |
| FAM96B | SNV | Missense_Mutation | novel | c.70N>T | p.Gly24Trp | p.G24W | Q9Y3D0 | protein_coding | deleterious(0.01) | possibly_damaging(0.765) | TCGA-44-7661-01 | Lung | lung adenocarcinoma | Female | >=65 | I/II | Unknown | Unknown | PD |
| FAM96B | SNV | Missense_Mutation | novel | c.157N>T | p.Ile53Phe | p.I53F | Q9Y3D0 | protein_coding | deleterious(0) | probably_damaging(0.987) | TCGA-MP-A4T9-01 | Lung | lung adenocarcinoma | Female | <65 | III/IV | Chemotherapy | vinorelbine | PD |
| FAM96B | SNV | Missense_Mutation | c.144N>A | p.Asp48Glu | p.D48E | Q9Y3D0 | protein_coding | tolerated(0.22) | possibly_damaging(0.498) | TCGA-J4-A67Q-01 | Prostate | prostate adenocarcinoma | Male | >=65 | 6 | Unknown | Unknown | SD |
| Page: 1 |
Top |
Related drugs of malignant transformation related genes |
| Identification of chemicals and drugs interact with genes involved in malignant transfromation |
| (DGIdb 4.0) |
| Entrez ID | Symbol | Category | Interaction Types | Drug Claim Name | Drug Name | PMIDs |
| Page: 1 |

Copyright 2023-Present -The University of Texas Health Science Center at Houston |