
|
|||||
|
 | |
| |
| |
| |
| |
| |
|
Gene: FAM86C1 |
Gene summary for FAM86C1 |
| Gene information | Species | Human | Gene symbol | FAM86C1 | Gene ID | 55199 |
| Gene name | family with sequence similarity 86 member C1, pseudogene | |
| Gene Alias | FAM86C | |
| Cytomap | 11q13.4 | |
| Gene Type | unknown | GO ID | GO:0006464 | UniProtAcc | NA |
Top |
Malignant transformation analysis |
| Identification of the aberrant gene expression in precancerous and cancerous lesions by comparing the gene expression of stem-like cells in diseased tissues with normal stem cells |
| Entrez ID | Symbol | Replicates | Species | Organ | Tissue | Adj P-value | Log2FC | Malignancy |
| 55199 | FAM86C1 | LZE4T | Human | Esophagus | ESCC | 2.18e-06 | 2.03e-01 | 0.0811 |
| 55199 | FAM86C1 | LZE22T | Human | Esophagus | ESCC | 1.54e-04 | 4.15e-01 | 0.068 |
| 55199 | FAM86C1 | P2T-E | Human | Esophagus | ESCC | 5.00e-17 | 3.36e-01 | 0.1177 |
| 55199 | FAM86C1 | P4T-E | Human | Esophagus | ESCC | 4.27e-09 | 2.22e-01 | 0.1323 |
| 55199 | FAM86C1 | P9T-E | Human | Esophagus | ESCC | 8.38e-03 | 1.15e-01 | 0.1131 |
| 55199 | FAM86C1 | P11T-E | Human | Esophagus | ESCC | 4.74e-03 | 1.62e-01 | 0.1426 |
| 55199 | FAM86C1 | P12T-E | Human | Esophagus | ESCC | 3.97e-04 | 1.50e-01 | 0.1122 |
| 55199 | FAM86C1 | P16T-E | Human | Esophagus | ESCC | 4.40e-09 | 1.94e-01 | 0.1153 |
| 55199 | FAM86C1 | P17T-E | Human | Esophagus | ESCC | 2.14e-09 | 3.29e-01 | 0.1278 |
| 55199 | FAM86C1 | P20T-E | Human | Esophagus | ESCC | 3.34e-15 | 3.25e-01 | 0.1124 |
| 55199 | FAM86C1 | P21T-E | Human | Esophagus | ESCC | 9.56e-08 | 1.97e-01 | 0.1617 |
| 55199 | FAM86C1 | P22T-E | Human | Esophagus | ESCC | 3.97e-04 | 1.19e-01 | 0.1236 |
| 55199 | FAM86C1 | P23T-E | Human | Esophagus | ESCC | 6.42e-33 | 7.04e-01 | 0.108 |
| 55199 | FAM86C1 | P24T-E | Human | Esophagus | ESCC | 1.88e-04 | 1.06e-01 | 0.1287 |
| 55199 | FAM86C1 | P28T-E | Human | Esophagus | ESCC | 6.62e-20 | 3.78e-01 | 0.1149 |
| 55199 | FAM86C1 | P30T-E | Human | Esophagus | ESCC | 1.02e-02 | 1.75e-01 | 0.137 |
| 55199 | FAM86C1 | P31T-E | Human | Esophagus | ESCC | 9.44e-07 | 1.48e-01 | 0.1251 |
| 55199 | FAM86C1 | P32T-E | Human | Esophagus | ESCC | 2.27e-21 | 3.75e-01 | 0.1666 |
| 55199 | FAM86C1 | P36T-E | Human | Esophagus | ESCC | 1.55e-04 | 1.79e-01 | 0.1187 |
| 55199 | FAM86C1 | P37T-E | Human | Esophagus | ESCC | 1.14e-34 | 6.98e-01 | 0.1371 |
| Page: 1 2 3 |
| Tissue | Expression Dynamics | Abbreviation |
| Esophagus | 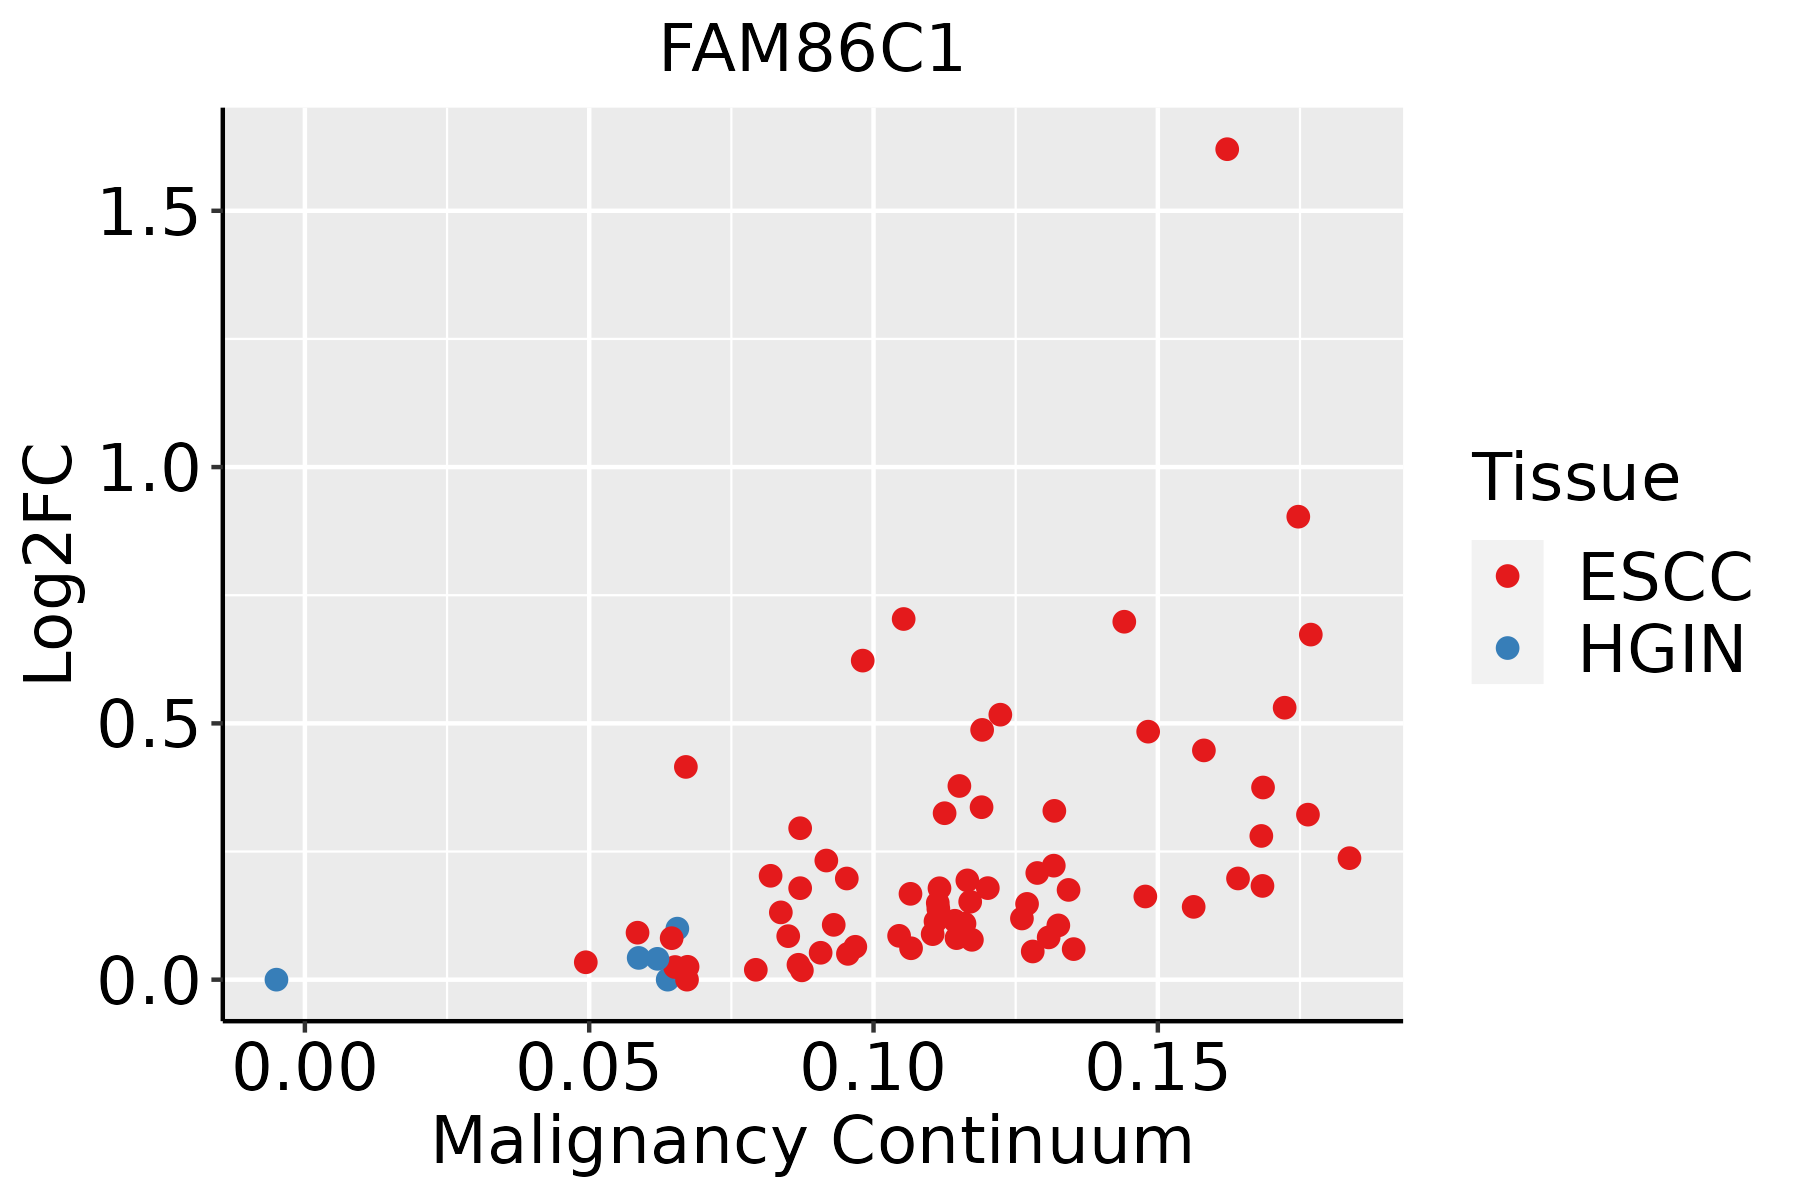 | ESCC: Esophageal squamous cell carcinoma |
| HGIN: High-grade intraepithelial neoplasias | ||
| LGIN: Low-grade intraepithelial neoplasias | ||
| Liver | 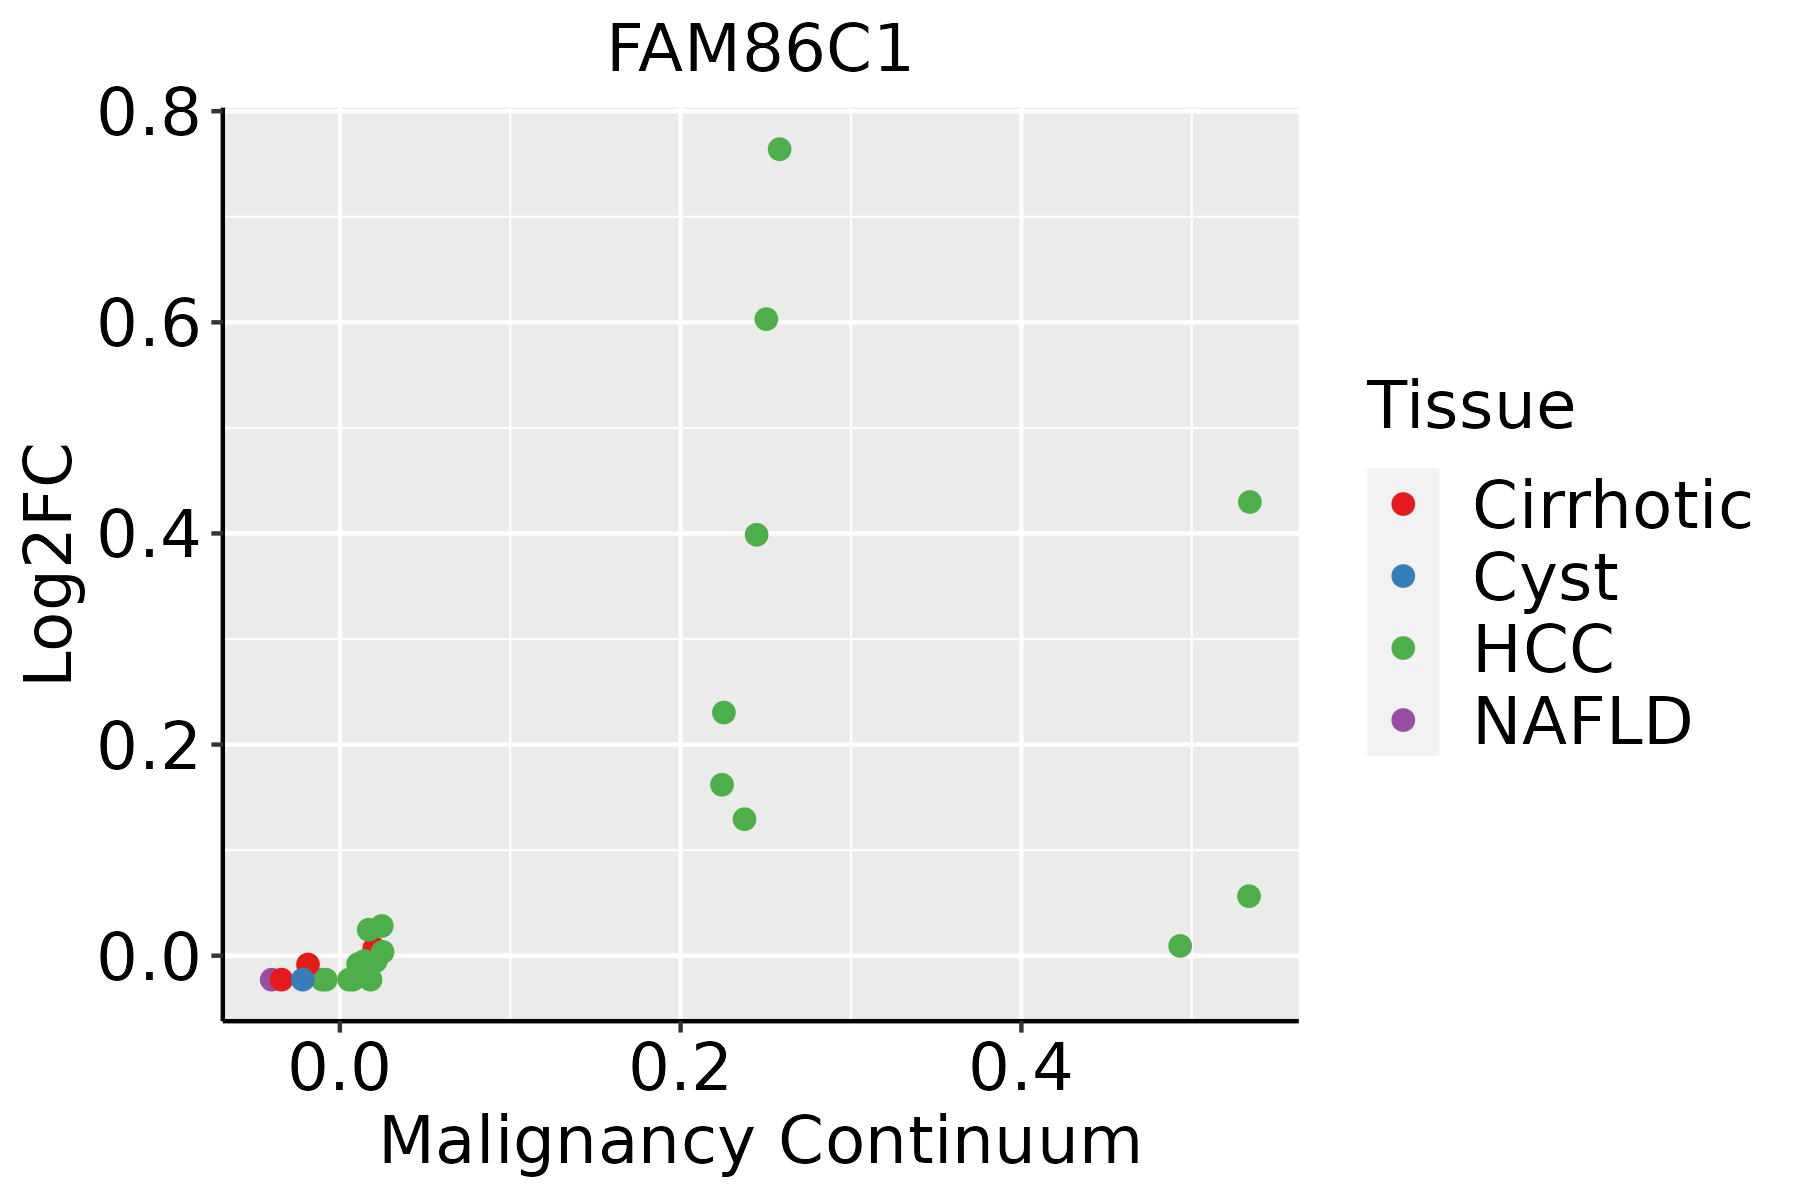 | HCC: Hepatocellular carcinoma |
| NAFLD: Non-alcoholic fatty liver disease | ||
| Oral Cavity | 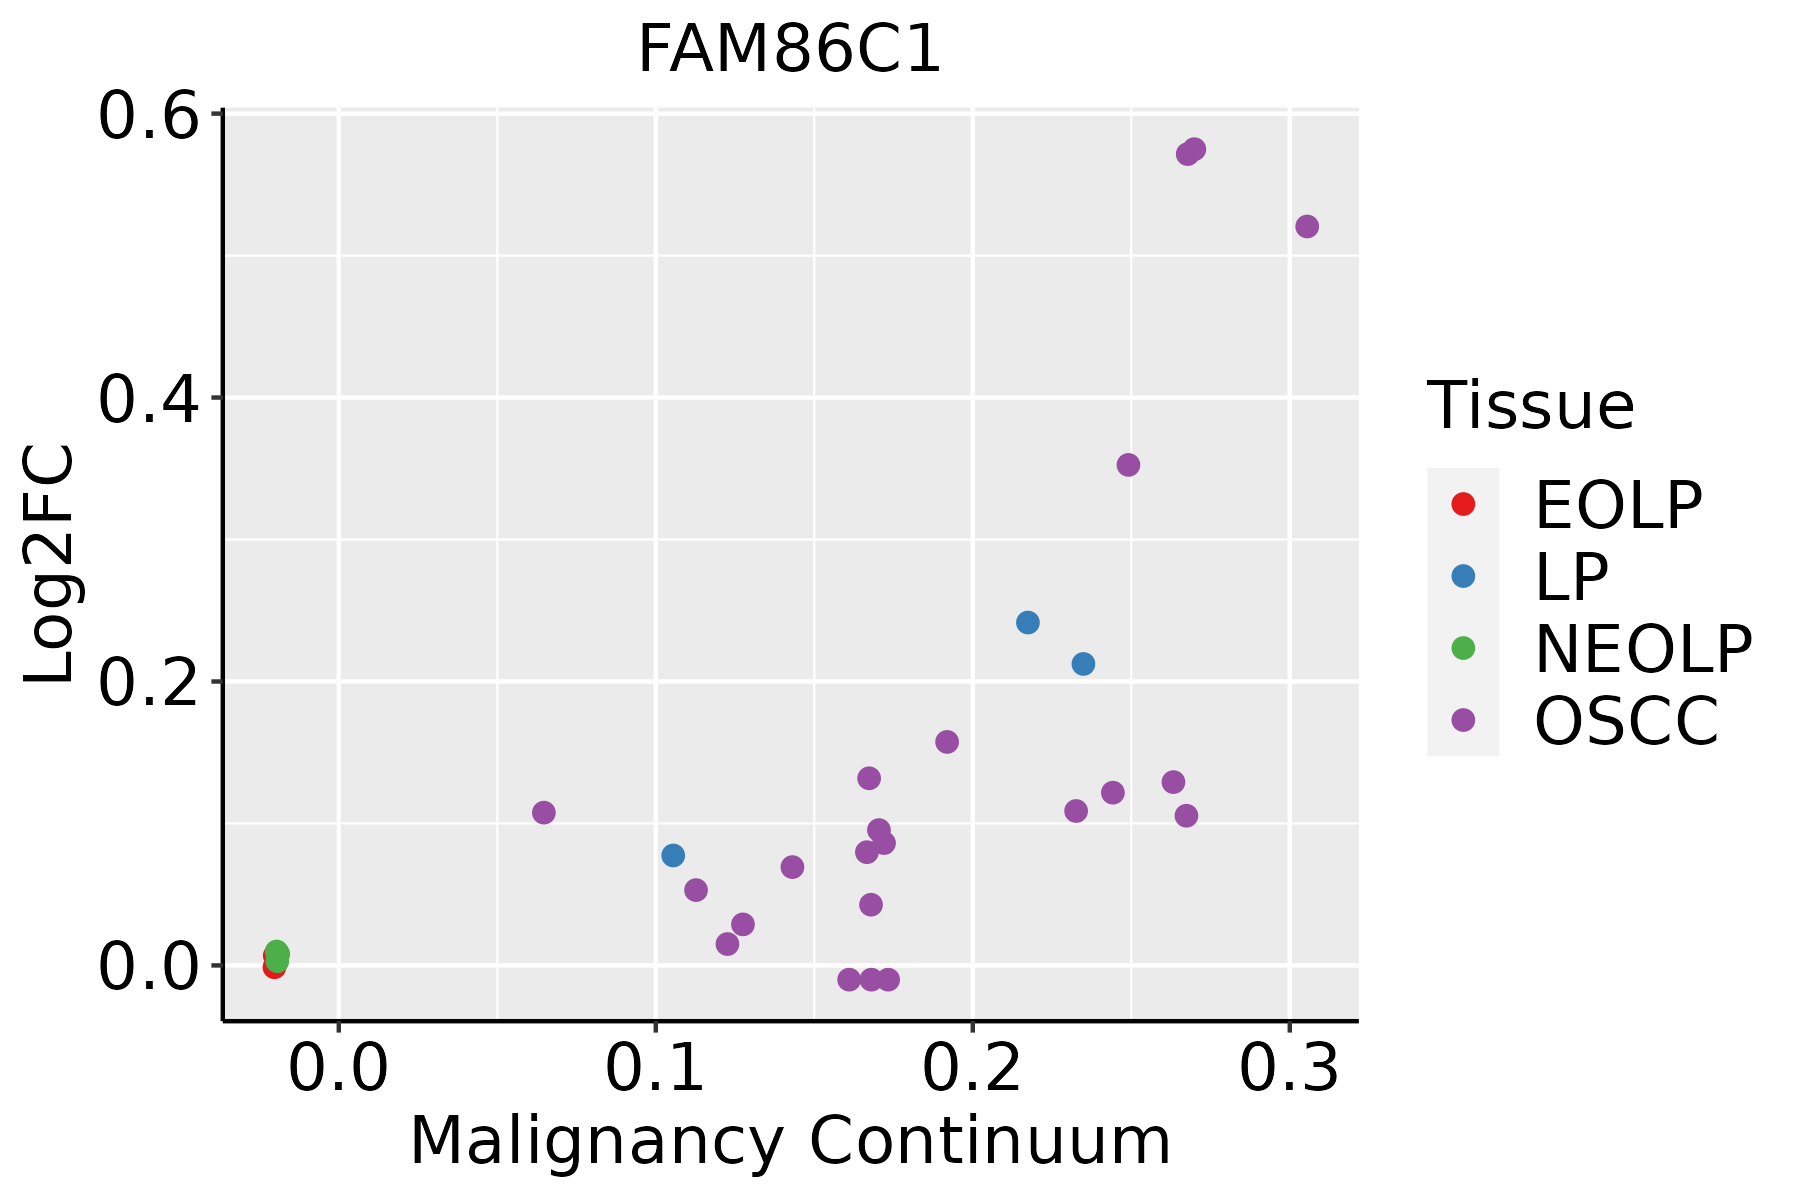 | EOLP: Erosive Oral lichen planus |
| LP: leukoplakia | ||
| NEOLP: Non-erosive oral lichen planus | ||
| OSCC: Oral squamous cell carcinoma |
| ∗log2FC in expression of this searched gene in stem-like cells from each diseased tissue sample relative to stem-like cells in normal samples in each tissue plotted against the malignancy continuum. Samples are colored based on if they are from different disease stage. |
Top |
Malignant transformation related pathway analysis |
| Find out the enriched GO biological processes and KEGG pathways involved in transition from healthy to precancer to cancer |
| Tissue | Disease Stage | Enriched GO biological Processes |
| Colorectum | AD |  |
| Colorectum | SER |  |
| Colorectum | MSS |  |
| Colorectum | MSI-H |  |
| Colorectum | FAP |  |
| ∗Top 15 enriched GO BP terms are showed in the bar plot of each disease state in each tissue. Each row represents a significant GO biological process which is colored according to the -log10(p.adjust). |
| Page: 1 2 3 4 5 6 7 8 9 |
| GO ID | Tissue | Disease Stage | Description | Gene Ratio | Bg Ratio | pvalue | p.adjust | Count |
| Page: 1 |
| Pathway ID | Tissue | Disease Stage | Description | Gene Ratio | Bg Ratio | pvalue | p.adjust | qvalue | Count |
| Page: 1 |
Top |
Cell-cell communication analysis |
| Identification of potential cell-cell interactions between two cell types and their ligand-receptor pairs for different disease states |
| Ligand | Receptor | LRpair | Pathway | Tissue | Disease Stage |
| Page: 1 |
Top |
Single-cell gene regulatory network inference analysis |
| Find out the significant the regulons (TFs) and the target genes of each regulon across cell types for different disease states |
| TF | Cell Type | Tissue | Disease Stage | Target Gene | RSS | Regulon Activity |
| ∗The dot plots of a searched regulon are shown for all cell subpopulations in each disease state of each tissue based on the regulon specific score inferred using pySCENIC and by calculating the average expression. |
| Page: 1 |
Top |
Somatic mutation of malignant transformation related genes |
| Annotation of somatic variants for genes involved in malignant transformation |
| Hugo Symbol | Variant Class | Variant Classification | dbSNP RS | HGVSc | HGVSp | HGVSp Short | SWISSPROT | BIOTYPE | SIFT | PolyPhen | Tumor Sample Barcode | Tissue | Histology | Sex | Age | Stage | Therapy Types | Drugs | Outcome |
| FAM86C1 | SNV | Missense_Mutation | rs758817897 | c.163N>A | p.Glu55Lys | p.E55K | Q9NVL1 | protein_coding | deleterious(0.02) | probably_damaging(0.935) | TCGA-LP-A4AW-01 | Cervix | cervical & endocervical cancer | Female | <65 | I/II | Unknown | Unknown | SD |
| FAM86C1 | SNV | Missense_Mutation | novel | c.484N>G | p.Arg162Gly | p.R162G | Q9NVL1 | protein_coding | deleterious_low_confidence(0) | benign(0.017) | TCGA-CA-6717-01 | Colorectum | colon adenocarcinoma | Male | <65 | I/II | Chemotherapy | oxaliplatin | CR |
| FAM86C1 | SNV | Missense_Mutation | rs149410612 | c.361C>T | p.Pro121Ser | p.P121S | Q9NVL1 | protein_coding | tolerated_low_confidence(0.18) | benign(0.003) | TCGA-CK-4951-01 | Colorectum | colon adenocarcinoma | Female | >=65 | I/II | Unknown | Unknown | PD |
| FAM86C1 | SNV | Missense_Mutation | c.338G>C | p.Ser113Thr | p.S113T | Q9NVL1 | protein_coding | tolerated(0.37) | benign(0.08) | TCGA-AG-3742-01 | Colorectum | rectum adenocarcinoma | Female | >=65 | I/II | Unknown | Unknown | SD | |
| FAM86C1 | insertion | Frame_Shift_Ins | novel | c.252_253insGGTA | p.Tyr85GlyfsTer88 | p.Y85Gfs*88 | Q9NVL1 | protein_coding | TCGA-AG-A014-01 | Colorectum | rectum adenocarcinoma | Male | >=65 | I/II | Unknown | Unknown | SD | ||
| FAM86C1 | SNV | Missense_Mutation | rs771403018 | c.299N>T | p.Ser100Leu | p.S100L | Q9NVL1 | protein_coding | tolerated(0.3) | benign(0) | TCGA-AJ-A3EK-01 | Endometrium | uterine corpus endometrioid carcinoma | Female | <65 | I/II | Chemotherapy | carboplatin | CR |
| FAM86C1 | SNV | Missense_Mutation | c.159G>T | p.Lys53Asn | p.K53N | Q9NVL1 | protein_coding | tolerated(0.06) | probably_damaging(0.969) | TCGA-B5-A0JY-01 | Endometrium | uterine corpus endometrioid carcinoma | Female | <65 | III/IV | Chemotherapy | doxorubicin | SD | |
| FAM86C1 | SNV | Missense_Mutation | novel | c.463N>C | p.Phe155Leu | p.F155L | Q9NVL1 | protein_coding | tolerated_low_confidence(0.07) | benign(0.059) | TCGA-DF-A2KN-01 | Endometrium | uterine corpus endometrioid carcinoma | Female | Unknown | I/II | Unknown | Unknown | SD |
| FAM86C1 | SNV | Missense_Mutation | novel | c.166G>A | p.Ala56Thr | p.A56T | Q9NVL1 | protein_coding | deleterious(0.01) | probably_damaging(0.982) | TCGA-FI-A2D5-01 | Endometrium | uterine corpus endometrioid carcinoma | Female | <65 | III/IV | Chemotherapy | carboplatinum | PD |
| FAM86C1 | SNV | Missense_Mutation | c.149N>C | p.Ile50Thr | p.I50T | Q9NVL1 | protein_coding | deleterious(0) | probably_damaging(0.958) | TCGA-66-2778-01 | Lung | lung squamous cell carcinoma | Female | >=65 | III/IV | Chemotherapy | cisplatin | CR |
| Page: 1 2 |
Top |
Related drugs of malignant transformation related genes |
| Identification of chemicals and drugs interact with genes involved in malignant transfromation |
| (DGIdb 4.0) |
| Entrez ID | Symbol | Category | Interaction Types | Drug Claim Name | Drug Name | PMIDs |
| Page: 1 |

Copyright 2023-Present -The University of Texas Health Science Center at Houston |