
|
|||||
|
 | |
| |
| |
| |
| |
| |
|
Gene: FAM84B |
Gene summary for FAM84B |
| Gene information | Species | Human | Gene symbol | FAM84B | Gene ID | 157638 |
| Gene name | LRAT domain containing 2 | |
| Gene Alias | BCMP101 | |
| Cytomap | 8q24.21 | |
| Gene Type | protein-coding | GO ID | GO:0005575 | UniProtAcc | Q96KN1 |
Top |
Malignant transformation analysis |
| Identification of the aberrant gene expression in precancerous and cancerous lesions by comparing the gene expression of stem-like cells in diseased tissues with normal stem cells |
| Entrez ID | Symbol | Replicates | Species | Organ | Tissue | Adj P-value | Log2FC | Malignancy |
| 157638 | FAM84B | GSM4909281 | Human | Breast | IDC | 4.12e-07 | 3.31e-01 | 0.21 |
| 157638 | FAM84B | GSM4909285 | Human | Breast | IDC | 3.13e-02 | 1.41e-01 | 0.21 |
| 157638 | FAM84B | GSM4909286 | Human | Breast | IDC | 9.92e-03 | -1.89e-01 | 0.1081 |
| 157638 | FAM84B | GSM4909290 | Human | Breast | IDC | 3.14e-23 | 7.65e-01 | 0.2096 |
| 157638 | FAM84B | GSM4909291 | Human | Breast | IDC | 1.38e-14 | 6.24e-01 | 0.1753 |
| 157638 | FAM84B | GSM4909296 | Human | Breast | IDC | 1.36e-03 | -1.54e-01 | 0.1524 |
| 157638 | FAM84B | GSM4909298 | Human | Breast | IDC | 1.47e-07 | 2.95e-01 | 0.1551 |
| 157638 | FAM84B | GSM4909304 | Human | Breast | IDC | 4.41e-07 | 2.77e-01 | 0.1636 |
| 157638 | FAM84B | GSM4909311 | Human | Breast | IDC | 2.39e-07 | -6.28e-02 | 0.1534 |
| 157638 | FAM84B | GSM4909312 | Human | Breast | IDC | 3.00e-06 | 1.88e-01 | 0.1552 |
| 157638 | FAM84B | GSM4909316 | Human | Breast | IDC | 3.23e-02 | -7.79e-02 | 0.21 |
| 157638 | FAM84B | GSM4909319 | Human | Breast | IDC | 9.82e-10 | -1.32e-01 | 0.1563 |
| 157638 | FAM84B | GSM4909321 | Human | Breast | IDC | 7.25e-03 | -3.92e-02 | 0.1559 |
| 157638 | FAM84B | brca10 | Human | Breast | Precancer | 8.58e-04 | -1.85e-01 | -0.0029 |
| 157638 | FAM84B | NCCBC14 | Human | Breast | DCIS | 6.32e-03 | 2.05e-02 | 0.2021 |
| 157638 | FAM84B | NCCBC5 | Human | Breast | DCIS | 1.24e-05 | 2.60e-01 | 0.2046 |
| 157638 | FAM84B | P1 | Human | Breast | IDC | 1.31e-05 | -6.54e-02 | 0.1527 |
| 157638 | FAM84B | DCIS2 | Human | Breast | DCIS | 4.28e-54 | 4.50e-01 | 0.0085 |
| 157638 | FAM84B | P1T-E | Human | Esophagus | ESCC | 6.76e-04 | 4.34e-01 | 0.0875 |
| 157638 | FAM84B | P2T-E | Human | Esophagus | ESCC | 1.46e-12 | 2.29e-01 | 0.1177 |
| Page: 1 2 3 4 5 |
| Tissue | Expression Dynamics | Abbreviation |
| Breast | 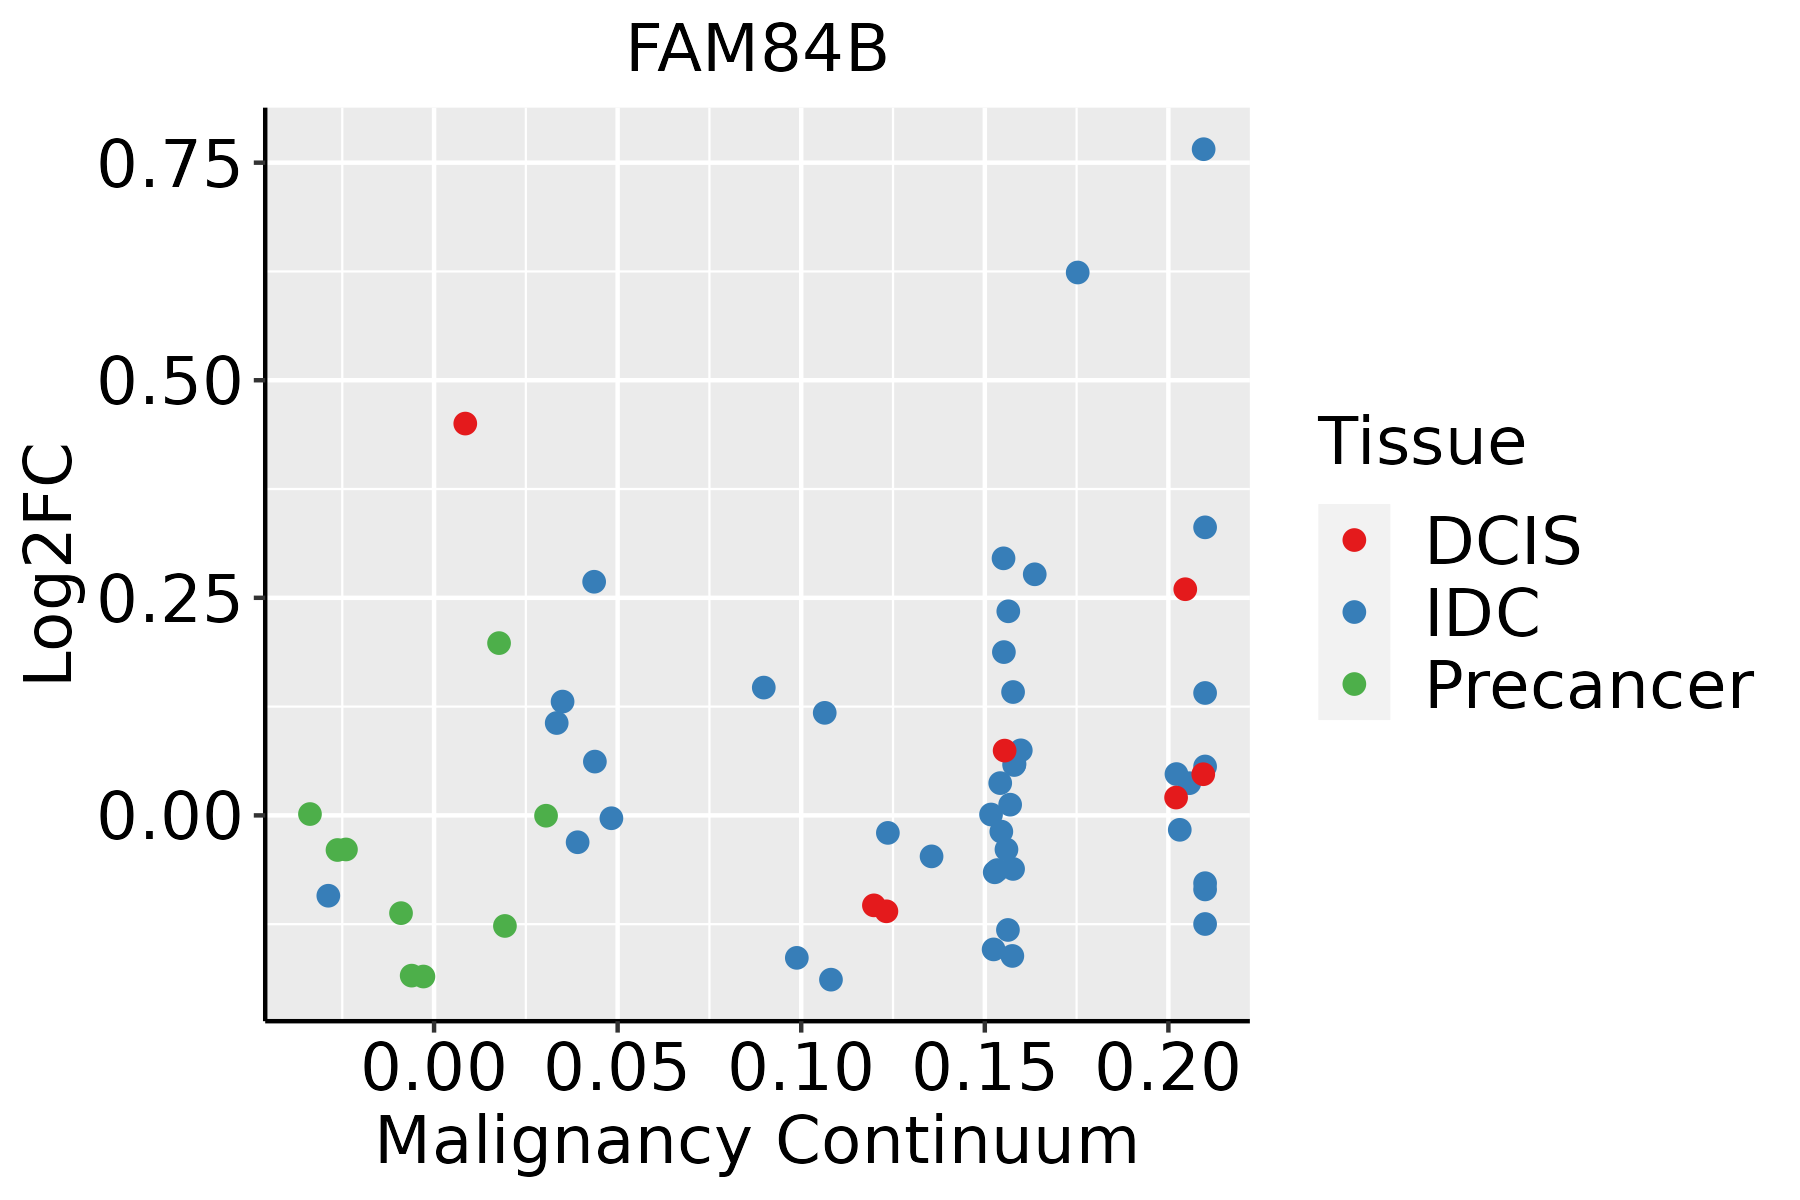 | IDC: Invasive ductal carcinoma |
| DCIS: Ductal carcinoma in situ | ||
| Precancer(BRCA1-mut): Precancerous lesion from BRCA1 mutation carriers | ||
| Esophagus | 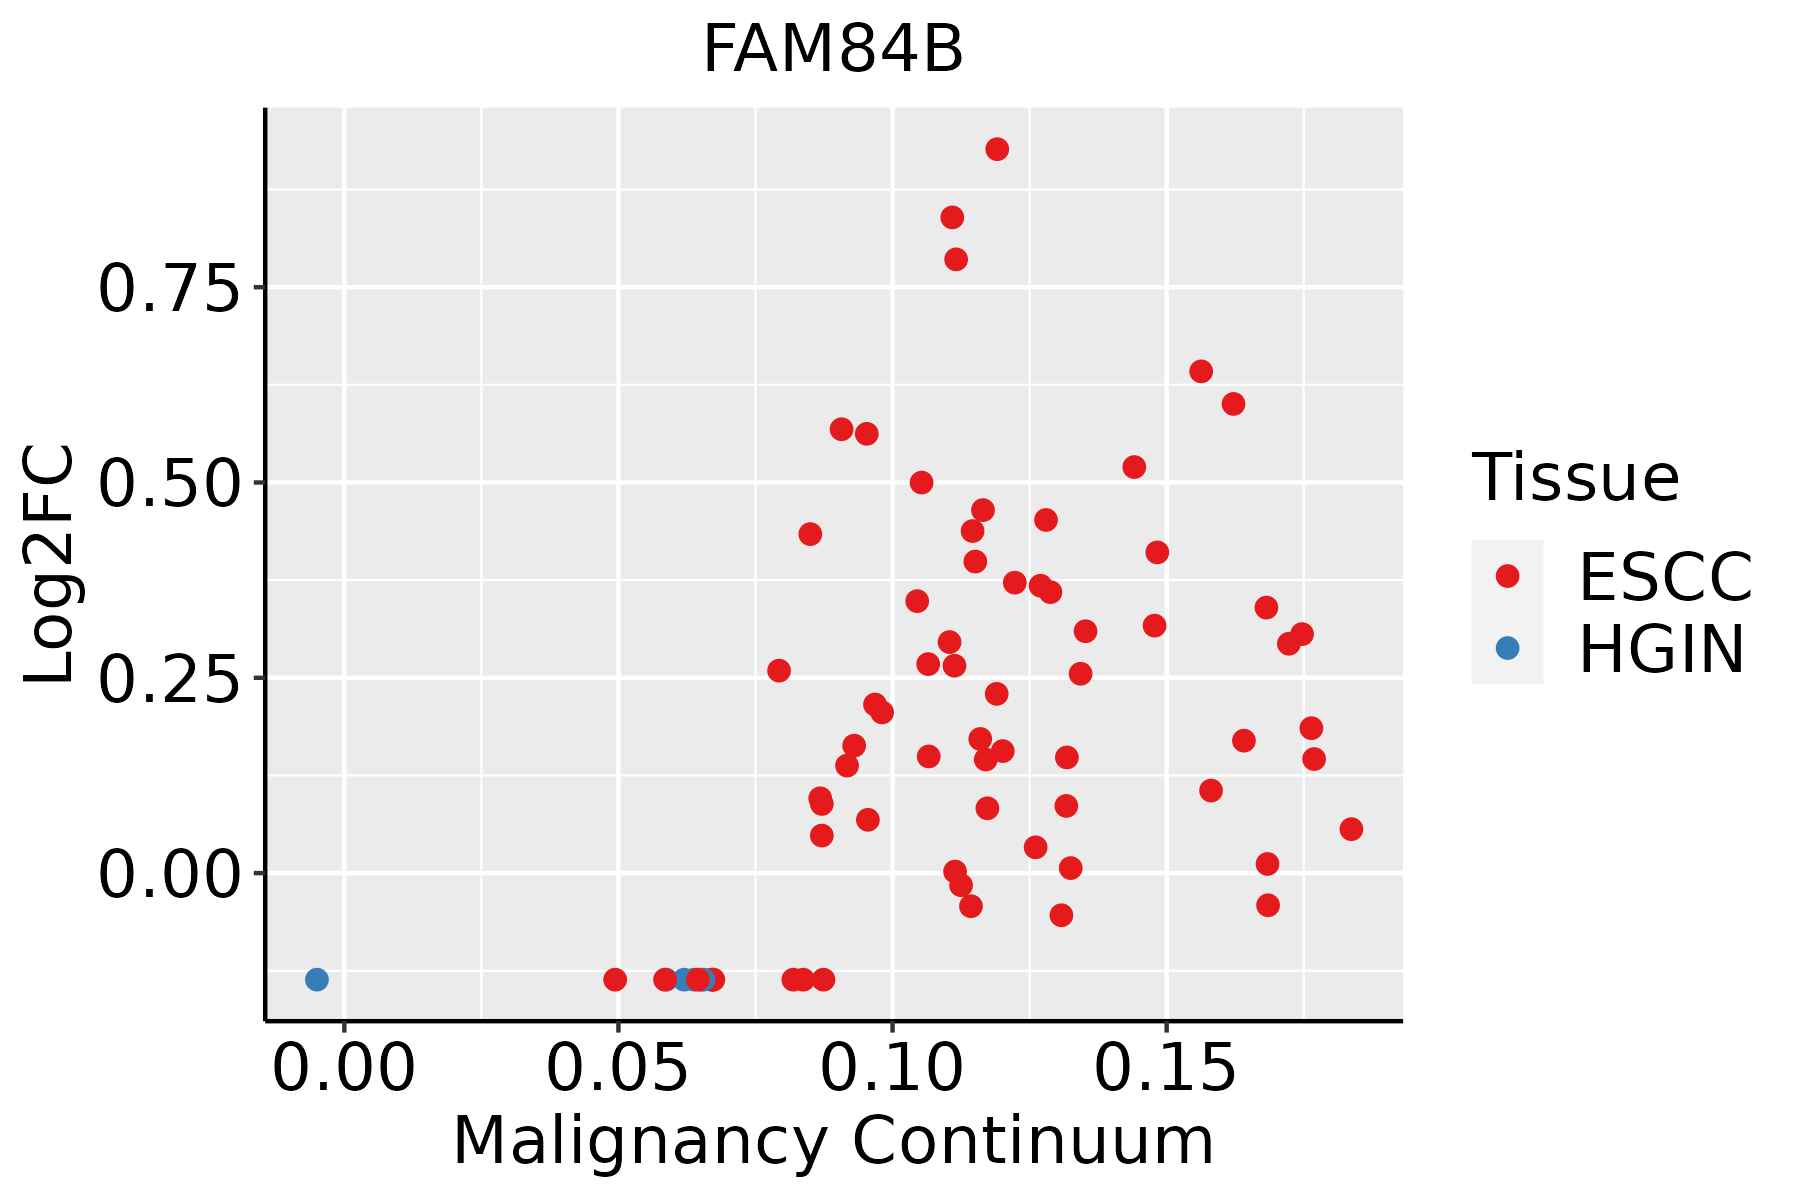 | ESCC: Esophageal squamous cell carcinoma |
| HGIN: High-grade intraepithelial neoplasias | ||
| LGIN: Low-grade intraepithelial neoplasias | ||
| Liver |  | HCC: Hepatocellular carcinoma |
| NAFLD: Non-alcoholic fatty liver disease | ||
| Oral Cavity | 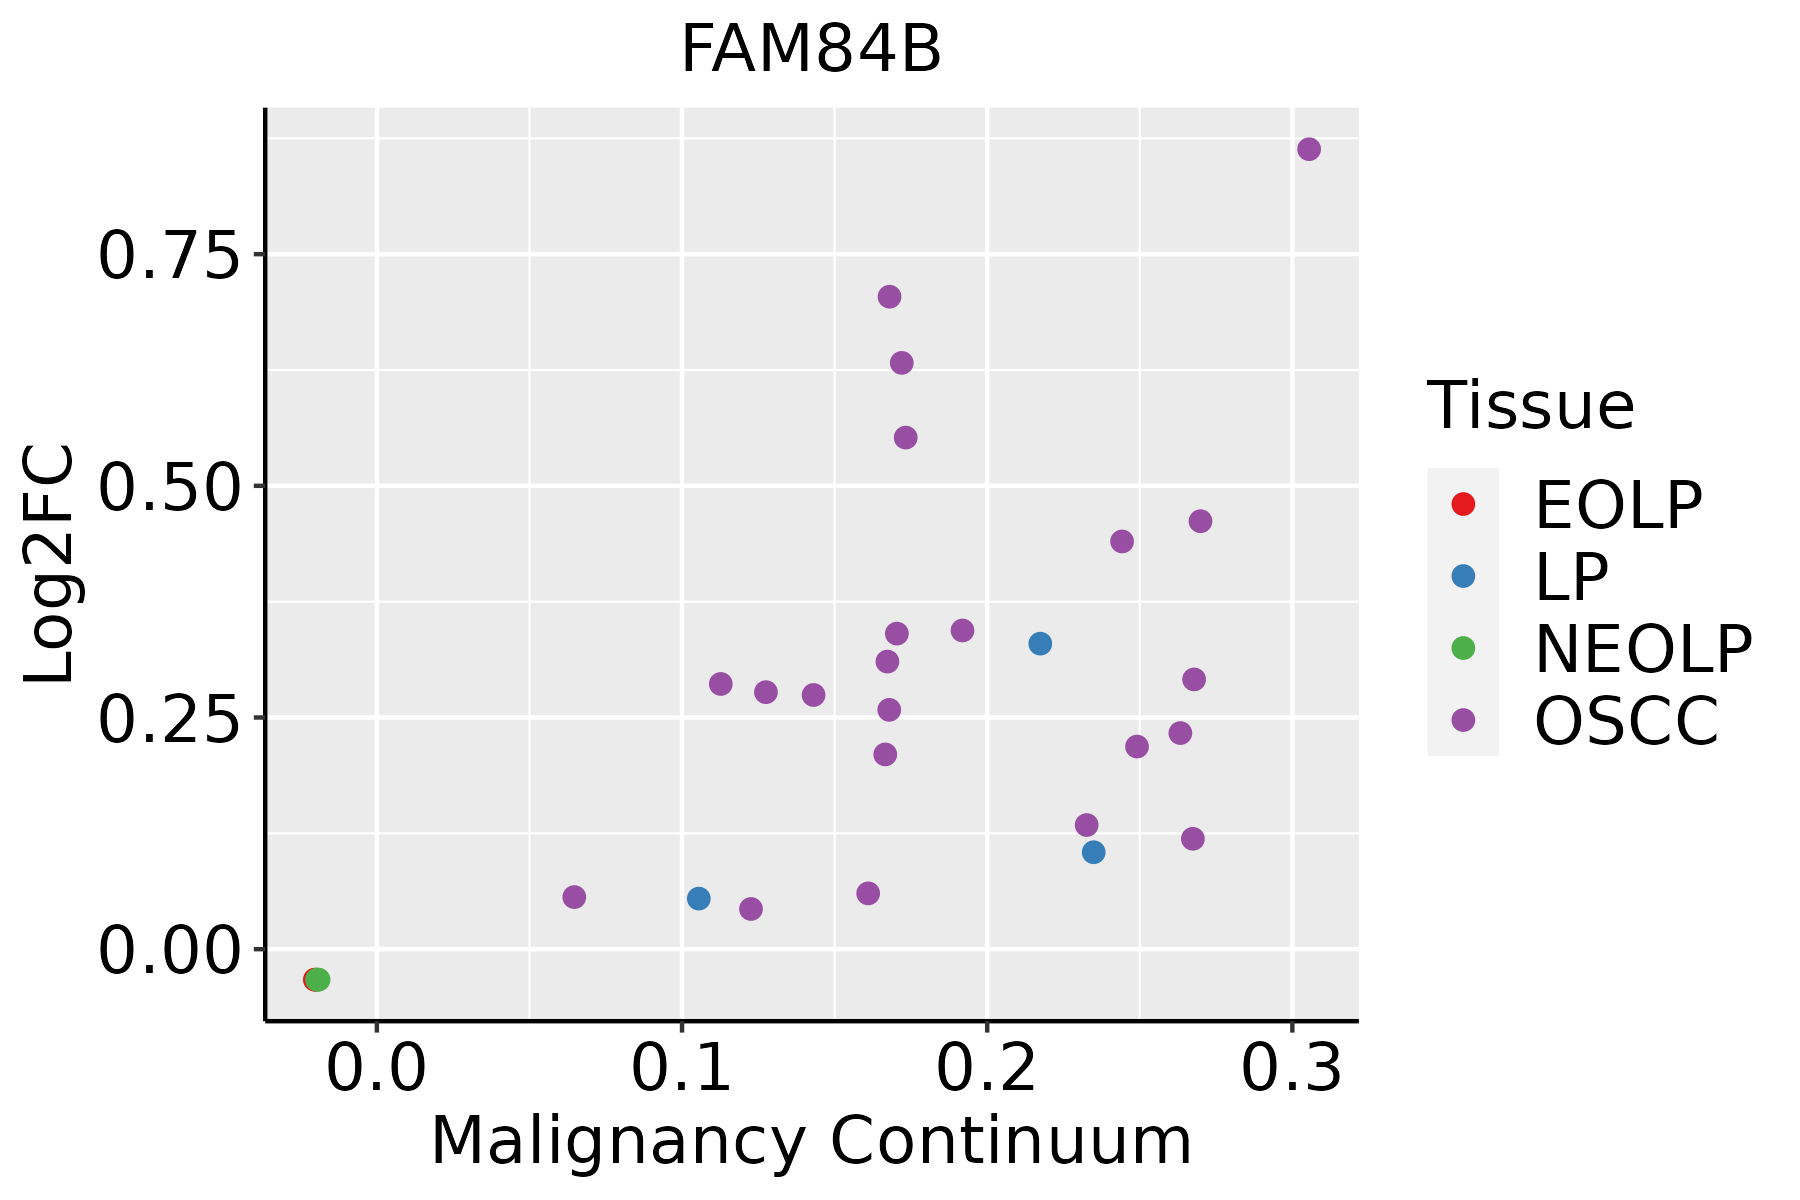 | EOLP: Erosive Oral lichen planus |
| LP: leukoplakia | ||
| NEOLP: Non-erosive oral lichen planus | ||
| OSCC: Oral squamous cell carcinoma | ||
| Prostate | 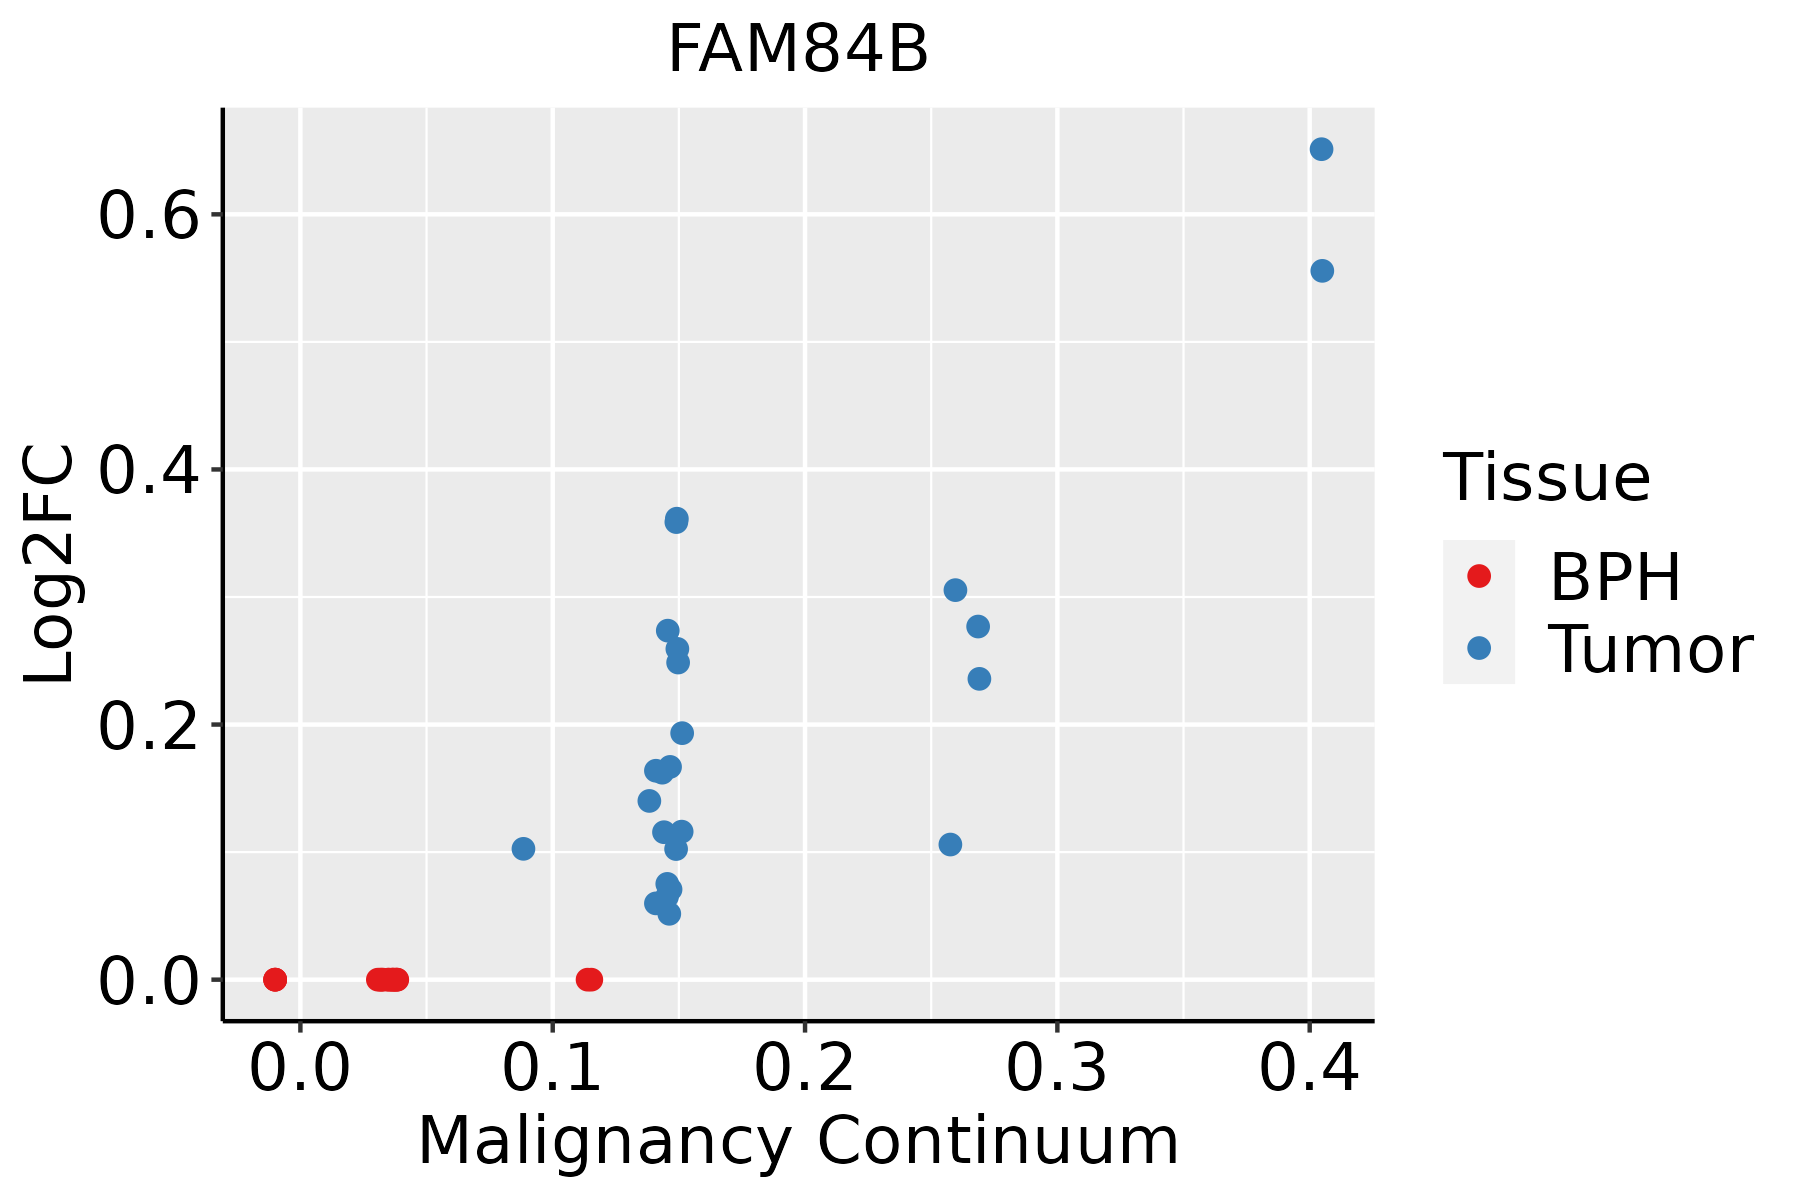 | BPH: Benign Prostatic Hyperplasia |
| ∗log2FC in expression of this searched gene in stem-like cells from each diseased tissue sample relative to stem-like cells in normal samples in each tissue plotted against the malignancy continuum. Samples are colored based on if they are from different disease stage. |
Top |
Malignant transformation related pathway analysis |
| Find out the enriched GO biological processes and KEGG pathways involved in transition from healthy to precancer to cancer |
| Tissue | Disease Stage | Enriched GO biological Processes |
| Colorectum | AD |  |
| Colorectum | SER |  |
| Colorectum | MSS |  |
| Colorectum | MSI-H |  |
| Colorectum | FAP |  |
| ∗Top 15 enriched GO BP terms are showed in the bar plot of each disease state in each tissue. Each row represents a significant GO biological process which is colored according to the -log10(p.adjust). |
| Page: 1 2 3 4 5 6 7 8 9 |
| GO ID | Tissue | Disease Stage | Description | Gene Ratio | Bg Ratio | pvalue | p.adjust | Count |
| Page: 1 |
| Pathway ID | Tissue | Disease Stage | Description | Gene Ratio | Bg Ratio | pvalue | p.adjust | qvalue | Count |
| Page: 1 |
Top |
Cell-cell communication analysis |
| Identification of potential cell-cell interactions between two cell types and their ligand-receptor pairs for different disease states |
| Ligand | Receptor | LRpair | Pathway | Tissue | Disease Stage |
| Page: 1 |
Top |
Single-cell gene regulatory network inference analysis |
| Find out the significant the regulons (TFs) and the target genes of each regulon across cell types for different disease states |
| TF | Cell Type | Tissue | Disease Stage | Target Gene | RSS | Regulon Activity |
| ∗The dot plots of a searched regulon are shown for all cell subpopulations in each disease state of each tissue based on the regulon specific score inferred using pySCENIC and by calculating the average expression. |
| Page: 1 |
Top |
Somatic mutation of malignant transformation related genes |
| Annotation of somatic variants for genes involved in malignant transformation |
| Hugo Symbol | Variant Class | Variant Classification | dbSNP RS | HGVSc | HGVSp | HGVSp Short | SWISSPROT | BIOTYPE | SIFT | PolyPhen | Tumor Sample Barcode | Tissue | Histology | Sex | Age | Stage | Therapy Types | Drugs | Outcome |
| FAM84B | SNV | Missense_Mutation | novel | c.738N>G | p.Ser246Arg | p.S246R | Q96KN1 | protein_coding | deleterious(0.02) | benign(0.045) | TCGA-B6-A401-01 | Breast | breast invasive carcinoma | Female | <65 | I/II | Chemotherapy | cyclophosphamide | SD |
| FAM84B | SNV | Missense_Mutation | novel | c.697N>G | p.Gln233Glu | p.Q233E | Q96KN1 | protein_coding | tolerated(0.12) | benign(0.034) | TCGA-HM-A4S6-01 | Cervix | cervical & endocervical cancer | Female | <65 | III/IV | Chemotherapy | cisplatin | CR |
| FAM84B | SNV | Missense_Mutation | c.812C>T | p.Thr271Met | p.T271M | Q96KN1 | protein_coding | tolerated(0.17) | benign(0) | TCGA-AD-6895-01 | Colorectum | colon adenocarcinoma | Male | >=65 | III/IV | Unknown | Unknown | SD | |
| FAM84B | SNV | Missense_Mutation | c.484C>T | p.Arg162Cys | p.R162C | Q96KN1 | protein_coding | tolerated(0.12) | probably_damaging(0.984) | TCGA-A5-A2K2-01 | Endometrium | uterine corpus endometrioid carcinoma | Female | >=65 | I/II | Chemotherapy | taxol | SD | |
| FAM84B | SNV | Missense_Mutation | novel | c.746N>G | p.Asp249Gly | p.D249G | Q96KN1 | protein_coding | deleterious(0) | probably_damaging(0.937) | TCGA-AX-A2HC-01 | Endometrium | uterine corpus endometrioid carcinoma | Female | <65 | III/IV | Chemotherapy | paclitaxel | PD |
| FAM84B | deletion | In_Frame_Del | novel | c.572_640delNNNNNNNNNNNNNNNNNNNNNNNNNNNNNNNNNNNNNNNNNNNNNNNNNNNNNNNNNNNNNNNNNNNNN | p.Ala191_Arg213del | p.A191_R213del | Q96KN1 | protein_coding | TCGA-D1-A1NY-01 | Endometrium | uterine corpus endometrioid carcinoma | Female | >=65 | I/II | Chemotherapy | carboplatin | SD | ||
| FAM84B | SNV | Missense_Mutation | c.918G>C | p.Glu306Asp | p.E306D | Q96KN1 | protein_coding | tolerated_low_confidence(0.1) | benign(0) | TCGA-FV-A2QQ-01 | Liver | liver hepatocellular carcinoma | Male | >=65 | I/II | Unknown | Unknown | SD | |
| FAM84B | SNV | Missense_Mutation | c.104C>A | p.Ser35Tyr | p.S35Y | Q96KN1 | protein_coding | deleterious(0) | probably_damaging(0.998) | TCGA-50-5072-01 | Lung | lung adenocarcinoma | Male | >=65 | III/IV | Chemotherapy | cisplatin | PD | |
| FAM84B | SNV | Missense_Mutation | c.653G>T | p.Gly218Val | p.G218V | Q96KN1 | protein_coding | deleterious(0) | probably_damaging(0.968) | TCGA-L9-A7SV-01 | Lung | lung adenocarcinoma | Male | >=65 | I/II | Chemotherapy | cisplatin | CR | |
| FAM84B | SNV | Missense_Mutation | novel | c.407N>T | p.Tyr136Phe | p.Y136F | Q96KN1 | protein_coding | tolerated(0.09) | possibly_damaging(0.908) | TCGA-85-A4QQ-01 | Lung | lung squamous cell carcinoma | Male | >=65 | I/II | Unknown | Unknown | SD |
| Page: 1 2 |
Top |
Related drugs of malignant transformation related genes |
| Identification of chemicals and drugs interact with genes involved in malignant transfromation |
| (DGIdb 4.0) |
| Entrez ID | Symbol | Category | Interaction Types | Drug Claim Name | Drug Name | PMIDs |
| Page: 1 |

Copyright 2023-Present -The University of Texas Health Science Center at Houston |