
|
|||||
|
 | |
| |
| |
| |
| |
| |
|
Gene: FAM84A |
Gene summary for FAM84A |
| Gene information | Species | Human | Gene symbol | FAM84A | Gene ID | 151354 |
| Gene name | LRAT domain containing 1 | |
| Gene Alias | FAM84A | |
| Cytomap | 2p24.3 | |
| Gene Type | protein-coding | GO ID | GO:0000902 | UniProtAcc | Q96KN4 |
Top |
Malignant transformation analysis |
| Identification of the aberrant gene expression in precancerous and cancerous lesions by comparing the gene expression of stem-like cells in diseased tissues with normal stem cells |
| Entrez ID | Symbol | Replicates | Species | Organ | Tissue | Adj P-value | Log2FC | Malignancy |
| 151354 | FAM84A | HTA11_3410_2000001011 | Human | Colorectum | AD | 1.38e-16 | -4.62e-01 | 0.0155 |
| 151354 | FAM84A | HTA11_2487_2000001011 | Human | Colorectum | SER | 2.61e-09 | -4.62e-01 | -0.1808 |
| 151354 | FAM84A | HTA11_1938_2000001011 | Human | Colorectum | AD | 9.48e-07 | -4.62e-01 | -0.0811 |
| 151354 | FAM84A | HTA11_78_2000001011 | Human | Colorectum | AD | 3.43e-11 | -4.62e-01 | -0.1088 |
| 151354 | FAM84A | HTA11_347_2000001011 | Human | Colorectum | AD | 6.74e-18 | -4.62e-01 | -0.1954 |
| 151354 | FAM84A | HTA11_3361_2000001011 | Human | Colorectum | AD | 4.60e-07 | -4.62e-01 | -0.1207 |
| 151354 | FAM84A | HTA11_83_2000001011 | Human | Colorectum | SER | 2.24e-05 | -4.62e-01 | -0.1526 |
| 151354 | FAM84A | HTA11_696_2000001011 | Human | Colorectum | AD | 2.17e-24 | -4.62e-01 | -0.1464 |
| 151354 | FAM84A | HTA11_866_2000001011 | Human | Colorectum | AD | 9.02e-22 | -4.62e-01 | -0.1001 |
| 151354 | FAM84A | HTA11_1391_2000001011 | Human | Colorectum | AD | 3.29e-13 | -4.62e-01 | -0.059 |
| 151354 | FAM84A | HTA11_5212_2000001011 | Human | Colorectum | AD | 3.19e-02 | -4.62e-01 | -0.2061 |
| 151354 | FAM84A | HTA11_546_2000001011 | Human | Colorectum | AD | 1.89e-04 | -4.62e-01 | -0.0842 |
| 151354 | FAM84A | HTA11_7862_2000001011 | Human | Colorectum | AD | 2.58e-03 | -4.62e-01 | -0.0179 |
| 151354 | FAM84A | HTA11_866_3004761011 | Human | Colorectum | AD | 1.69e-14 | -4.62e-01 | 0.096 |
| 151354 | FAM84A | HTA11_8622_2000001021 | Human | Colorectum | SER | 1.68e-02 | -4.62e-01 | 0.0528 |
| 151354 | FAM84A | HTA11_10623_2000001011 | Human | Colorectum | AD | 4.79e-03 | -4.62e-01 | -0.0177 |
| 151354 | FAM84A | HTA11_10711_2000001011 | Human | Colorectum | AD | 1.40e-08 | -4.62e-01 | 0.0338 |
| 151354 | FAM84A | HTA11_7696_3000711011 | Human | Colorectum | AD | 9.02e-22 | -4.62e-01 | 0.0674 |
| 151354 | FAM84A | HTA11_6818_2000001011 | Human | Colorectum | AD | 3.17e-03 | -4.62e-01 | 0.0112 |
| 151354 | FAM84A | HTA11_6818_2000001021 | Human | Colorectum | AD | 2.36e-06 | -4.62e-01 | 0.0588 |
| Page: 1 2 3 4 5 6 |
| Tissue | Expression Dynamics | Abbreviation |
| Colorectum (GSE201348) |  | FAP: Familial adenomatous polyposis |
| CRC: Colorectal cancer | ||
| Colorectum (HTA11) |  | AD: Adenomas |
| SER: Sessile serrated lesions | ||
| MSI-H: Microsatellite-high colorectal cancer | ||
| MSS: Microsatellite stable colorectal cancer | ||
| Esophagus |  | ESCC: Esophageal squamous cell carcinoma |
| HGIN: High-grade intraepithelial neoplasias | ||
| LGIN: Low-grade intraepithelial neoplasias | ||
| Oral Cavity |  | EOLP: Erosive Oral lichen planus |
| LP: leukoplakia | ||
| NEOLP: Non-erosive oral lichen planus | ||
| OSCC: Oral squamous cell carcinoma | ||
| Prostate | 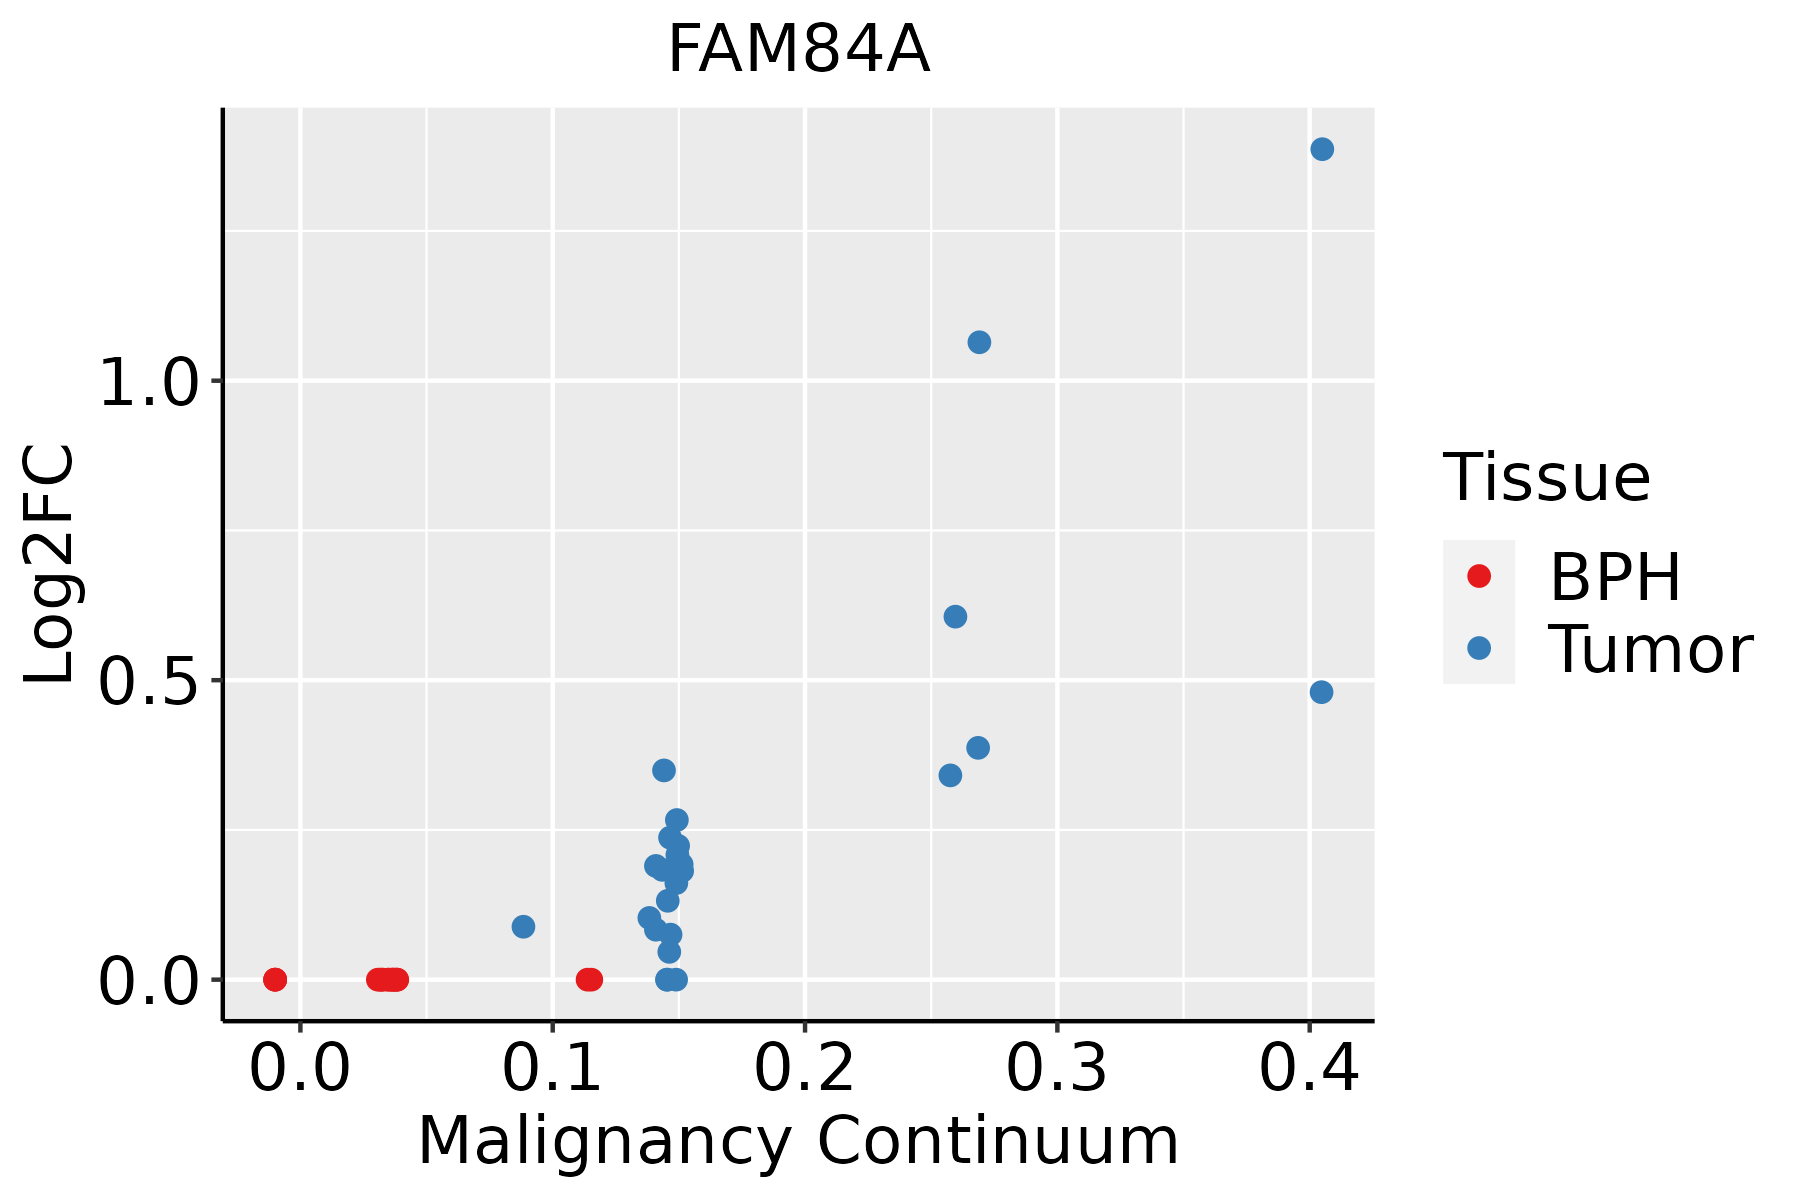 | BPH: Benign Prostatic Hyperplasia |
| Skin | 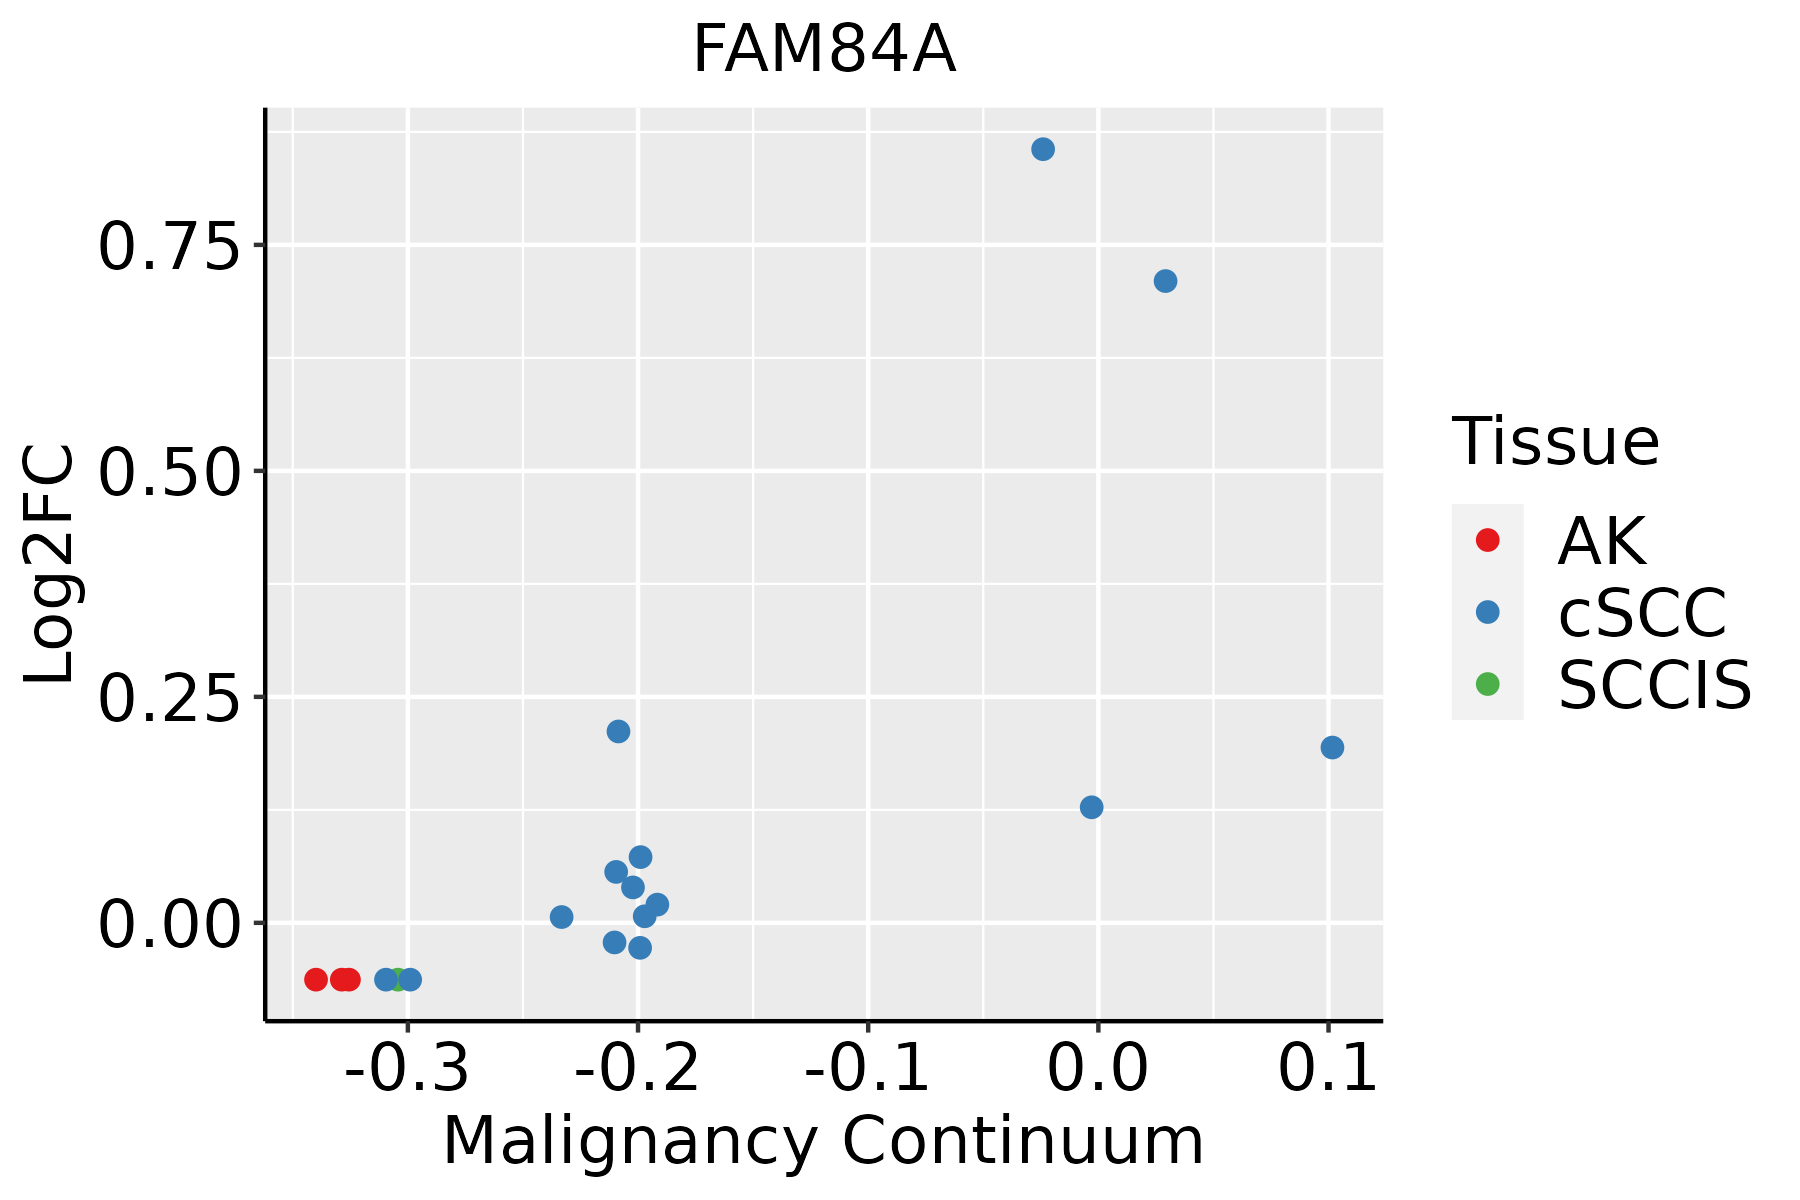 | AK: Actinic keratosis |
| cSCC: Cutaneous squamous cell carcinoma | ||
| SCCIS:squamous cell carcinoma in situ | ||
| Thyroid | 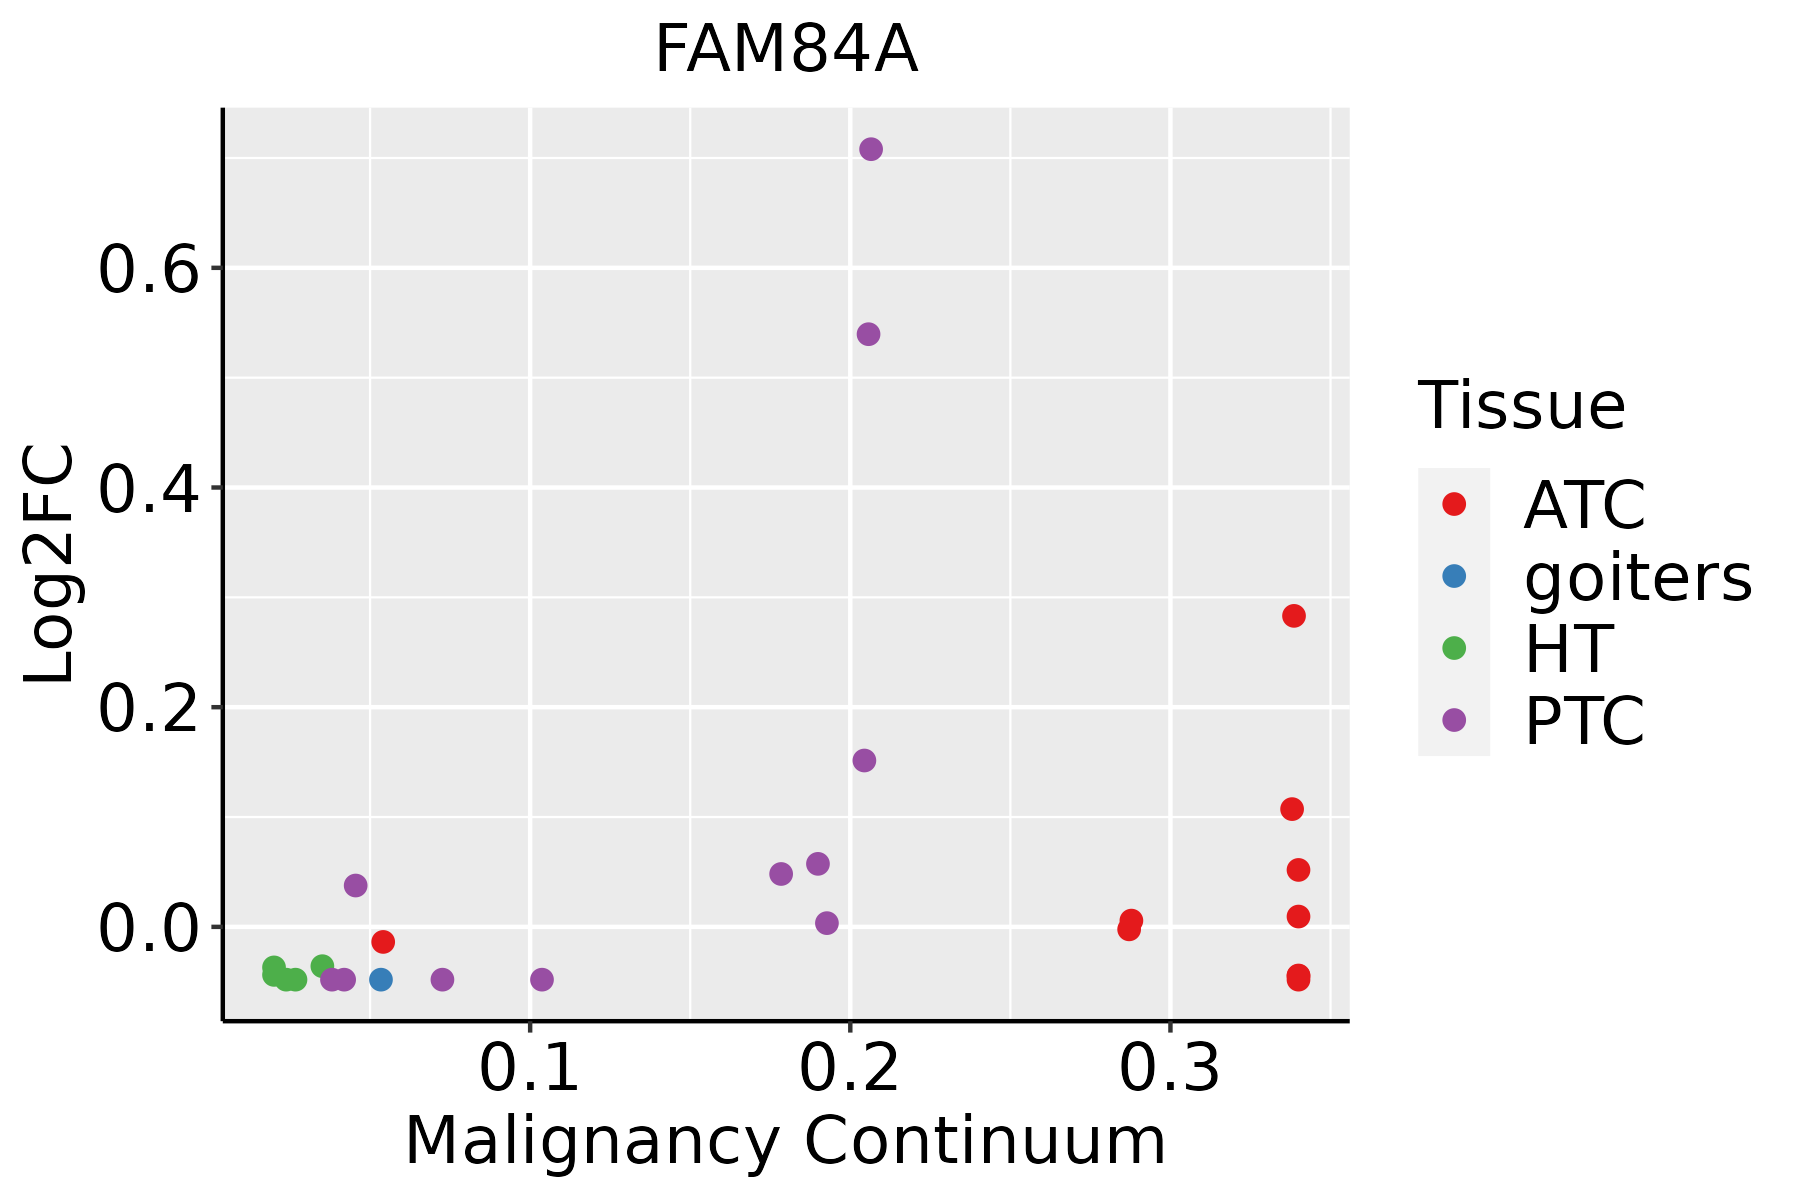 | ATC: Anaplastic thyroid cancer |
| HT: Hashimoto's thyroiditis | ||
| PTC: Papillary thyroid cancer |
| ∗log2FC in expression of this searched gene in stem-like cells from each diseased tissue sample relative to stem-like cells in normal samples in each tissue plotted against the malignancy continuum. Samples are colored based on if they are from different disease stage. |
Top |
Malignant transformation related pathway analysis |
| Find out the enriched GO biological processes and KEGG pathways involved in transition from healthy to precancer to cancer |
| Tissue | Disease Stage | Enriched GO biological Processes |
| Colorectum | AD |  |
| Colorectum | SER |  |
| Colorectum | MSS |  |
| Colorectum | MSI-H |  |
| Colorectum | FAP |  |
| ∗Top 15 enriched GO BP terms are showed in the bar plot of each disease state in each tissue. Each row represents a significant GO biological process which is colored according to the -log10(p.adjust). |
| Page: 1 2 3 4 5 6 7 8 9 |
| GO ID | Tissue | Disease Stage | Description | Gene Ratio | Bg Ratio | pvalue | p.adjust | Count |
| Page: 1 |
| Pathway ID | Tissue | Disease Stage | Description | Gene Ratio | Bg Ratio | pvalue | p.adjust | qvalue | Count |
| Page: 1 |
Top |
Cell-cell communication analysis |
| Identification of potential cell-cell interactions between two cell types and their ligand-receptor pairs for different disease states |
| Ligand | Receptor | LRpair | Pathway | Tissue | Disease Stage |
| Page: 1 |
Top |
Single-cell gene regulatory network inference analysis |
| Find out the significant the regulons (TFs) and the target genes of each regulon across cell types for different disease states |
| TF | Cell Type | Tissue | Disease Stage | Target Gene | RSS | Regulon Activity |
| ∗The dot plots of a searched regulon are shown for all cell subpopulations in each disease state of each tissue based on the regulon specific score inferred using pySCENIC and by calculating the average expression. |
| Page: 1 |
Top |
Somatic mutation of malignant transformation related genes |
| Annotation of somatic variants for genes involved in malignant transformation |
| Hugo Symbol | Variant Class | Variant Classification | dbSNP RS | HGVSc | HGVSp | HGVSp Short | SWISSPROT | BIOTYPE | SIFT | PolyPhen | Tumor Sample Barcode | Tissue | Histology | Sex | Age | Stage | Therapy Types | Drugs | Outcome |
| FAM84A | SNV | Missense_Mutation | c.836G>A | p.Arg279Gln | p.R279Q | Q96KN4 | protein_coding | tolerated(0.31) | benign(0.012) | TCGA-3C-AALI-01 | Breast | breast invasive carcinoma | Female | <65 | I/II | Unspecific | Poly E | Complete Response | |
| FAM84A | SNV | Missense_Mutation | rs756473710 | c.836N>C | p.Arg279Pro | p.R279P | Q96KN4 | protein_coding | tolerated(0.1) | benign(0.425) | TCGA-D8-A1JA-01 | Breast | breast invasive carcinoma | Female | <65 | III/IV | Chemotherapy | adriamycin | PD |
| FAM84A | SNV | Missense_Mutation | novel | c.184A>C | p.Thr62Pro | p.T62P | Q96KN4 | protein_coding | tolerated(0.28) | benign(0.07) | TCGA-C5-A8XK-01 | Cervix | cervical & endocervical cancer | Female | <65 | I/II | Chemotherapy | cisplatin | SD |
| FAM84A | SNV | Missense_Mutation | novel | c.482N>C | p.Ile161Thr | p.I161T | Q96KN4 | protein_coding | deleterious(0) | probably_damaging(0.995) | TCGA-A6-5666-01 | Colorectum | colon adenocarcinoma | Male | >=65 | I/II | Unknown | Unknown | PD |
| FAM84A | SNV | Missense_Mutation | c.111N>A | p.Phe37Leu | p.F37L | Q96KN4 | protein_coding | deleterious(0) | probably_damaging(0.935) | TCGA-A5-A2K5-01 | Endometrium | uterine corpus endometrioid carcinoma | Female | >=65 | I/II | Unknown | Unknown | SD | |
| FAM84A | SNV | Missense_Mutation | novel | c.787N>A | p.Glu263Lys | p.E263K | Q96KN4 | protein_coding | deleterious(0) | probably_damaging(0.968) | TCGA-AP-A0LM-01 | Endometrium | uterine corpus endometrioid carcinoma | Female | <65 | III/IV | Chemotherapy | cisplatin | SD |
| FAM84A | SNV | Missense_Mutation | novel | c.272G>A | p.Gly91Asp | p.G91D | Q96KN4 | protein_coding | tolerated(0.39) | benign(0.42) | TCGA-B5-A1MR-01 | Endometrium | uterine corpus endometrioid carcinoma | Female | >=65 | III/IV | Unknown | Unknown | SD |
| FAM84A | SNV | Missense_Mutation | c.31C>A | p.Leu11Ile | p.L11I | Q96KN4 | protein_coding | deleterious(0.03) | probably_damaging(0.981) | TCGA-DF-A2KU-01 | Endometrium | uterine corpus endometrioid carcinoma | Female | Unknown | I/II | Unknown | Unknown | SD | |
| FAM84A | SNV | Missense_Mutation | c.335C>T | p.Ala112Val | p.A112V | Q96KN4 | protein_coding | deleterious(0.03) | benign(0.04) | TCGA-DF-A2KU-01 | Endometrium | uterine corpus endometrioid carcinoma | Female | Unknown | I/II | Unknown | Unknown | SD | |
| FAM84A | SNV | Missense_Mutation | c.301G>T | p.Gly101Cys | p.G101C | Q96KN4 | protein_coding | tolerated(0.06) | possibly_damaging(0.668) | TCGA-CC-A7II-01 | Liver | liver hepatocellular carcinoma | Male | <65 | III/IV | Unknown | Unknown | PD |
| Page: 1 2 3 |
Top |
Related drugs of malignant transformation related genes |
| Identification of chemicals and drugs interact with genes involved in malignant transfromation |
| (DGIdb 4.0) |
| Entrez ID | Symbol | Category | Interaction Types | Drug Claim Name | Drug Name | PMIDs |
| Page: 1 |

Copyright 2023-Present -The University of Texas Health Science Center at Houston |