
|
|||||
|
 | |
| |
| |
| |
| |
| |
|
Gene: FAM83G |
Gene summary for FAM83G |
| Gene information | Species | Human | Gene symbol | FAM83G | Gene ID | 644815 |
| Gene name | family with sequence similarity 83 member G | |
| Gene Alias | PAWS1 | |
| Cytomap | 17p11.2 | |
| Gene Type | protein-coding | GO ID | GO:0007154 | UniProtAcc | A6ND36 |
Top |
Malignant transformation analysis |
| Identification of the aberrant gene expression in precancerous and cancerous lesions by comparing the gene expression of stem-like cells in diseased tissues with normal stem cells |
| Entrez ID | Symbol | Replicates | Species | Organ | Tissue | Adj P-value | Log2FC | Malignancy |
| 644815 | FAM83G | LZE4T | Human | Esophagus | ESCC | 3.93e-09 | 2.21e-02 | 0.0811 |
| 644815 | FAM83G | LZE7T | Human | Esophagus | ESCC | 3.95e-11 | 9.98e-02 | 0.0667 |
| 644815 | FAM83G | LZE8T | Human | Esophagus | ESCC | 1.44e-12 | 1.86e-02 | 0.067 |
| 644815 | FAM83G | LZE20T | Human | Esophagus | ESCC | 1.01e-03 | -1.37e-01 | 0.0662 |
| 644815 | FAM83G | LZE24T | Human | Esophagus | ESCC | 2.11e-04 | 3.07e-02 | 0.0596 |
| 644815 | FAM83G | LZE21T | Human | Esophagus | ESCC | 9.80e-07 | 1.20e-01 | 0.0655 |
| 644815 | FAM83G | P2T-E | Human | Esophagus | ESCC | 8.21e-07 | -1.18e-01 | 0.1177 |
| 644815 | FAM83G | P4T-E | Human | Esophagus | ESCC | 4.99e-08 | 6.05e-02 | 0.1323 |
| 644815 | FAM83G | P5T-E | Human | Esophagus | ESCC | 6.32e-07 | -1.60e-01 | 0.1327 |
| 644815 | FAM83G | P8T-E | Human | Esophagus | ESCC | 3.41e-05 | -2.28e-02 | 0.0889 |
| 644815 | FAM83G | P9T-E | Human | Esophagus | ESCC | 6.02e-07 | 1.00e-01 | 0.1131 |
| 644815 | FAM83G | P10T-E | Human | Esophagus | ESCC | 2.17e-09 | 4.28e-02 | 0.116 |
| 644815 | FAM83G | P11T-E | Human | Esophagus | ESCC | 3.61e-02 | 3.96e-01 | 0.1426 |
| 644815 | FAM83G | P12T-E | Human | Esophagus | ESCC | 2.65e-13 | 6.59e-02 | 0.1122 |
| 644815 | FAM83G | P15T-E | Human | Esophagus | ESCC | 5.60e-05 | 1.68e-02 | 0.1149 |
| 644815 | FAM83G | P16T-E | Human | Esophagus | ESCC | 8.33e-10 | -1.33e-01 | 0.1153 |
| 644815 | FAM83G | P17T-E | Human | Esophagus | ESCC | 2.96e-11 | 3.22e-02 | 0.1278 |
| 644815 | FAM83G | P20T-E | Human | Esophagus | ESCC | 1.01e-14 | 3.48e-02 | 0.1124 |
| 644815 | FAM83G | P21T-E | Human | Esophagus | ESCC | 2.46e-14 | 3.79e-01 | 0.1617 |
| 644815 | FAM83G | P22T-E | Human | Esophagus | ESCC | 1.07e-13 | -6.67e-03 | 0.1236 |
| Page: 1 2 3 4 5 |
| Tissue | Expression Dynamics | Abbreviation |
| Esophagus |  | ESCC: Esophageal squamous cell carcinoma |
| HGIN: High-grade intraepithelial neoplasias | ||
| LGIN: Low-grade intraepithelial neoplasias | ||
| Liver | 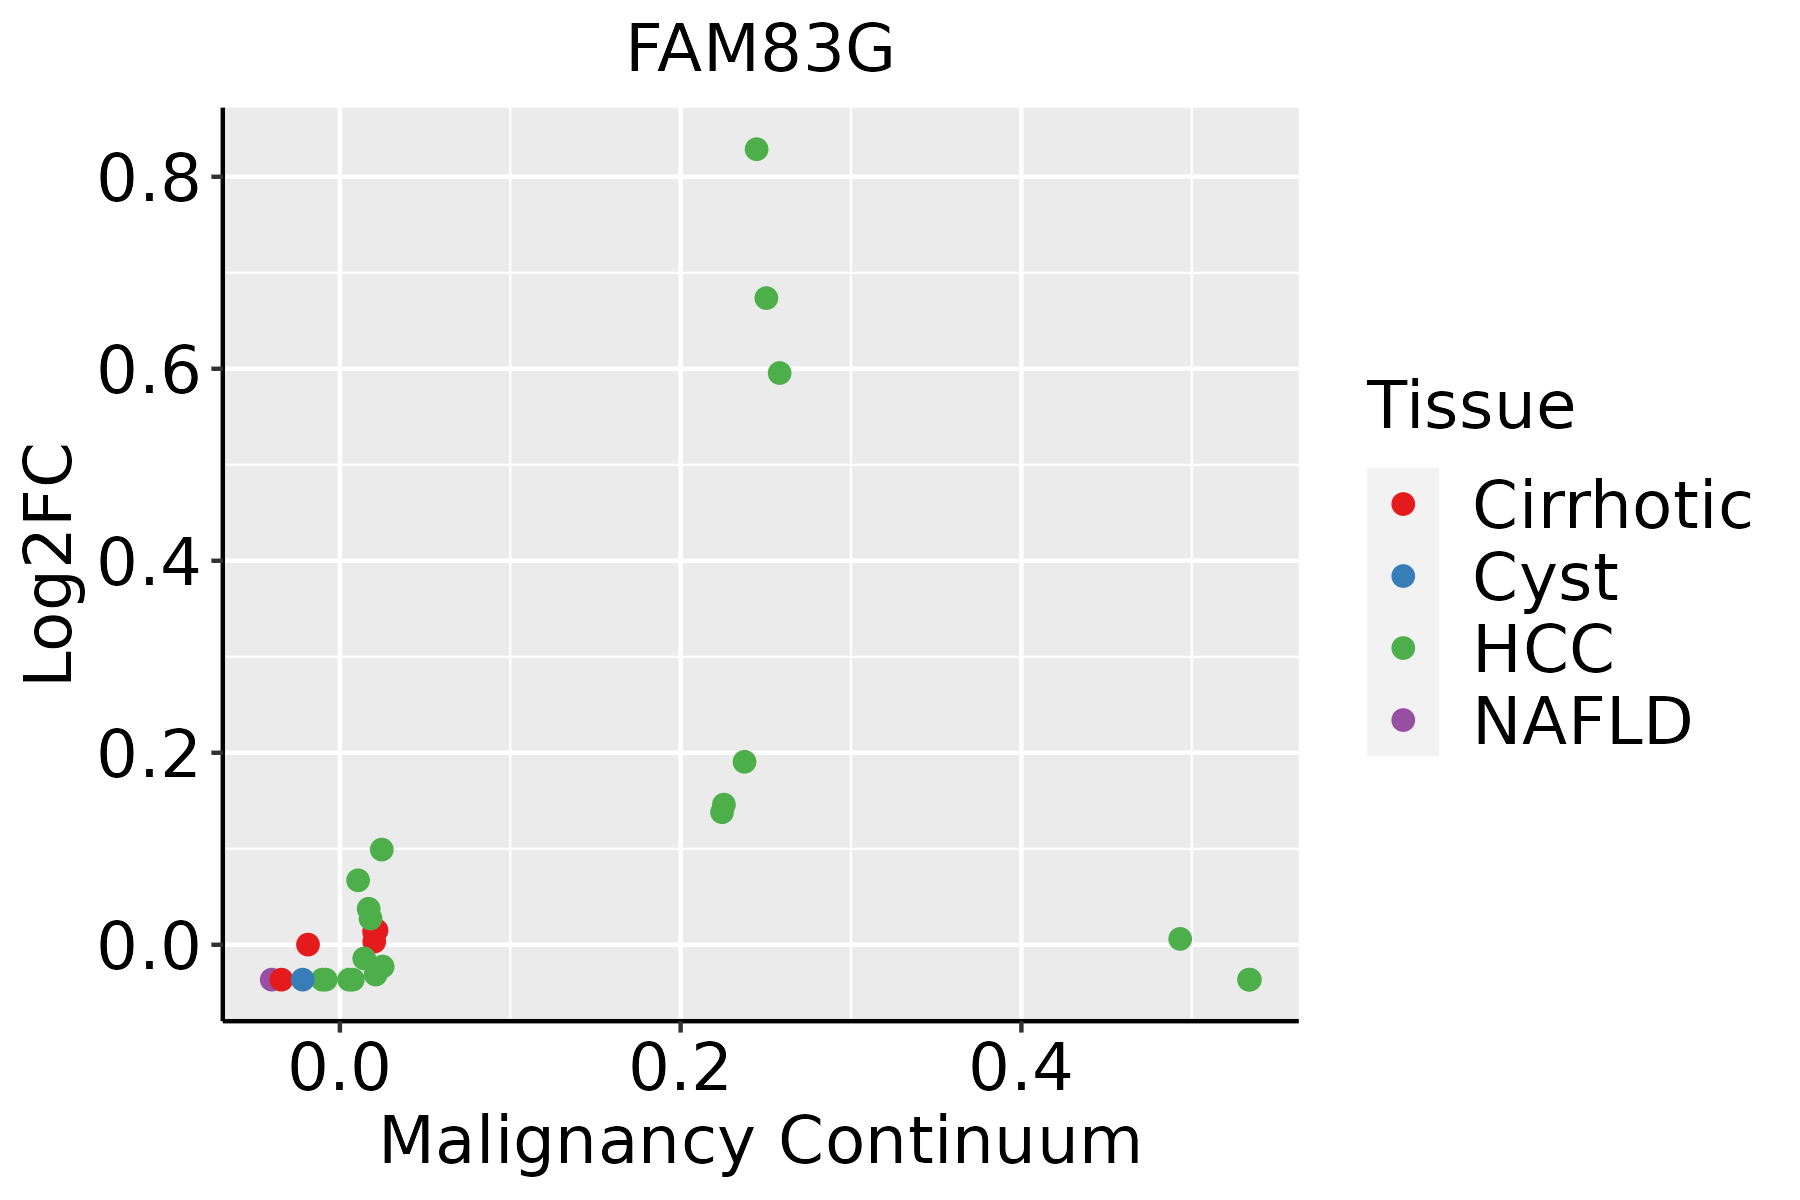 | HCC: Hepatocellular carcinoma |
| NAFLD: Non-alcoholic fatty liver disease | ||
| Oral Cavity | 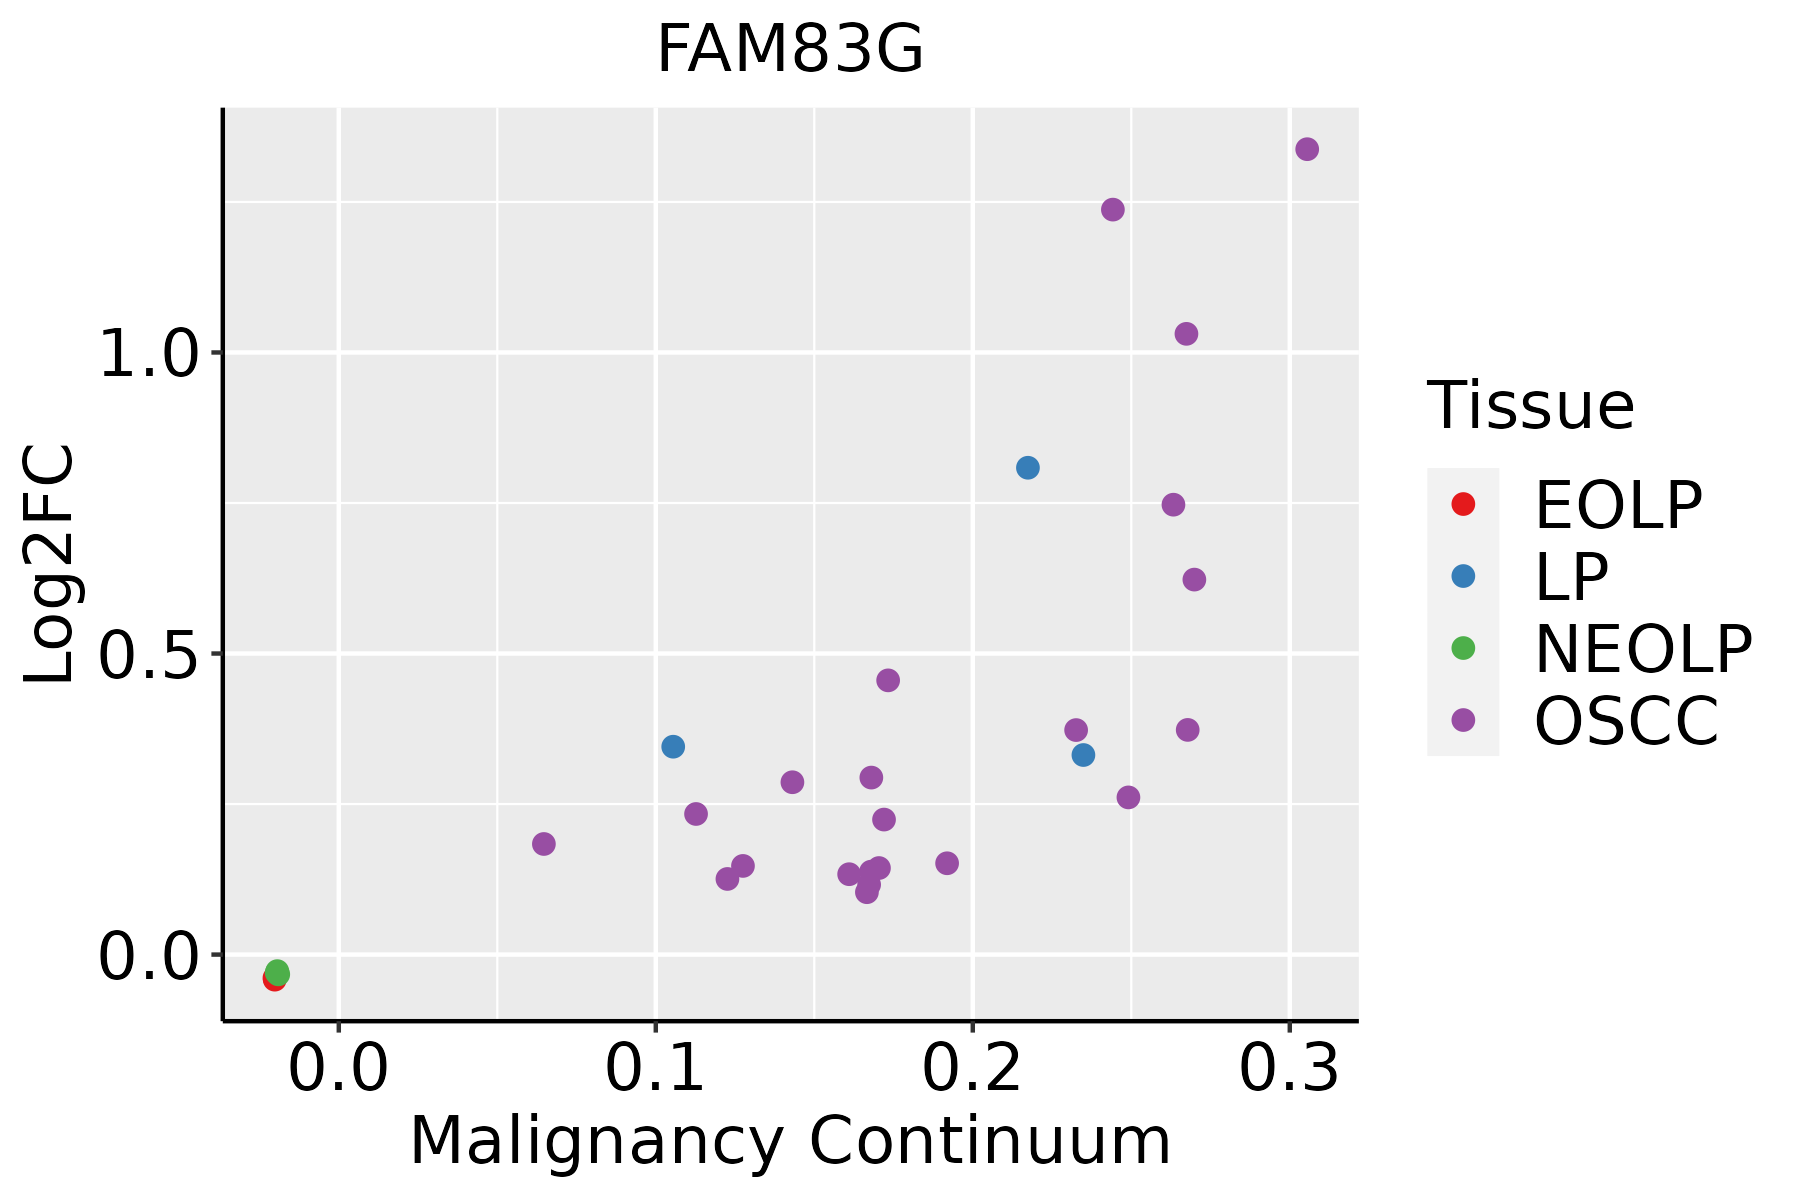 | EOLP: Erosive Oral lichen planus |
| LP: leukoplakia | ||
| NEOLP: Non-erosive oral lichen planus | ||
| OSCC: Oral squamous cell carcinoma | ||
| Skin | 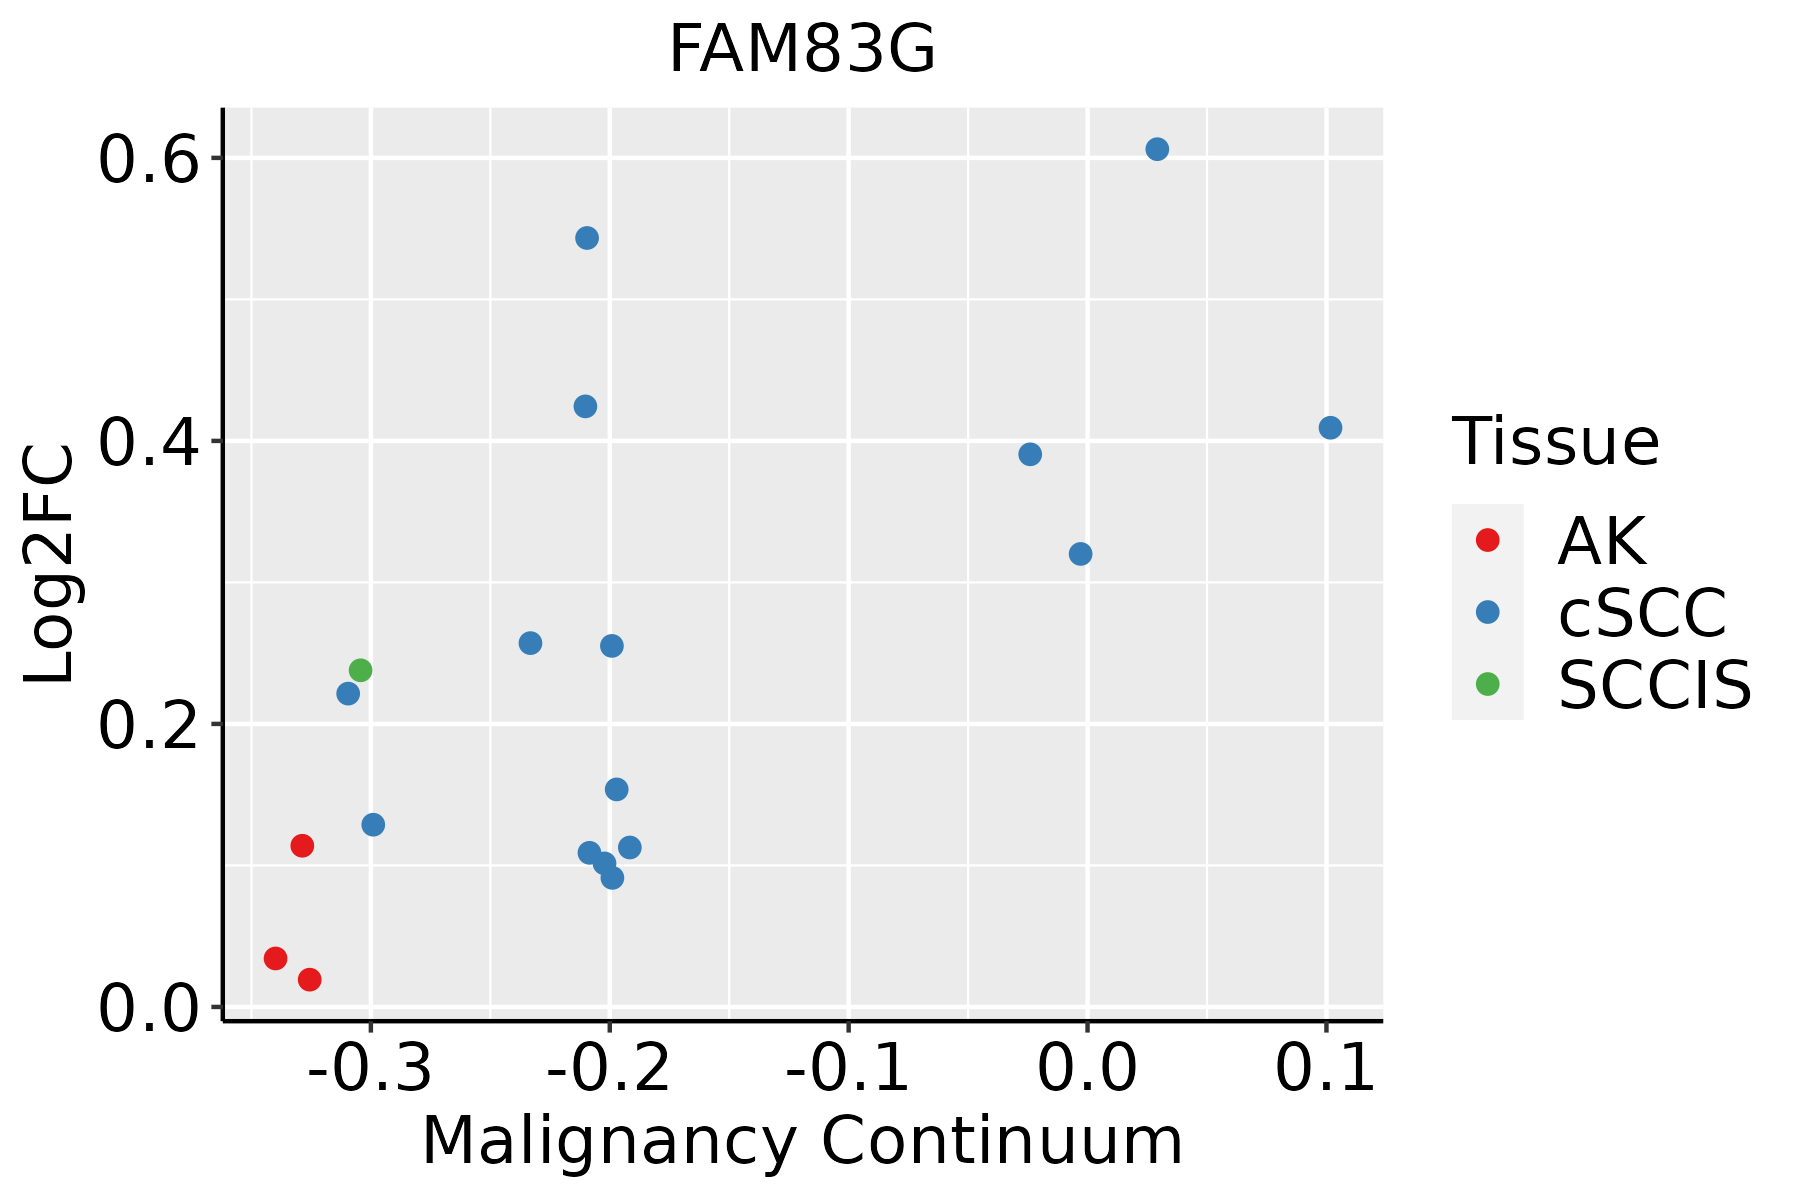 | AK: Actinic keratosis |
| cSCC: Cutaneous squamous cell carcinoma | ||
| SCCIS:squamous cell carcinoma in situ |
| ∗log2FC in expression of this searched gene in stem-like cells from each diseased tissue sample relative to stem-like cells in normal samples in each tissue plotted against the malignancy continuum. Samples are colored based on if they are from different disease stage. |
Top |
Malignant transformation related pathway analysis |
| Find out the enriched GO biological processes and KEGG pathways involved in transition from healthy to precancer to cancer |
| Tissue | Disease Stage | Enriched GO biological Processes |
| Colorectum | AD |  |
| Colorectum | SER |  |
| Colorectum | MSS |  |
| Colorectum | MSI-H |  |
| Colorectum | FAP |  |
| ∗Top 15 enriched GO BP terms are showed in the bar plot of each disease state in each tissue. Each row represents a significant GO biological process which is colored according to the -log10(p.adjust). |
| Page: 1 2 3 4 5 6 7 8 9 |
| GO ID | Tissue | Disease Stage | Description | Gene Ratio | Bg Ratio | pvalue | p.adjust | Count |
| GO:000717810 | Esophagus | ESCC | transmembrane receptor protein serine/threonine kinase signaling pathway | 195/8552 | 355/18723 | 2.58e-04 | 1.58e-03 | 195 |
| GO:00071789 | Oral cavity | OSCC | transmembrane receptor protein serine/threonine kinase signaling pathway | 165/7305 | 355/18723 | 2.31e-03 | 1.02e-02 | 165 |
| Page: 1 |
| Pathway ID | Tissue | Disease Stage | Description | Gene Ratio | Bg Ratio | pvalue | p.adjust | qvalue | Count |
| Page: 1 |
Top |
Cell-cell communication analysis |
| Identification of potential cell-cell interactions between two cell types and their ligand-receptor pairs for different disease states |
| Ligand | Receptor | LRpair | Pathway | Tissue | Disease Stage |
| Page: 1 |
Top |
Single-cell gene regulatory network inference analysis |
| Find out the significant the regulons (TFs) and the target genes of each regulon across cell types for different disease states |
| TF | Cell Type | Tissue | Disease Stage | Target Gene | RSS | Regulon Activity |
| ∗The dot plots of a searched regulon are shown for all cell subpopulations in each disease state of each tissue based on the regulon specific score inferred using pySCENIC and by calculating the average expression. |
| Page: 1 |
Top |
Somatic mutation of malignant transformation related genes |
| Annotation of somatic variants for genes involved in malignant transformation |
| Hugo Symbol | Variant Class | Variant Classification | dbSNP RS | HGVSc | HGVSp | HGVSp Short | SWISSPROT | BIOTYPE | SIFT | PolyPhen | Tumor Sample Barcode | Tissue | Histology | Sex | Age | Stage | Therapy Types | Drugs | Outcome |
| FAM83G | SNV | Missense_Mutation | rs753302947 | c.821N>T | p.Thr274Met | p.T274M | A6ND36 | protein_coding | deleterious(0) | probably_damaging(0.988) | TCGA-A8-A09Z-01 | Breast | breast invasive carcinoma | Female | >=65 | I/II | Unknown | Unknown | SD |
| FAM83G | SNV | Missense_Mutation | c.1336N>T | p.Arg446Cys | p.R446C | A6ND36 | protein_coding | deleterious(0) | probably_damaging(0.988) | TCGA-D8-A1XZ-01 | Breast | breast invasive carcinoma | Female | >=65 | III/IV | Hormone Therapy | tamoxiphen+anastrozolum | SD | |
| FAM83G | SNV | Missense_Mutation | novel | c.2187N>A | p.Ser729Arg | p.S729R | A6ND36 | protein_coding | tolerated(0.5) | benign(0) | TCGA-UU-A93S-01 | Breast | breast invasive carcinoma | Female | <65 | III/IV | Unknown | Unknown | PD |
| FAM83G | insertion | In_Frame_Ins | novel | c.640_641insGCTGCATCATGTTATTTCAGAGCAGCCCATGCC | p.Tyr214delinsCysCysIleMetLeuPheGlnSerSerProCysHis | p.Y214delinsCCIMLFQSSPCH | A6ND36 | protein_coding | TCGA-A2-A0CP-01 | Breast | breast invasive carcinoma | Female | <65 | I/II | Chemotherapy | cytoxan | SD | ||
| FAM83G | SNV | Missense_Mutation | c.932N>C | p.Ser311Thr | p.S311T | A6ND36 | protein_coding | deleterious(0.01) | benign(0.26) | TCGA-EK-A2RJ-01 | Cervix | cervical & endocervical cancer | Female | <65 | I/II | Unknown | Unknown | SD | |
| FAM83G | SNV | Missense_Mutation | novel | c.483N>G | p.Ile161Met | p.I161M | A6ND36 | protein_coding | deleterious(0) | probably_damaging(0.999) | TCGA-VS-A8Q8-01 | Cervix | cervical & endocervical cancer | Female | <65 | I/II | Unknown | Unknown | PD |
| FAM83G | insertion | Frame_Shift_Ins | novel | c.1356_1357insAATATCACTGCTG | p.Ser453AsnfsTer42 | p.S453Nfs*42 | A6ND36 | protein_coding | TCGA-DS-A1OC-01 | Cervix | cervical & endocervical cancer | Female | <65 | I/II | Chemotherapy | gemcitabine | SD | ||
| FAM83G | insertion | Frame_Shift_Ins | novel | c.878_879insTCTCAGA | p.Glu294LeufsTer6 | p.E294Lfs*6 | A6ND36 | protein_coding | TCGA-DS-A1OD-01 | Cervix | cervical & endocervical cancer | Female | <65 | I/II | Chemotherapy | cisplatin | SD | ||
| FAM83G | SNV | Missense_Mutation | novel | c.241C>A | p.Pro81Thr | p.P81T | A6ND36 | protein_coding | tolerated(0.38) | benign(0.171) | TCGA-AA-3877-01 | Colorectum | colon adenocarcinoma | Female | >=65 | I/II | Unknown | Unknown | SD |
| FAM83G | SNV | Missense_Mutation | rs538347250 | c.2378N>T | p.Ser793Leu | p.S793L | A6ND36 | protein_coding | deleterious(0.03) | benign(0.005) | TCGA-AZ-4615-01 | Colorectum | colon adenocarcinoma | Male | >=65 | III/IV | Chemotherapy | xeloda | PD |
| Page: 1 2 3 4 5 6 7 8 |
Top |
Related drugs of malignant transformation related genes |
| Identification of chemicals and drugs interact with genes involved in malignant transfromation |
| (DGIdb 4.0) |
| Entrez ID | Symbol | Category | Interaction Types | Drug Claim Name | Drug Name | PMIDs |
| Page: 1 |

Copyright 2023-Present -The University of Texas Health Science Center at Houston |