
|
|||||
|
 | |
| |
| |
| |
| |
| |
|
Gene: FAM83F |
Gene summary for FAM83F |
| Gene information | Species | Human | Gene symbol | FAM83F | Gene ID | 113828 |
| Gene name | family with sequence similarity 83 member F | |
| Gene Alias | FAM83F | |
| Cytomap | 22q13.1 | |
| Gene Type | protein-coding | GO ID | GO:0007154 | UniProtAcc | Q8NEG4 |
Top |
Malignant transformation analysis |
| Identification of the aberrant gene expression in precancerous and cancerous lesions by comparing the gene expression of stem-like cells in diseased tissues with normal stem cells |
| Entrez ID | Symbol | Replicates | Species | Organ | Tissue | Adj P-value | Log2FC | Malignancy |
| 113828 | FAM83F | LZE2T | Human | Esophagus | ESCC | 2.19e-02 | 2.47e-01 | 0.082 |
| 113828 | FAM83F | LZE4T | Human | Esophagus | ESCC | 8.28e-04 | 4.93e-02 | 0.0811 |
| 113828 | FAM83F | LZE7T | Human | Esophagus | ESCC | 3.76e-04 | 1.53e-01 | 0.0667 |
| 113828 | FAM83F | LZE24T | Human | Esophagus | ESCC | 1.75e-11 | 8.16e-02 | 0.0596 |
| 113828 | FAM83F | LZE21T | Human | Esophagus | ESCC | 5.15e-03 | 1.21e-01 | 0.0655 |
| 113828 | FAM83F | P1T-E | Human | Esophagus | ESCC | 7.83e-04 | 2.52e-01 | 0.0875 |
| 113828 | FAM83F | P2T-E | Human | Esophagus | ESCC | 1.55e-11 | 1.20e-01 | 0.1177 |
| 113828 | FAM83F | P4T-E | Human | Esophagus | ESCC | 3.08e-25 | 5.68e-01 | 0.1323 |
| 113828 | FAM83F | P5T-E | Human | Esophagus | ESCC | 3.69e-06 | 7.57e-02 | 0.1327 |
| 113828 | FAM83F | P8T-E | Human | Esophagus | ESCC | 4.09e-07 | 1.84e-01 | 0.0889 |
| 113828 | FAM83F | P9T-E | Human | Esophagus | ESCC | 3.76e-09 | 1.73e-01 | 0.1131 |
| 113828 | FAM83F | P10T-E | Human | Esophagus | ESCC | 3.15e-03 | 5.42e-02 | 0.116 |
| 113828 | FAM83F | P12T-E | Human | Esophagus | ESCC | 1.29e-03 | 8.87e-02 | 0.1122 |
| 113828 | FAM83F | P15T-E | Human | Esophagus | ESCC | 1.06e-14 | 1.81e-01 | 0.1149 |
| 113828 | FAM83F | P16T-E | Human | Esophagus | ESCC | 3.61e-14 | 5.05e-02 | 0.1153 |
| 113828 | FAM83F | P20T-E | Human | Esophagus | ESCC | 2.21e-11 | 9.81e-02 | 0.1124 |
| 113828 | FAM83F | P21T-E | Human | Esophagus | ESCC | 2.09e-12 | 2.76e-01 | 0.1617 |
| 113828 | FAM83F | P22T-E | Human | Esophagus | ESCC | 5.65e-16 | 2.64e-01 | 0.1236 |
| 113828 | FAM83F | P23T-E | Human | Esophagus | ESCC | 2.08e-16 | 3.83e-01 | 0.108 |
| 113828 | FAM83F | P24T-E | Human | Esophagus | ESCC | 5.80e-08 | 7.53e-02 | 0.1287 |
| Page: 1 2 3 4 |
| Tissue | Expression Dynamics | Abbreviation |
| Esophagus | 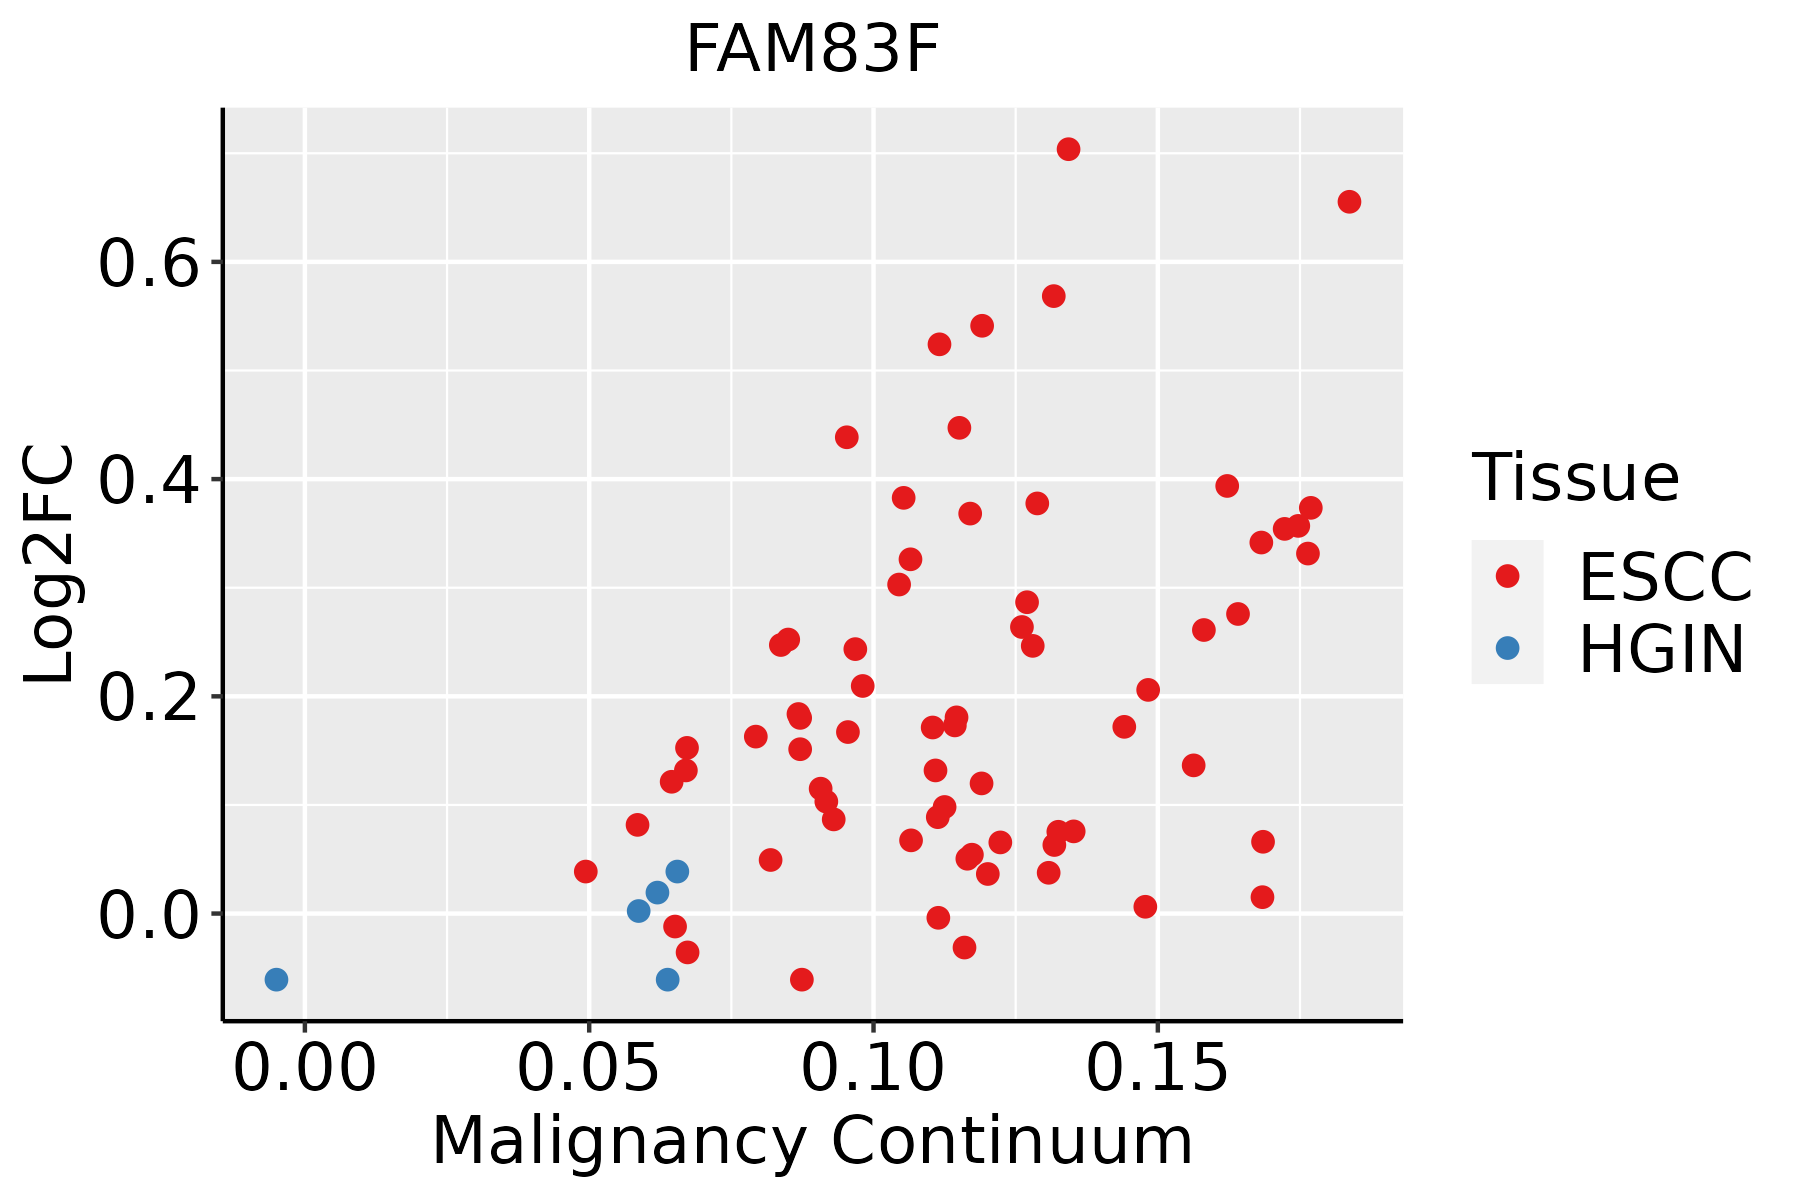 | ESCC: Esophageal squamous cell carcinoma |
| HGIN: High-grade intraepithelial neoplasias | ||
| LGIN: Low-grade intraepithelial neoplasias | ||
| Oral Cavity | 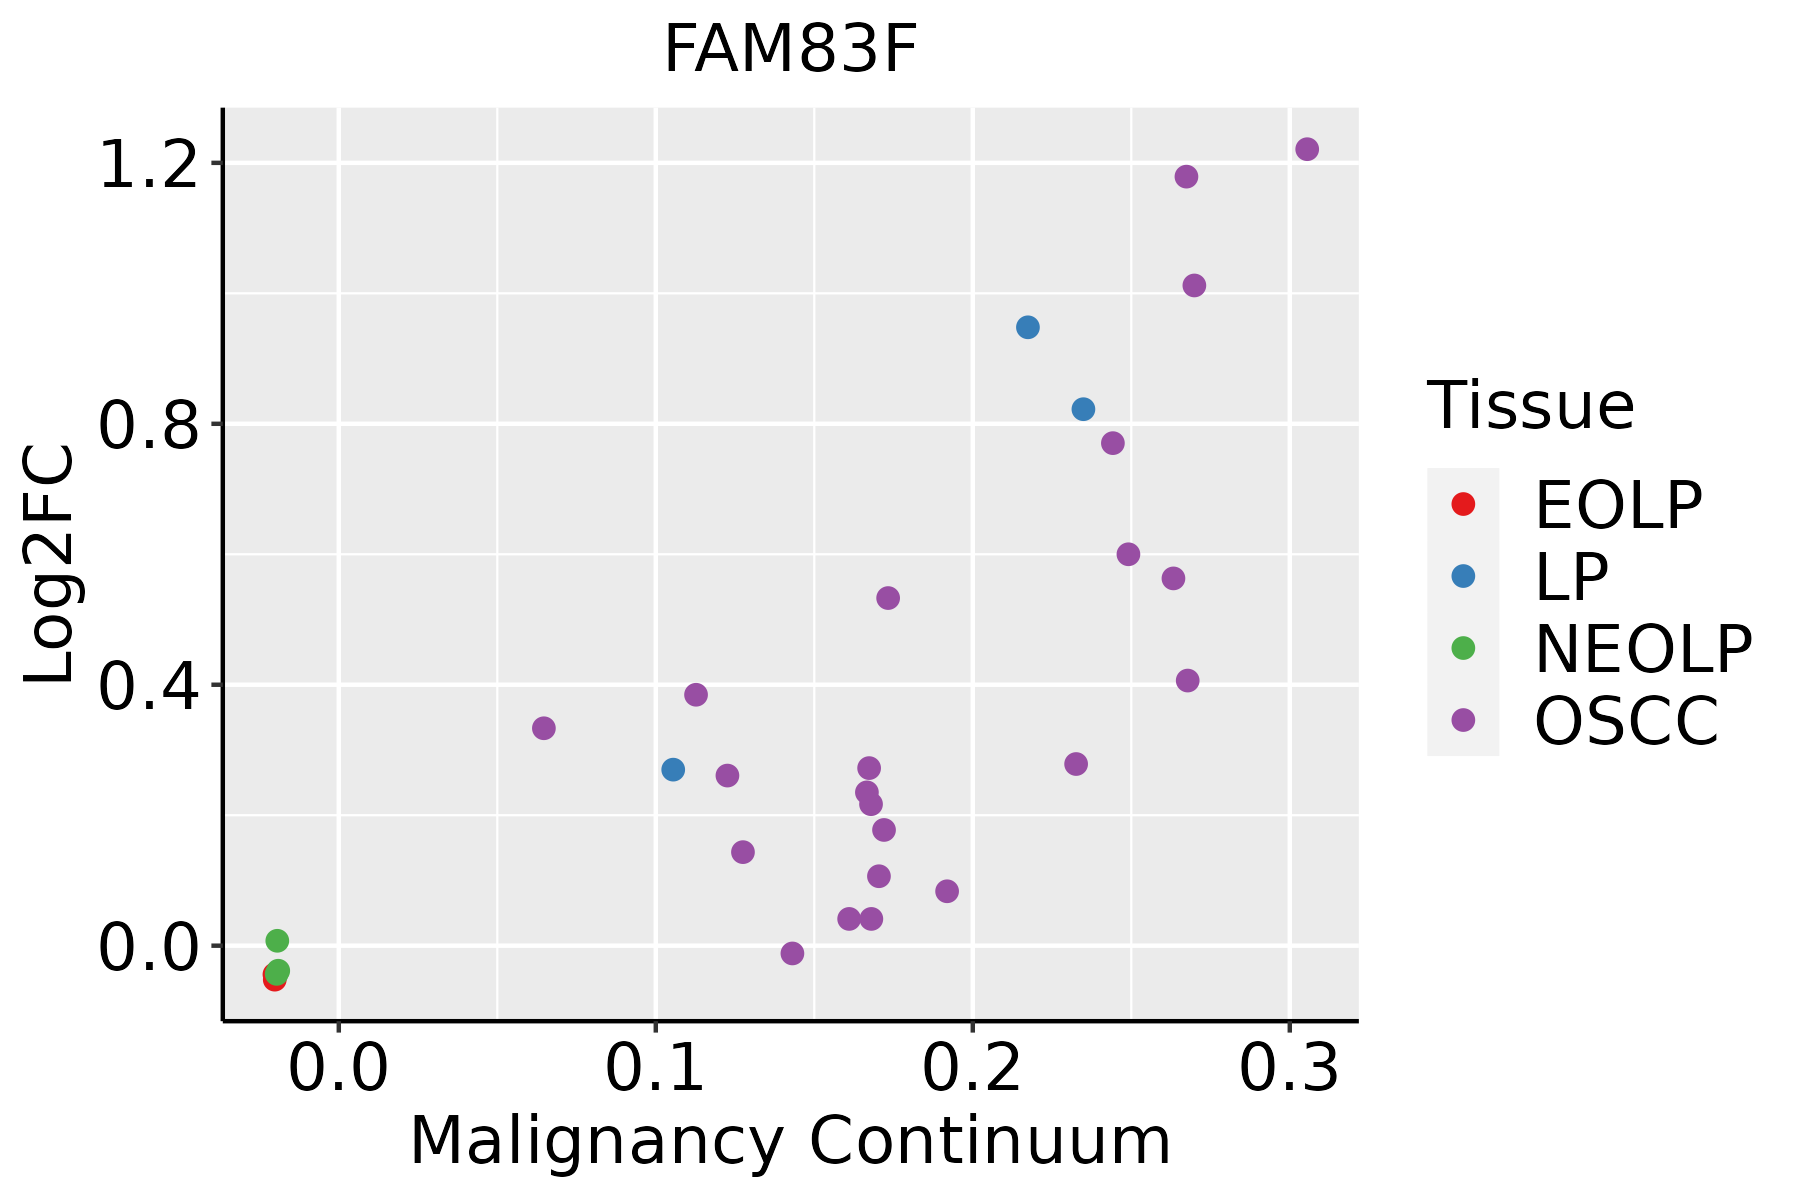 | EOLP: Erosive Oral lichen planus |
| LP: leukoplakia | ||
| NEOLP: Non-erosive oral lichen planus | ||
| OSCC: Oral squamous cell carcinoma | ||
| Skin | 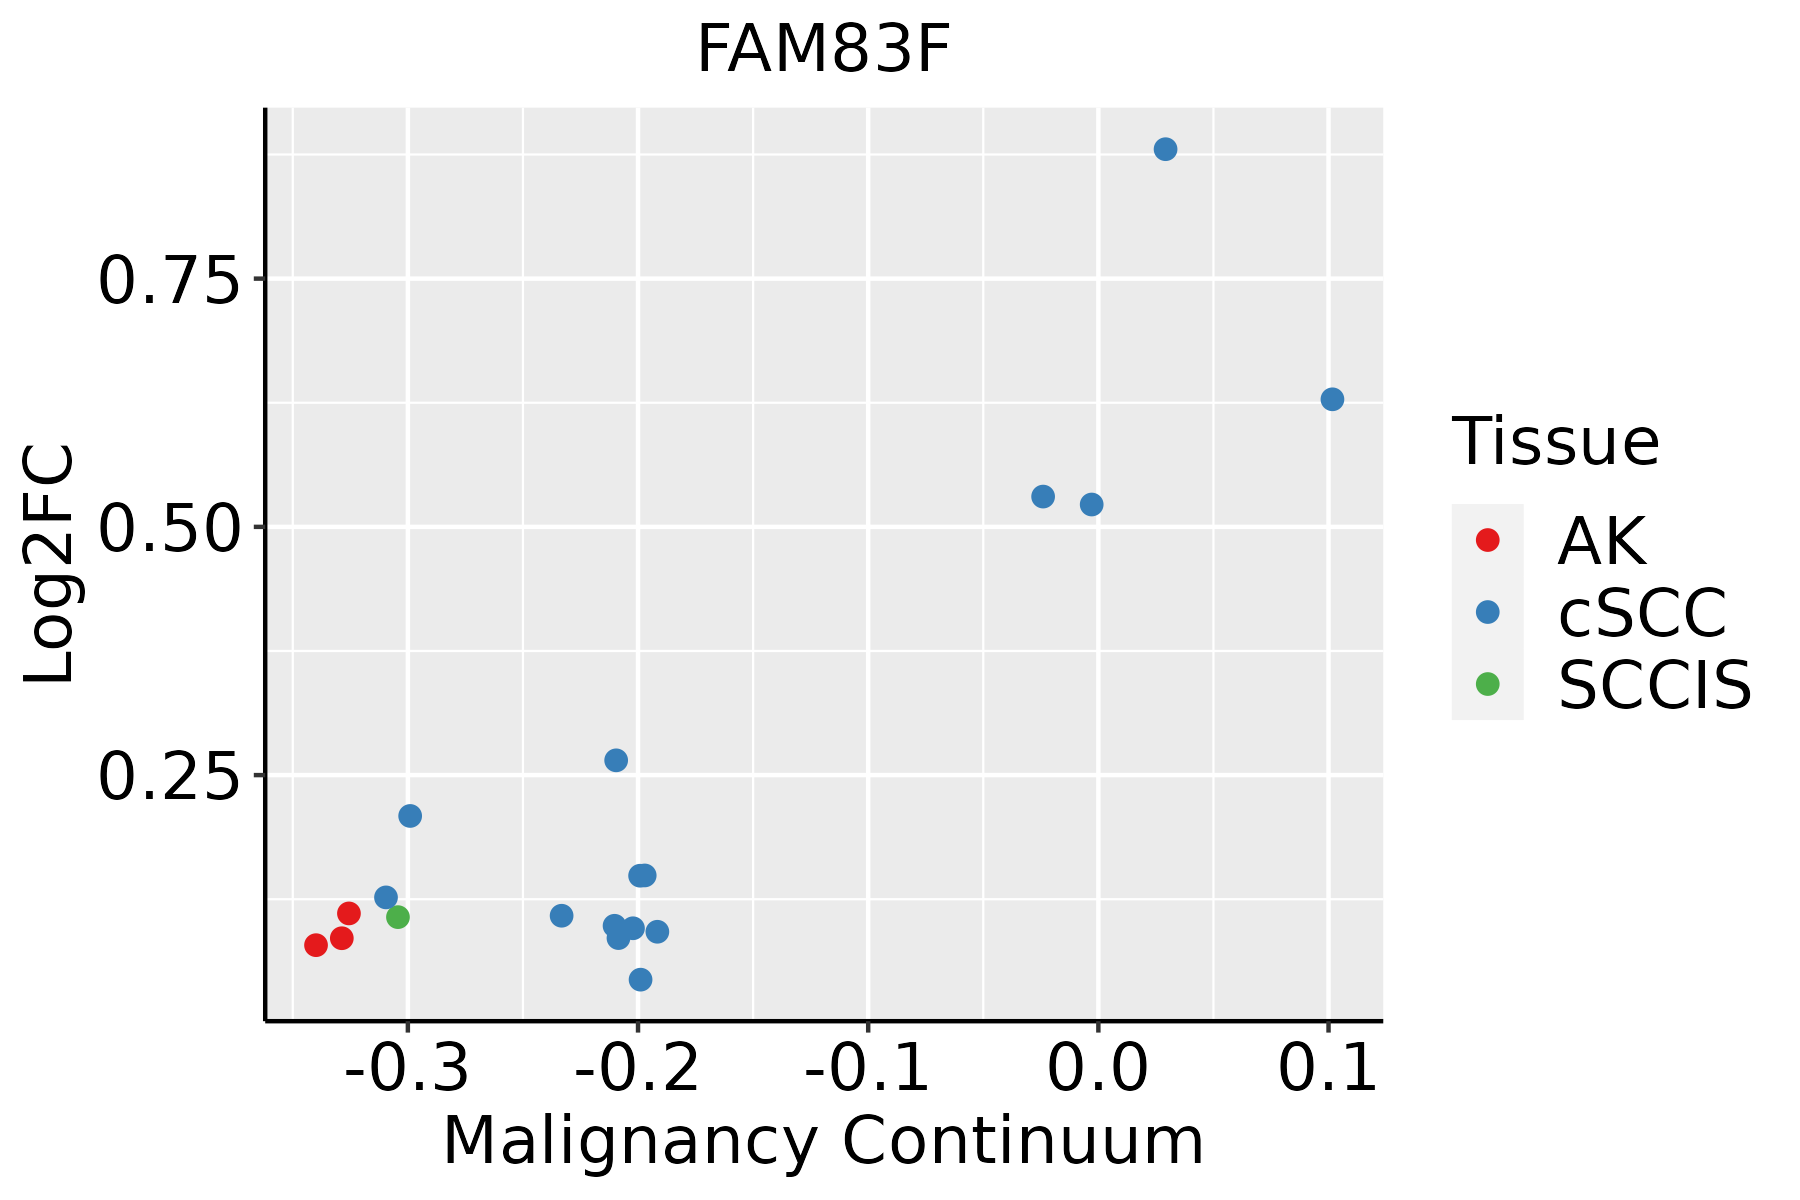 | AK: Actinic keratosis |
| cSCC: Cutaneous squamous cell carcinoma | ||
| SCCIS:squamous cell carcinoma in situ |
| ∗log2FC in expression of this searched gene in stem-like cells from each diseased tissue sample relative to stem-like cells in normal samples in each tissue plotted against the malignancy continuum. Samples are colored based on if they are from different disease stage. |
Top |
Malignant transformation related pathway analysis |
| Find out the enriched GO biological processes and KEGG pathways involved in transition from healthy to precancer to cancer |
| Tissue | Disease Stage | Enriched GO biological Processes |
| Colorectum | AD |  |
| Colorectum | SER |  |
| Colorectum | MSS |  |
| Colorectum | MSI-H |  |
| Colorectum | FAP |  |
| ∗Top 15 enriched GO BP terms are showed in the bar plot of each disease state in each tissue. Each row represents a significant GO biological process which is colored according to the -log10(p.adjust). |
| Page: 1 2 3 4 5 6 7 8 9 |
| GO ID | Tissue | Disease Stage | Description | Gene Ratio | Bg Ratio | pvalue | p.adjust | Count |
| Page: 1 |
| Pathway ID | Tissue | Disease Stage | Description | Gene Ratio | Bg Ratio | pvalue | p.adjust | qvalue | Count |
| Page: 1 |
Top |
Cell-cell communication analysis |
| Identification of potential cell-cell interactions between two cell types and their ligand-receptor pairs for different disease states |
| Ligand | Receptor | LRpair | Pathway | Tissue | Disease Stage |
| Page: 1 |
Top |
Single-cell gene regulatory network inference analysis |
| Find out the significant the regulons (TFs) and the target genes of each regulon across cell types for different disease states |
| TF | Cell Type | Tissue | Disease Stage | Target Gene | RSS | Regulon Activity |
| ∗The dot plots of a searched regulon are shown for all cell subpopulations in each disease state of each tissue based on the regulon specific score inferred using pySCENIC and by calculating the average expression. |
| Page: 1 |
Top |
Somatic mutation of malignant transformation related genes |
| Annotation of somatic variants for genes involved in malignant transformation |
| Hugo Symbol | Variant Class | Variant Classification | dbSNP RS | HGVSc | HGVSp | HGVSp Short | SWISSPROT | BIOTYPE | SIFT | PolyPhen | Tumor Sample Barcode | Tissue | Histology | Sex | Age | Stage | Therapy Types | Drugs | Outcome |
| FAM83F | SNV | Missense_Mutation | c.592N>A | p.Glu198Lys | p.E198K | Q8NEG4 | protein_coding | deleterious(0.04) | benign(0.027) | TCGA-A8-A09Z-01 | Breast | breast invasive carcinoma | Female | >=65 | I/II | Unknown | Unknown | SD | |
| FAM83F | SNV | Missense_Mutation | c.805G>T | p.Asp269Tyr | p.D269Y | Q8NEG4 | protein_coding | deleterious(0) | probably_damaging(0.962) | TCGA-BH-A1FR-01 | Breast | breast invasive carcinoma | Female | >=65 | III/IV | Unknown | Unknown | PD | |
| FAM83F | SNV | Missense_Mutation | c.947C>T | p.Ser316Phe | p.S316F | Q8NEG4 | protein_coding | deleterious(0) | possibly_damaging(0.456) | TCGA-D8-A1XW-01 | Breast | breast invasive carcinoma | Female | <65 | I/II | Chemotherapy | adriamycin+cyclophosphamide | SD | |
| FAM83F | SNV | Missense_Mutation | c.1472N>A | p.Ser491Tyr | p.S491Y | Q8NEG4 | protein_coding | deleterious_low_confidence(0.01) | benign(0.102) | TCGA-E2-A159-01 | Breast | breast invasive carcinoma | Female | <65 | I/II | Chemotherapy | cyclophosphamide | SD | |
| FAM83F | insertion | Frame_Shift_Ins | novel | c.540_541insCCCAAAGAGAAAGGGAGAGAGACAGACAAAAT | p.Ile181ProfsTer32 | p.I181Pfs*32 | Q8NEG4 | protein_coding | TCGA-A8-A07R-01 | Breast | breast invasive carcinoma | Female | >=65 | III/IV | Ancillary | zoledronic | SD | ||
| FAM83F | SNV | Missense_Mutation | rs762810344 | c.497C>A | p.Ala166Asp | p.A166D | Q8NEG4 | protein_coding | deleterious(0) | probably_damaging(1) | TCGA-EA-A410-01 | Cervix | cervical & endocervical cancer | Female | <65 | I/II | Unknown | Unknown | SD |
| FAM83F | SNV | Missense_Mutation | rs567145342 | c.1303G>A | p.Ala435Thr | p.A435T | Q8NEG4 | protein_coding | tolerated_low_confidence(0.07) | benign(0.063) | TCGA-EA-A410-01 | Cervix | cervical & endocervical cancer | Female | <65 | I/II | Unknown | Unknown | SD |
| FAM83F | SNV | Missense_Mutation | c.1085N>T | p.Ala362Val | p.A362V | Q8NEG4 | protein_coding | tolerated(0.09) | benign(0.006) | TCGA-A6-6780-01 | Colorectum | colon adenocarcinoma | Male | >=65 | I/II | Unknown | Unknown | SD | |
| FAM83F | SNV | Missense_Mutation | novel | c.1157N>A | p.Pro386His | p.P386H | Q8NEG4 | protein_coding | deleterious(0) | probably_damaging(0.998) | TCGA-AA-3947-01 | Colorectum | colon adenocarcinoma | Female | <65 | I/II | Unknown | Unknown | SD |
| FAM83F | SNV | Missense_Mutation | c.827N>G | p.Leu276Arg | p.L276R | Q8NEG4 | protein_coding | deleterious(0) | probably_damaging(0.997) | TCGA-AZ-6601-01 | Colorectum | colon adenocarcinoma | Male | >=65 | I/II | Unknown | Unknown | PD |
| Page: 1 2 3 4 5 |
Top |
Related drugs of malignant transformation related genes |
| Identification of chemicals and drugs interact with genes involved in malignant transfromation |
| (DGIdb 4.0) |
| Entrez ID | Symbol | Category | Interaction Types | Drug Claim Name | Drug Name | PMIDs |
| Page: 1 |

Copyright 2023-Present -The University of Texas Health Science Center at Houston |