
|
|||||
|
 | |
| |
| |
| |
| |
| |
|
Gene: FAM83D |
Gene summary for FAM83D |
| Gene information | Species | Human | Gene symbol | FAM83D | Gene ID | 81610 |
| Gene name | family with sequence similarity 83 member D | |
| Gene Alias | C20orf129 | |
| Cytomap | 20q11.23 | |
| Gene Type | protein-coding | GO ID | GO:0000165 | UniProtAcc | Q9H4H8 |
Top |
Malignant transformation analysis |
| Identification of the aberrant gene expression in precancerous and cancerous lesions by comparing the gene expression of stem-like cells in diseased tissues with normal stem cells |
| Entrez ID | Symbol | Replicates | Species | Organ | Tissue | Adj P-value | Log2FC | Malignancy |
| 81610 | FAM83D | LZE4T | Human | Esophagus | ESCC | 2.09e-27 | 1.02e+00 | 0.0811 |
| 81610 | FAM83D | LZE7T | Human | Esophagus | ESCC | 1.69e-04 | 6.23e-01 | 0.0667 |
| 81610 | FAM83D | LZE20T | Human | Esophagus | ESCC | 2.03e-05 | 4.19e-01 | 0.0662 |
| 81610 | FAM83D | LZE22T | Human | Esophagus | ESCC | 6.13e-03 | 6.74e-01 | 0.068 |
| 81610 | FAM83D | LZE24T | Human | Esophagus | ESCC | 1.09e-03 | 3.28e-01 | 0.0596 |
| 81610 | FAM83D | LZE21T | Human | Esophagus | ESCC | 6.24e-03 | 4.26e-01 | 0.0655 |
| 81610 | FAM83D | P1T-E | Human | Esophagus | ESCC | 4.36e-07 | 6.07e-01 | 0.0875 |
| 81610 | FAM83D | P2T-E | Human | Esophagus | ESCC | 1.37e-12 | 7.39e-01 | 0.1177 |
| 81610 | FAM83D | P4T-E | Human | Esophagus | ESCC | 5.09e-38 | 1.20e+00 | 0.1323 |
| 81610 | FAM83D | P5T-E | Human | Esophagus | ESCC | 4.15e-19 | 5.61e-01 | 0.1327 |
| 81610 | FAM83D | P8T-E | Human | Esophagus | ESCC | 5.77e-07 | 3.04e-01 | 0.0889 |
| 81610 | FAM83D | P10T-E | Human | Esophagus | ESCC | 1.72e-21 | 6.75e-01 | 0.116 |
| 81610 | FAM83D | P12T-E | Human | Esophagus | ESCC | 1.85e-56 | 1.63e+00 | 0.1122 |
| 81610 | FAM83D | P15T-E | Human | Esophagus | ESCC | 3.84e-18 | 7.08e-01 | 0.1149 |
| 81610 | FAM83D | P16T-E | Human | Esophagus | ESCC | 2.30e-06 | 3.31e-01 | 0.1153 |
| 81610 | FAM83D | P17T-E | Human | Esophagus | ESCC | 2.26e-04 | 7.71e-01 | 0.1278 |
| 81610 | FAM83D | P20T-E | Human | Esophagus | ESCC | 2.32e-06 | 3.75e-01 | 0.1124 |
| 81610 | FAM83D | P21T-E | Human | Esophagus | ESCC | 4.75e-04 | 3.42e-01 | 0.1617 |
| 81610 | FAM83D | P22T-E | Human | Esophagus | ESCC | 1.79e-45 | 1.18e+00 | 0.1236 |
| 81610 | FAM83D | P23T-E | Human | Esophagus | ESCC | 9.51e-18 | 1.18e+00 | 0.108 |
| Page: 1 2 3 4 |
| Tissue | Expression Dynamics | Abbreviation |
| Esophagus | 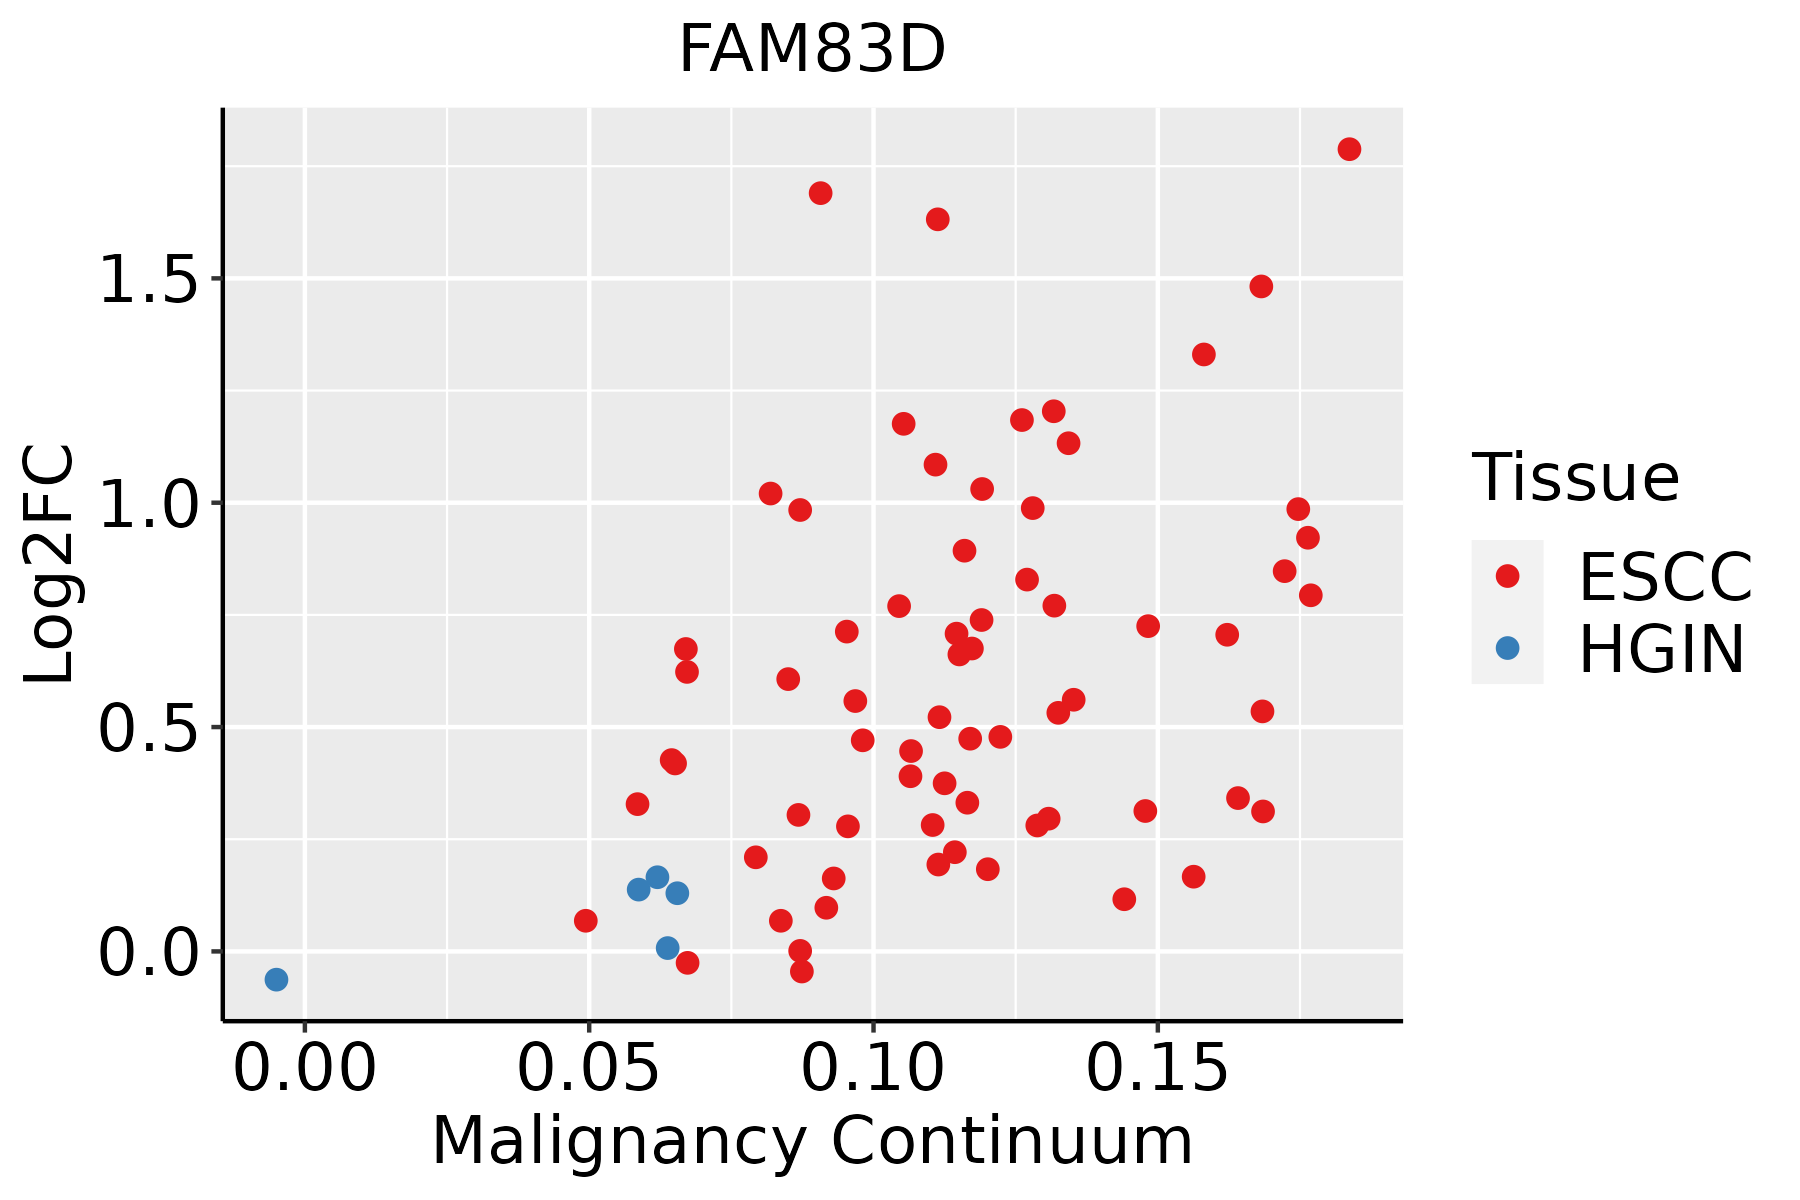 | ESCC: Esophageal squamous cell carcinoma |
| HGIN: High-grade intraepithelial neoplasias | ||
| LGIN: Low-grade intraepithelial neoplasias | ||
| Liver | 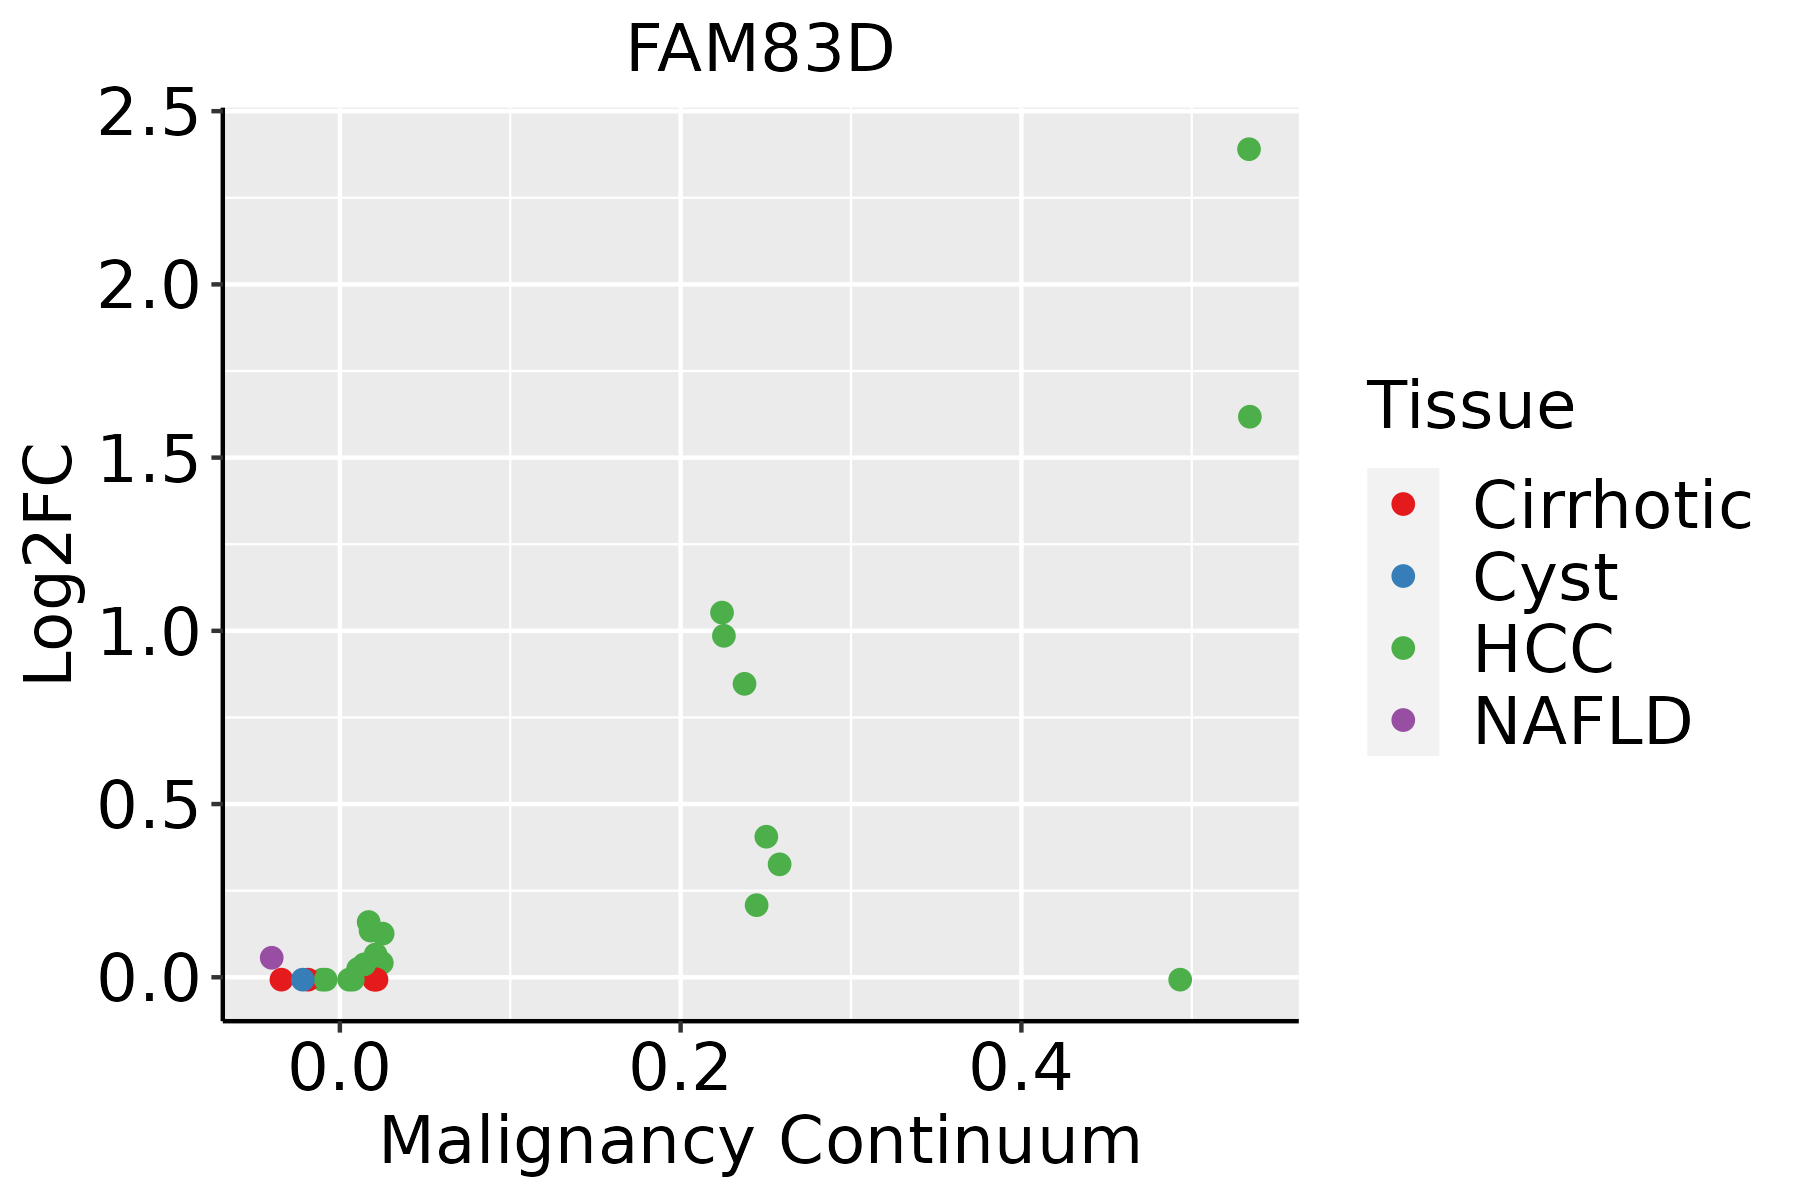 | HCC: Hepatocellular carcinoma |
| NAFLD: Non-alcoholic fatty liver disease | ||
| Oral Cavity | 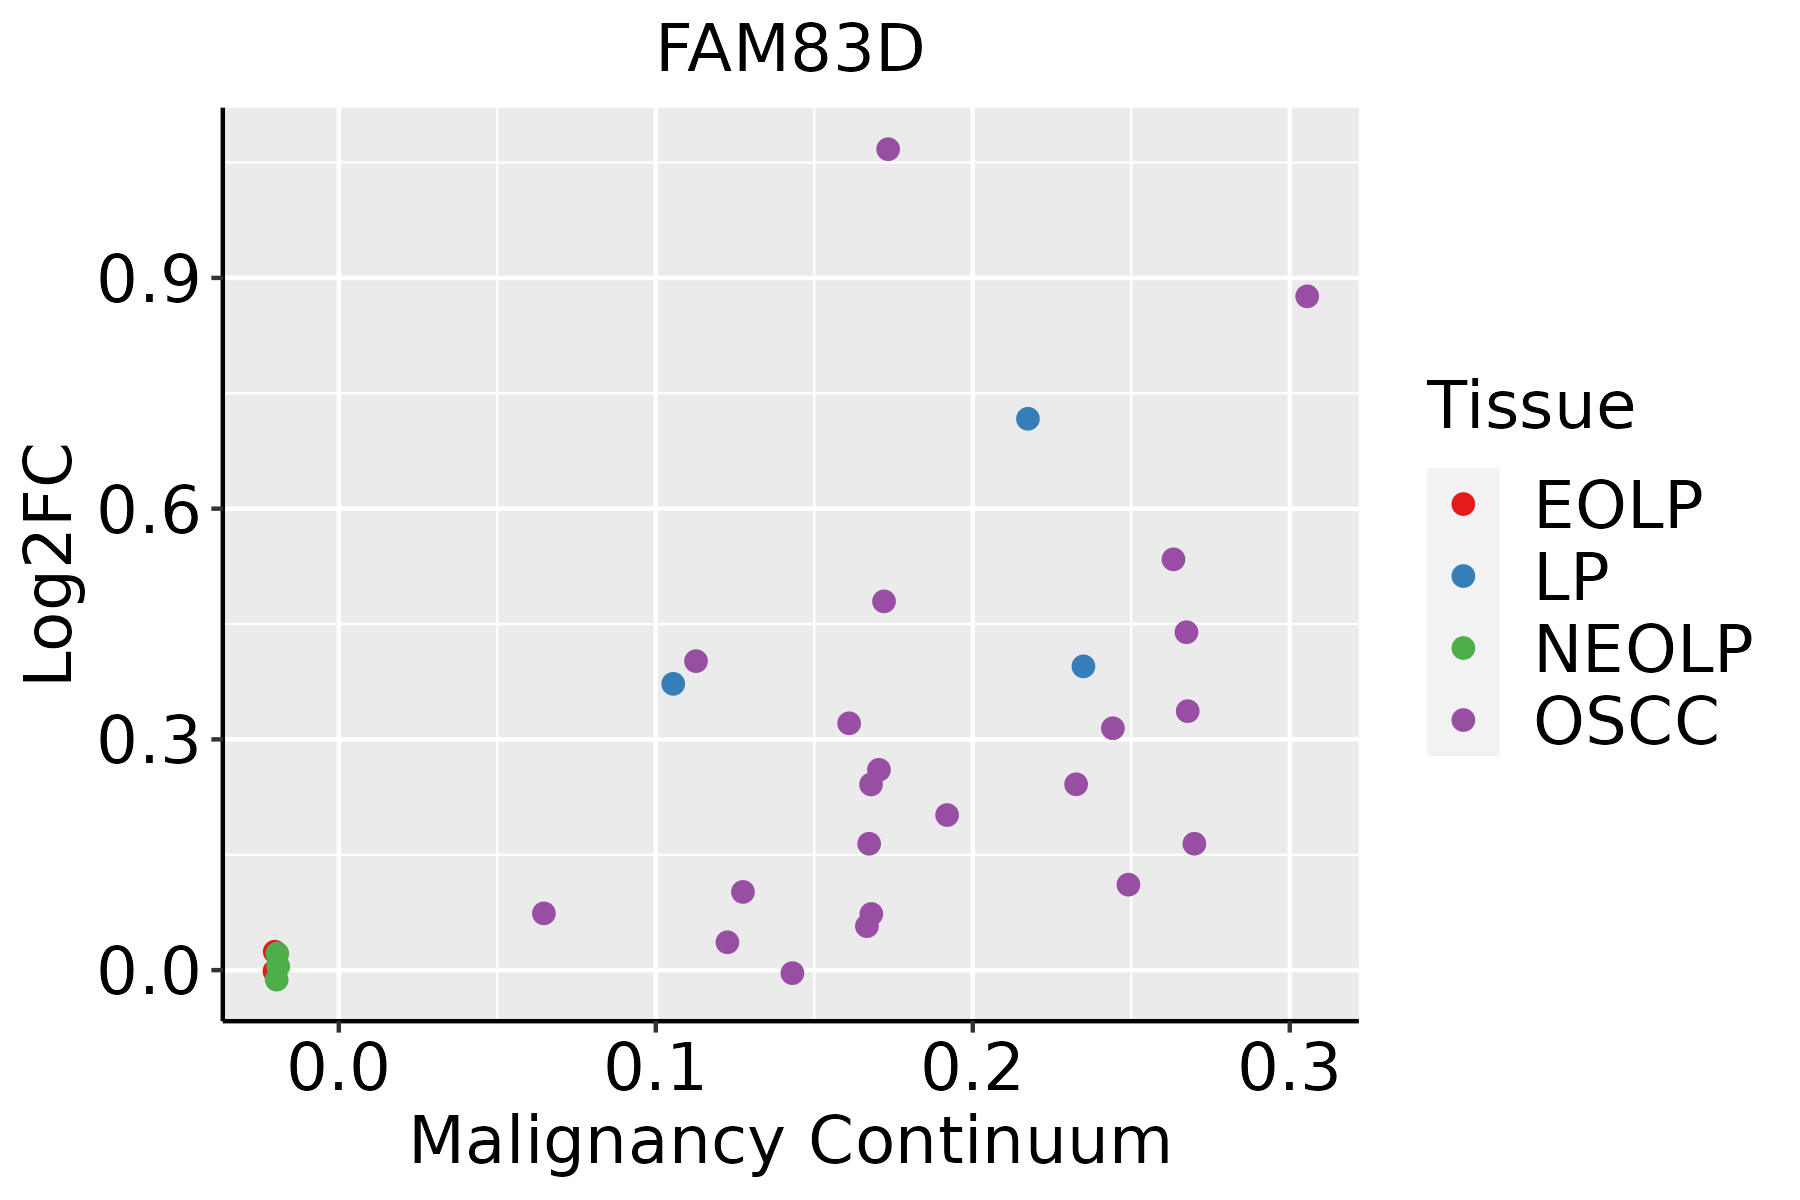 | EOLP: Erosive Oral lichen planus |
| LP: leukoplakia | ||
| NEOLP: Non-erosive oral lichen planus | ||
| OSCC: Oral squamous cell carcinoma | ||
| Skin | 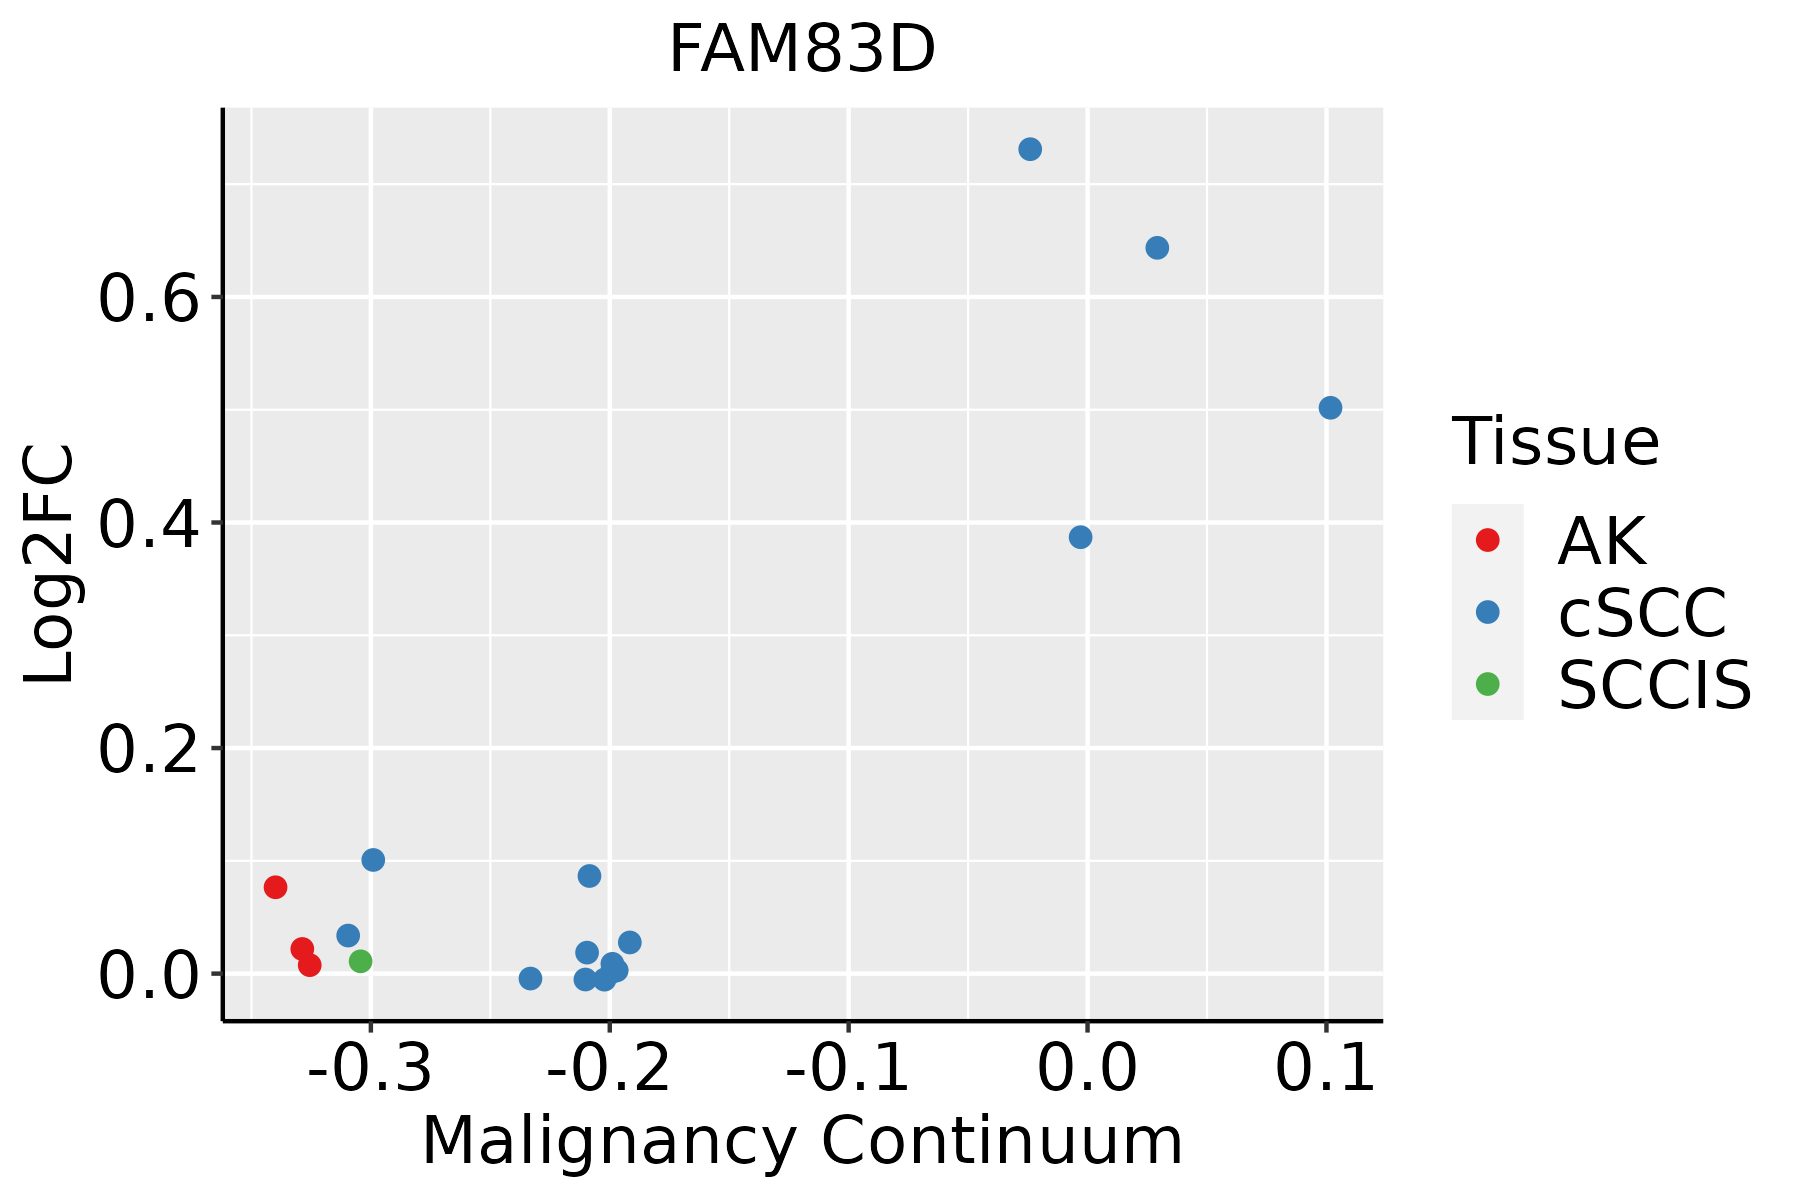 | AK: Actinic keratosis |
| cSCC: Cutaneous squamous cell carcinoma | ||
| SCCIS:squamous cell carcinoma in situ |
| ∗log2FC in expression of this searched gene in stem-like cells from each diseased tissue sample relative to stem-like cells in normal samples in each tissue plotted against the malignancy continuum. Samples are colored based on if they are from different disease stage. |
Top |
Malignant transformation related pathway analysis |
| Find out the enriched GO biological processes and KEGG pathways involved in transition from healthy to precancer to cancer |
| Tissue | Disease Stage | Enriched GO biological Processes |
| Colorectum | AD |  |
| Colorectum | SER |  |
| Colorectum | MSS |  |
| Colorectum | MSI-H |  |
| Colorectum | FAP |  |
| ∗Top 15 enriched GO BP terms are showed in the bar plot of each disease state in each tissue. Each row represents a significant GO biological process which is colored according to the -log10(p.adjust). |
| Page: 1 2 3 4 5 6 7 8 9 |
| GO ID | Tissue | Disease Stage | Description | Gene Ratio | Bg Ratio | pvalue | p.adjust | Count |
| GO:0042176111 | Esophagus | ESCC | regulation of protein catabolic process | 280/8552 | 391/18723 | 8.65e-26 | 2.39e-23 | 280 |
| GO:005165617 | Esophagus | ESCC | establishment of organelle localization | 273/8552 | 390/18723 | 9.13e-23 | 1.81e-20 | 273 |
| GO:000705911 | Esophagus | ESCC | chromosome segregation | 238/8552 | 346/18723 | 1.72e-18 | 1.82e-16 | 238 |
| GO:005131011 | Esophagus | ESCC | metaphase plate congression | 58/8552 | 65/18723 | 1.81e-13 | 8.63e-12 | 58 |
| GO:00988133 | Esophagus | ESCC | nuclear chromosome segregation | 187/8552 | 281/18723 | 1.00e-12 | 4.36e-11 | 187 |
| GO:005130311 | Esophagus | ESCC | establishment of chromosome localization | 67/8552 | 80/18723 | 1.92e-12 | 8.09e-11 | 67 |
| GO:005000011 | Esophagus | ESCC | chromosome localization | 68/8552 | 82/18723 | 3.37e-12 | 1.32e-10 | 68 |
| GO:190198713 | Esophagus | ESCC | regulation of cell cycle phase transition | 242/8552 | 390/18723 | 3.86e-11 | 1.26e-09 | 242 |
| GO:004578710 | Esophagus | ESCC | positive regulation of cell cycle | 196/8552 | 313/18723 | 9.27e-10 | 2.24e-08 | 196 |
| GO:00726985 | Esophagus | ESCC | protein localization to microtubule cytoskeleton | 43/8552 | 54/18723 | 3.28e-07 | 4.61e-06 | 43 |
| GO:004484314 | Esophagus | ESCC | cell cycle G1/S phase transition | 148/8552 | 241/18723 | 5.68e-07 | 7.48e-06 | 148 |
| GO:00443804 | Esophagus | ESCC | protein localization to cytoskeleton | 45/8552 | 58/18723 | 6.89e-07 | 8.99e-06 | 45 |
| GO:19019896 | Esophagus | ESCC | positive regulation of cell cycle phase transition | 77/8552 | 115/18723 | 3.20e-06 | 3.58e-05 | 77 |
| GO:00900689 | Esophagus | ESCC | positive regulation of cell cycle process | 142/8552 | 236/18723 | 4.79e-06 | 5.08e-05 | 142 |
| GO:00319294 | Esophagus | ESCC | TOR signaling | 79/8552 | 126/18723 | 8.57e-05 | 6.21e-04 | 79 |
| GO:00018378 | Esophagus | ESCC | epithelial to mesenchymal transition | 95/8552 | 157/18723 | 1.25e-04 | 8.56e-04 | 95 |
| GO:00487628 | Esophagus | ESCC | mesenchymal cell differentiation | 133/8552 | 236/18723 | 5.94e-04 | 3.22e-03 | 133 |
| GO:00320061 | Esophagus | ESCC | regulation of TOR signaling | 63/8552 | 104/18723 | 1.55e-03 | 7.29e-03 | 63 |
| GO:190280613 | Esophagus | ESCC | regulation of cell cycle G1/S phase transition | 95/8552 | 168/18723 | 2.91e-03 | 1.22e-02 | 95 |
| GO:00604856 | Esophagus | ESCC | mesenchyme development | 156/8552 | 291/18723 | 3.76e-03 | 1.53e-02 | 156 |
| Page: 1 2 3 4 5 |
| Pathway ID | Tissue | Disease Stage | Description | Gene Ratio | Bg Ratio | pvalue | p.adjust | qvalue | Count |
| Page: 1 |
Top |
Cell-cell communication analysis |
| Identification of potential cell-cell interactions between two cell types and their ligand-receptor pairs for different disease states |
| Ligand | Receptor | LRpair | Pathway | Tissue | Disease Stage |
| Page: 1 |
Top |
Single-cell gene regulatory network inference analysis |
| Find out the significant the regulons (TFs) and the target genes of each regulon across cell types for different disease states |
| TF | Cell Type | Tissue | Disease Stage | Target Gene | RSS | Regulon Activity |
| ∗The dot plots of a searched regulon are shown for all cell subpopulations in each disease state of each tissue based on the regulon specific score inferred using pySCENIC and by calculating the average expression. |
| Page: 1 |
Top |
Somatic mutation of malignant transformation related genes |
| Annotation of somatic variants for genes involved in malignant transformation |
| Hugo Symbol | Variant Class | Variant Classification | dbSNP RS | HGVSc | HGVSp | HGVSp Short | SWISSPROT | BIOTYPE | SIFT | PolyPhen | Tumor Sample Barcode | Tissue | Histology | Sex | Age | Stage | Therapy Types | Drugs | Outcome |
| FAM83D | insertion | Nonsense_Mutation | novel | c.1385_1386insCAGTTTTTAAAAACTCTGAGGCAAGG | p.Pro463SerfsTer3 | p.P463Sfs*3 | Q9H4H8 | protein_coding | TCGA-B6-A0IB-01 | Breast | breast invasive carcinoma | Female | <65 | III/IV | Unknown | Unknown | PD | ||
| FAM83D | SNV | Missense_Mutation | rs373299326 | c.992N>A | p.Arg331Gln | p.R331Q | Q9H4H8 | protein_coding | deleterious(0.02) | possibly_damaging(0.462) | TCGA-2W-A8YY-01 | Cervix | cervical & endocervical cancer | Female | <65 | I/II | Chemotherapy | cisplatin | CR |
| FAM83D | SNV | Missense_Mutation | novel | c.1281N>T | p.Arg427Ser | p.R427S | Q9H4H8 | protein_coding | deleterious(0) | possibly_damaging(0.456) | TCGA-2W-A8YY-01 | Cervix | cervical & endocervical cancer | Female | <65 | I/II | Chemotherapy | cisplatin | CR |
| FAM83D | SNV | Missense_Mutation | c.1522N>T | p.Pro508Ser | p.P508S | Q9H4H8 | protein_coding | tolerated(0.24) | benign(0.003) | TCGA-IR-A3LA-01 | Cervix | cervical & endocervical cancer | Female | <65 | I/II | Chemotherapy | cisplatin | CR | |
| FAM83D | SNV | Missense_Mutation | c.620N>C | p.Met207Thr | p.M207T | Q9H4H8 | protein_coding | tolerated(0.54) | benign(0.161) | TCGA-AA-3492-01 | Colorectum | colon adenocarcinoma | Female | >=65 | I/II | Unknown | Unknown | SD | |
| FAM83D | SNV | Missense_Mutation | c.853C>A | p.Leu285Met | p.L285M | Q9H4H8 | protein_coding | deleterious(0.03) | probably_damaging(0.992) | TCGA-AA-3710-01 | Colorectum | colon adenocarcinoma | Female | >=65 | I/II | Unknown | Unknown | SD | |
| FAM83D | SNV | Missense_Mutation | c.1067N>T | p.Ala356Val | p.A356V | Q9H4H8 | protein_coding | tolerated(0.19) | benign(0.084) | TCGA-AA-3864-01 | Colorectum | colon adenocarcinoma | Male | >=65 | I/II | Unknown | Unknown | SD | |
| FAM83D | SNV | Missense_Mutation | c.727G>A | p.Glu243Lys | p.E243K | Q9H4H8 | protein_coding | deleterious(0.01) | possibly_damaging(0.771) | TCGA-AA-3984-01 | Colorectum | colon adenocarcinoma | Female | <65 | I/II | Unknown | Unknown | SD | |
| FAM83D | SNV | Missense_Mutation | novel | c.827N>T | p.Ser276Phe | p.S276F | Q9H4H8 | protein_coding | deleterious(0) | probably_damaging(1) | TCGA-AA-A00O-01 | Colorectum | colon adenocarcinoma | Female | >=65 | III/IV | Unknown | Unknown | SD |
| FAM83D | SNV | Missense_Mutation | rs748109756 | c.794G>A | p.Gly265Asp | p.G265D | Q9H4H8 | protein_coding | deleterious(0.01) | probably_damaging(1) | TCGA-AA-A010-01 | Colorectum | colon adenocarcinoma | Female | <65 | I/II | Chemotherapy | folinic | CR |
| Page: 1 2 3 4 5 6 |
Top |
Related drugs of malignant transformation related genes |
| Identification of chemicals and drugs interact with genes involved in malignant transfromation |
| (DGIdb 4.0) |
| Entrez ID | Symbol | Category | Interaction Types | Drug Claim Name | Drug Name | PMIDs |
| Page: 1 |

Copyright 2023-Present -The University of Texas Health Science Center at Houston |