
|
|||||
|
 | |
| |
| |
| |
| |
| |
|
Gene: FAM83C |
Gene summary for FAM83C |
| Gene information | Species | Human | Gene symbol | FAM83C | Gene ID | 128876 |
| Gene name | family with sequence similarity 83 member C | |
| Gene Alias | C20orf128 | |
| Cytomap | 20q11.22 | |
| Gene Type | protein-coding | GO ID | GO:0007154 | UniProtAcc | Q9BQN1 |
Top |
Malignant transformation analysis |
| Identification of the aberrant gene expression in precancerous and cancerous lesions by comparing the gene expression of stem-like cells in diseased tissues with normal stem cells |
| Entrez ID | Symbol | Replicates | Species | Organ | Tissue | Adj P-value | Log2FC | Malignancy |
| 128876 | FAM83C | LZE24T | Human | Esophagus | ESCC | 5.22e-05 | 5.28e-01 | 0.0596 |
| 128876 | FAM83C | P1T-E | Human | Esophagus | ESCC | 5.85e-06 | 1.34e-01 | 0.0875 |
| 128876 | FAM83C | P4T-E | Human | Esophagus | ESCC | 3.35e-08 | 7.13e-02 | 0.1323 |
| 128876 | FAM83C | P5T-E | Human | Esophagus | ESCC | 1.78e-03 | -2.14e-01 | 0.1327 |
| 128876 | FAM83C | P8T-E | Human | Esophagus | ESCC | 9.79e-07 | -1.10e-01 | 0.0889 |
| 128876 | FAM83C | P9T-E | Human | Esophagus | ESCC | 2.75e-13 | -1.21e-02 | 0.1131 |
| 128876 | FAM83C | P12T-E | Human | Esophagus | ESCC | 3.84e-08 | -1.13e-01 | 0.1122 |
| 128876 | FAM83C | P15T-E | Human | Esophagus | ESCC | 2.28e-05 | -1.03e-01 | 0.1149 |
| 128876 | FAM83C | P16T-E | Human | Esophagus | ESCC | 3.75e-03 | -2.14e-01 | 0.1153 |
| 128876 | FAM83C | P20T-E | Human | Esophagus | ESCC | 2.03e-06 | 9.94e-02 | 0.1124 |
| 128876 | FAM83C | P21T-E | Human | Esophagus | ESCC | 5.78e-16 | 4.33e-01 | 0.1617 |
| 128876 | FAM83C | P22T-E | Human | Esophagus | ESCC | 4.11e-07 | -1.25e-01 | 0.1236 |
| 128876 | FAM83C | P23T-E | Human | Esophagus | ESCC | 8.86e-11 | 1.42e-02 | 0.108 |
| 128876 | FAM83C | P24T-E | Human | Esophagus | ESCC | 3.80e-05 | -1.67e-01 | 0.1287 |
| 128876 | FAM83C | P27T-E | Human | Esophagus | ESCC | 3.84e-10 | -7.71e-03 | 0.1055 |
| 128876 | FAM83C | P28T-E | Human | Esophagus | ESCC | 7.40e-06 | 4.97e-02 | 0.1149 |
| 128876 | FAM83C | P30T-E | Human | Esophagus | ESCC | 1.90e-04 | -6.67e-02 | 0.137 |
| 128876 | FAM83C | P31T-E | Human | Esophagus | ESCC | 9.34e-06 | -2.57e-02 | 0.1251 |
| 128876 | FAM83C | P32T-E | Human | Esophagus | ESCC | 3.78e-02 | -2.10e-01 | 0.1666 |
| 128876 | FAM83C | P37T-E | Human | Esophagus | ESCC | 1.42e-02 | -2.08e-01 | 0.1371 |
| Page: 1 2 3 |
| Tissue | Expression Dynamics | Abbreviation |
| Esophagus |  | ESCC: Esophageal squamous cell carcinoma |
| HGIN: High-grade intraepithelial neoplasias | ||
| LGIN: Low-grade intraepithelial neoplasias | ||
| Oral Cavity | 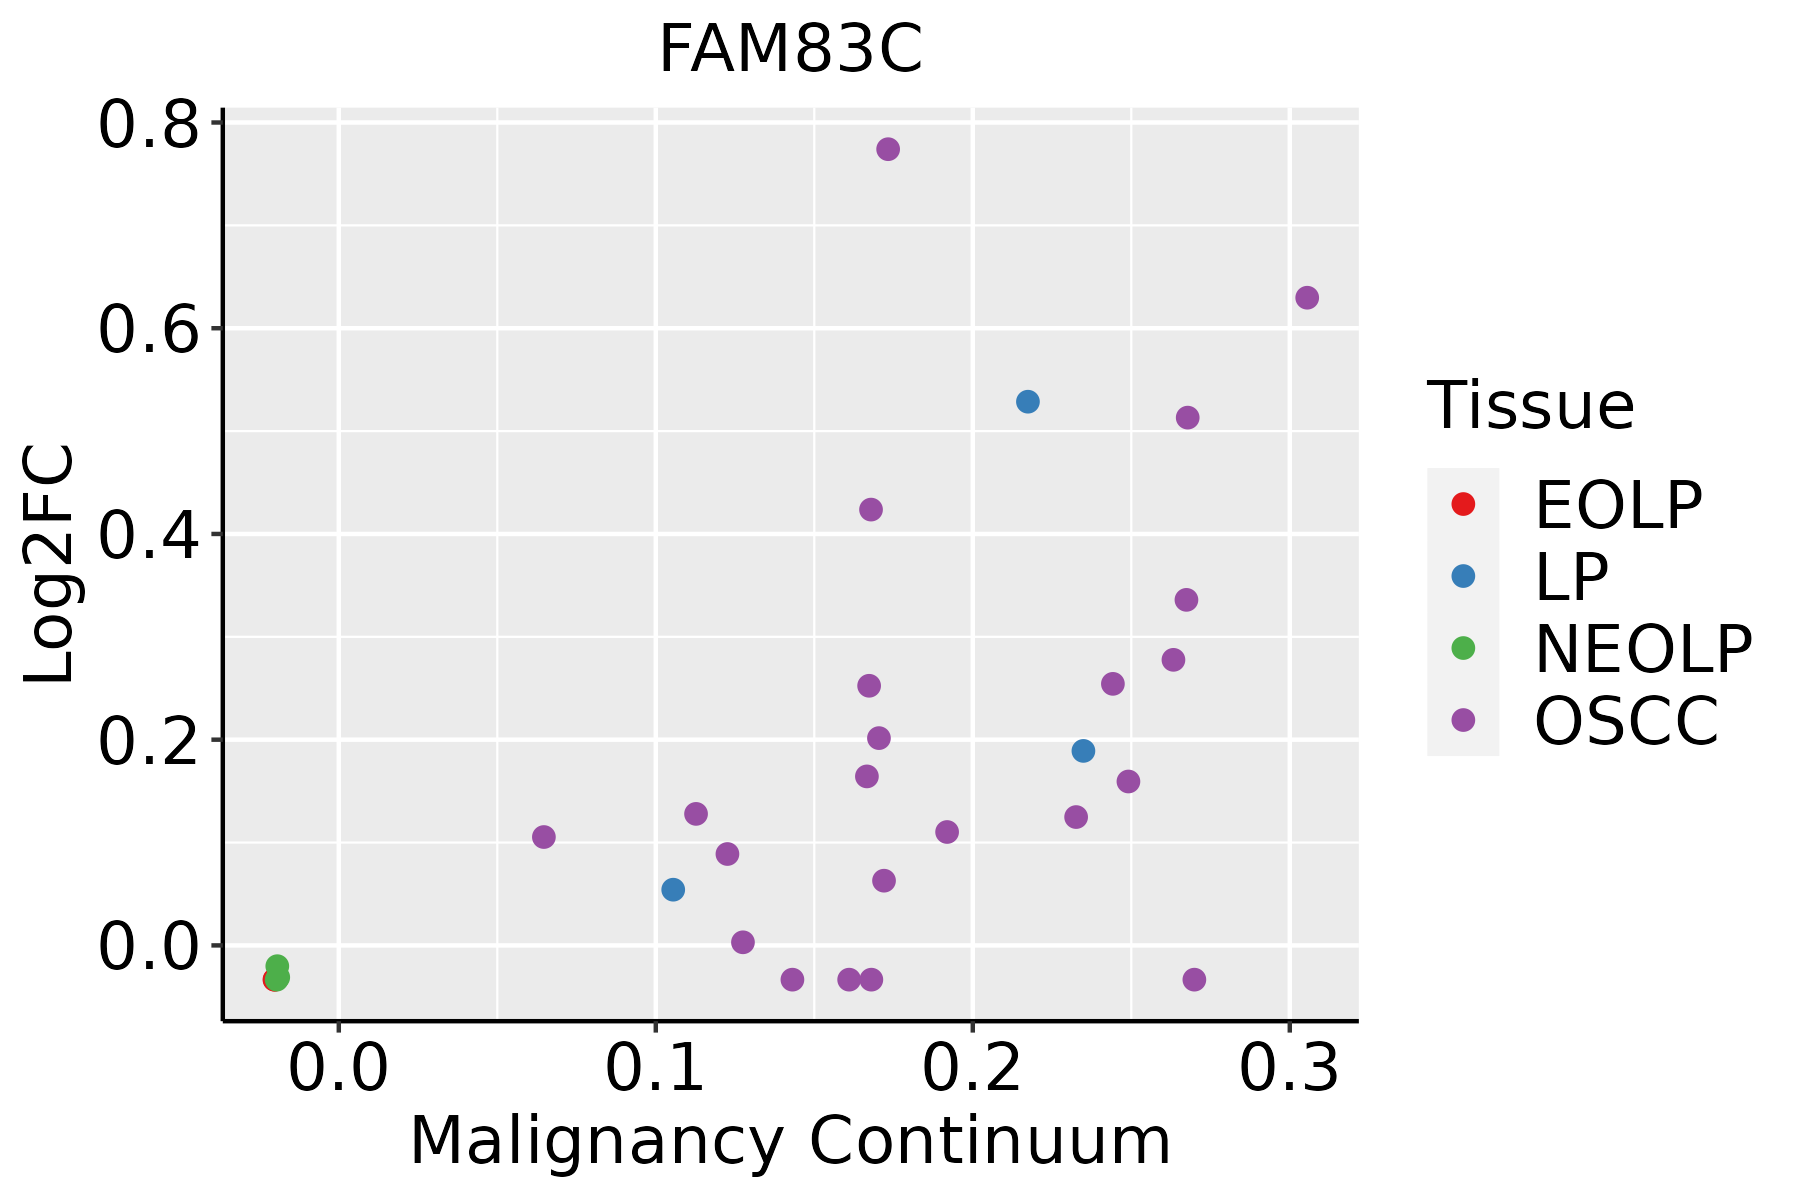 | EOLP: Erosive Oral lichen planus |
| LP: leukoplakia | ||
| NEOLP: Non-erosive oral lichen planus | ||
| OSCC: Oral squamous cell carcinoma |
| ∗log2FC in expression of this searched gene in stem-like cells from each diseased tissue sample relative to stem-like cells in normal samples in each tissue plotted against the malignancy continuum. Samples are colored based on if they are from different disease stage. |
Top |
Malignant transformation related pathway analysis |
| Find out the enriched GO biological processes and KEGG pathways involved in transition from healthy to precancer to cancer |
| Tissue | Disease Stage | Enriched GO biological Processes |
| Colorectum | AD |  |
| Colorectum | SER |  |
| Colorectum | MSS |  |
| Colorectum | MSI-H |  |
| Colorectum | FAP |  |
| ∗Top 15 enriched GO BP terms are showed in the bar plot of each disease state in each tissue. Each row represents a significant GO biological process which is colored according to the -log10(p.adjust). |
| Page: 1 2 3 4 5 6 7 8 9 |
| GO ID | Tissue | Disease Stage | Description | Gene Ratio | Bg Ratio | pvalue | p.adjust | Count |
| Page: 1 |
| Pathway ID | Tissue | Disease Stage | Description | Gene Ratio | Bg Ratio | pvalue | p.adjust | qvalue | Count |
| Page: 1 |
Top |
Cell-cell communication analysis |
| Identification of potential cell-cell interactions between two cell types and their ligand-receptor pairs for different disease states |
| Ligand | Receptor | LRpair | Pathway | Tissue | Disease Stage |
| Page: 1 |
Top |
Single-cell gene regulatory network inference analysis |
| Find out the significant the regulons (TFs) and the target genes of each regulon across cell types for different disease states |
| TF | Cell Type | Tissue | Disease Stage | Target Gene | RSS | Regulon Activity |
| ∗The dot plots of a searched regulon are shown for all cell subpopulations in each disease state of each tissue based on the regulon specific score inferred using pySCENIC and by calculating the average expression. |
| Page: 1 |
Top |
Somatic mutation of malignant transformation related genes |
| Annotation of somatic variants for genes involved in malignant transformation |
| Hugo Symbol | Variant Class | Variant Classification | dbSNP RS | HGVSc | HGVSp | HGVSp Short | SWISSPROT | BIOTYPE | SIFT | PolyPhen | Tumor Sample Barcode | Tissue | Histology | Sex | Age | Stage | Therapy Types | Drugs | Outcome |
| FAM83C | SNV | Missense_Mutation | rs149089081 | c.512N>T | p.Thr171Met | p.T171M | Q9BQN1 | protein_coding | deleterious(0.03) | benign(0.092) | TCGA-A7-A6VV-01 | Breast | breast invasive carcinoma | Female | <65 | I/II | Chemotherapy | cyclophosphamide | CR |
| FAM83C | SNV | Missense_Mutation | rs374408772 | c.967N>T | p.Arg323Cys | p.R323C | Q9BQN1 | protein_coding | tolerated(0.09) | benign(0) | TCGA-AC-A4ZE-01 | Breast | breast invasive carcinoma | Female | <65 | I/II | Unknown | Unknown | SD |
| FAM83C | SNV | Missense_Mutation | c.1414N>A | p.Gly472Arg | p.G472R | Q9BQN1 | protein_coding | deleterious_low_confidence(0.04) | benign(0.001) | TCGA-BH-A0HF-01 | Breast | breast invasive carcinoma | Female | >=65 | I/II | Hormone Therapy | arimidex | SD | |
| FAM83C | SNV | Missense_Mutation | novel | c.1710G>T | p.Leu570Phe | p.L570F | Q9BQN1 | protein_coding | deleterious_low_confidence(0) | benign(0) | TCGA-OL-A6VQ-01 | Breast | breast invasive carcinoma | Female | <65 | I/II | Unknown | Unknown | SD |
| FAM83C | insertion | Frame_Shift_Ins | novel | c.405_406insGGTGTCAGGGACT | p.Pro136GlyfsTer51 | p.P136Gfs*51 | Q9BQN1 | protein_coding | TCGA-AO-A0JD-01 | Breast | breast invasive carcinoma | Female | <65 | III/IV | Chemotherapy | cyclophosphamide | SD | ||
| FAM83C | SNV | Missense_Mutation | c.277G>C | p.Glu93Gln | p.E93Q | Q9BQN1 | protein_coding | deleterious(0.04) | possibly_damaging(0.469) | TCGA-C5-A2LZ-01 | Cervix | cervical & endocervical cancer | Female | >=65 | III/IV | Unknown | Unknown | PD | |
| FAM83C | SNV | Missense_Mutation | novel | c.253N>C | p.Val85Leu | p.V85L | Q9BQN1 | protein_coding | tolerated(0.17) | benign(0.138) | TCGA-HM-A4S6-01 | Cervix | cervical & endocervical cancer | Female | <65 | III/IV | Chemotherapy | cisplatin | CR |
| FAM83C | SNV | Missense_Mutation | rs373959129 | c.1093N>G | p.Leu365Val | p.L365V | Q9BQN1 | protein_coding | tolerated_low_confidence(0.06) | benign(0.11) | TCGA-LP-A4AV-01 | Cervix | cervical & endocervical cancer | Female | <65 | I/II | Unknown | Unknown | SD |
| FAM83C | SNV | Missense_Mutation | novel | c.1053N>G | p.Ile351Met | p.I351M | Q9BQN1 | protein_coding | deleterious(0.01) | benign(0.219) | TCGA-VS-A94Z-01 | Cervix | cervical & endocervical cancer | Female | <65 | I/II | Chemotherapy | cisplatin | CR |
| FAM83C | SNV | Missense_Mutation | c.1201C>T | p.Pro401Ser | p.P401S | Q9BQN1 | protein_coding | tolerated_low_confidence(0.13) | benign(0.234) | TCGA-AA-3833-01 | Colorectum | colon adenocarcinoma | Female | <65 | I/II | Unknown | Unknown | SD |
| Page: 1 2 3 4 5 6 7 8 9 |
Top |
Related drugs of malignant transformation related genes |
| Identification of chemicals and drugs interact with genes involved in malignant transfromation |
| (DGIdb 4.0) |
| Entrez ID | Symbol | Category | Interaction Types | Drug Claim Name | Drug Name | PMIDs |
| Page: 1 |

Copyright 2023-Present -The University of Texas Health Science Center at Houston |