
|
|||||
|
 | |
| |
| |
| |
| |
| |
|
Gene: FAM83B |
Gene summary for FAM83B |
| Gene information | Species | Human | Gene symbol | FAM83B | Gene ID | 222584 |
| Gene name | family with sequence similarity 83 member B | |
| Gene Alias | C6orf143 | |
| Cytomap | 6p12.1 | |
| Gene Type | protein-coding | GO ID | GO:0007154 | UniProtAcc | Q5T0W9 |
Top |
Malignant transformation analysis |
| Identification of the aberrant gene expression in precancerous and cancerous lesions by comparing the gene expression of stem-like cells in diseased tissues with normal stem cells |
| Entrez ID | Symbol | Replicates | Species | Organ | Tissue | Adj P-value | Log2FC | Malignancy |
| 222584 | FAM83B | CA_HPV_1 | Human | Cervix | CC | 1.61e-02 | -1.33e-01 | 0.0264 |
| 222584 | FAM83B | CA_HPV_3 | Human | Cervix | CC | 8.83e-09 | 1.96e-01 | 0.0414 |
| 222584 | FAM83B | CCI_1 | Human | Cervix | CC | 2.89e-08 | 9.62e-01 | 0.528 |
| 222584 | FAM83B | CCI_2 | Human | Cervix | CC | 3.05e-08 | 9.28e-01 | 0.5249 |
| 222584 | FAM83B | CCI_3 | Human | Cervix | CC | 2.55e-08 | 6.95e-01 | 0.516 |
| 222584 | FAM83B | HTA11_3410_2000001011 | Human | Colorectum | AD | 4.07e-06 | -3.94e-01 | 0.0155 |
| 222584 | FAM83B | HTA11_3361_2000001011 | Human | Colorectum | AD | 3.91e-07 | -5.69e-01 | -0.1207 |
| 222584 | FAM83B | HTA11_696_2000001011 | Human | Colorectum | AD | 2.21e-07 | -4.08e-01 | -0.1464 |
| 222584 | FAM83B | HTA11_5212_2000001011 | Human | Colorectum | AD | 1.29e-03 | -6.05e-01 | -0.2061 |
| 222584 | FAM83B | HTA11_866_3004761011 | Human | Colorectum | AD | 2.51e-05 | -4.09e-01 | 0.096 |
| 222584 | FAM83B | HTA11_7696_3000711011 | Human | Colorectum | AD | 8.46e-04 | -3.59e-01 | 0.0674 |
| 222584 | FAM83B | HTA11_99999970781_79442 | Human | Colorectum | MSS | 6.23e-24 | -6.33e-01 | 0.294 |
| 222584 | FAM83B | HTA11_99999971662_82457 | Human | Colorectum | MSS | 1.18e-34 | -7.92e-01 | 0.3859 |
| 222584 | FAM83B | HTA11_99999973899_84307 | Human | Colorectum | MSS | 3.31e-07 | -7.00e-01 | 0.2585 |
| 222584 | FAM83B | HTA11_99999974143_84620 | Human | Colorectum | MSS | 4.78e-39 | -8.22e-01 | 0.3005 |
| 222584 | FAM83B | A002-C-010 | Human | Colorectum | FAP | 2.74e-03 | -3.66e-01 | 0.242 |
| 222584 | FAM83B | A001-C-207 | Human | Colorectum | FAP | 3.21e-10 | -5.60e-01 | 0.1278 |
| 222584 | FAM83B | A015-C-203 | Human | Colorectum | FAP | 8.77e-38 | -6.66e-01 | -0.1294 |
| 222584 | FAM83B | A015-C-204 | Human | Colorectum | FAP | 6.75e-08 | -4.81e-01 | -0.0228 |
| 222584 | FAM83B | A014-C-040 | Human | Colorectum | FAP | 1.15e-09 | -8.28e-01 | -0.1184 |
| Page: 1 2 3 4 5 6 7 |
| Tissue | Expression Dynamics | Abbreviation |
| Cervix | 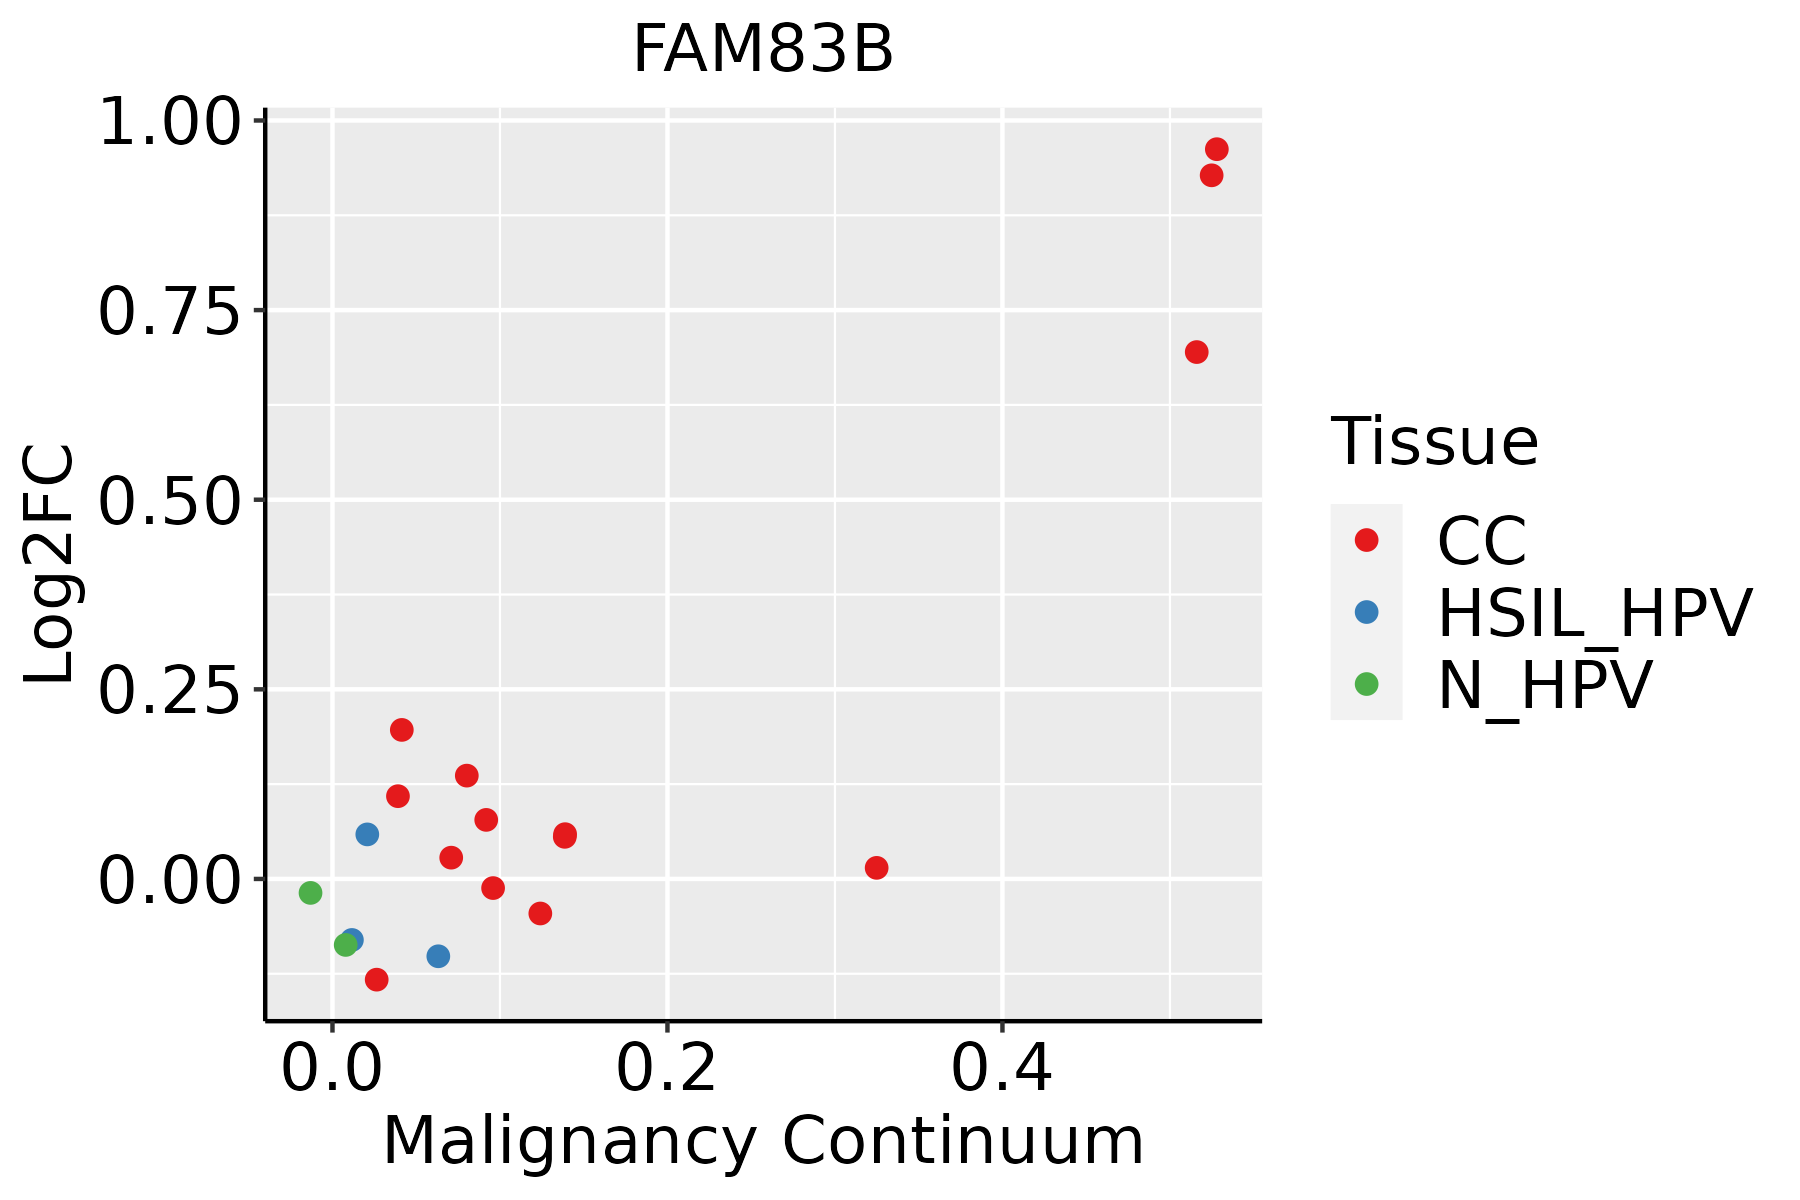 | CC: Cervix cancer |
| HSIL_HPV: HPV-infected high-grade squamous intraepithelial lesions | ||
| N_HPV: HPV-infected normal cervix | ||
| Colorectum (GSE201348) |  | FAP: Familial adenomatous polyposis |
| CRC: Colorectal cancer | ||
| Colorectum (HTA11) |  | AD: Adenomas |
| SER: Sessile serrated lesions | ||
| MSI-H: Microsatellite-high colorectal cancer | ||
| MSS: Microsatellite stable colorectal cancer | ||
| Esophagus | 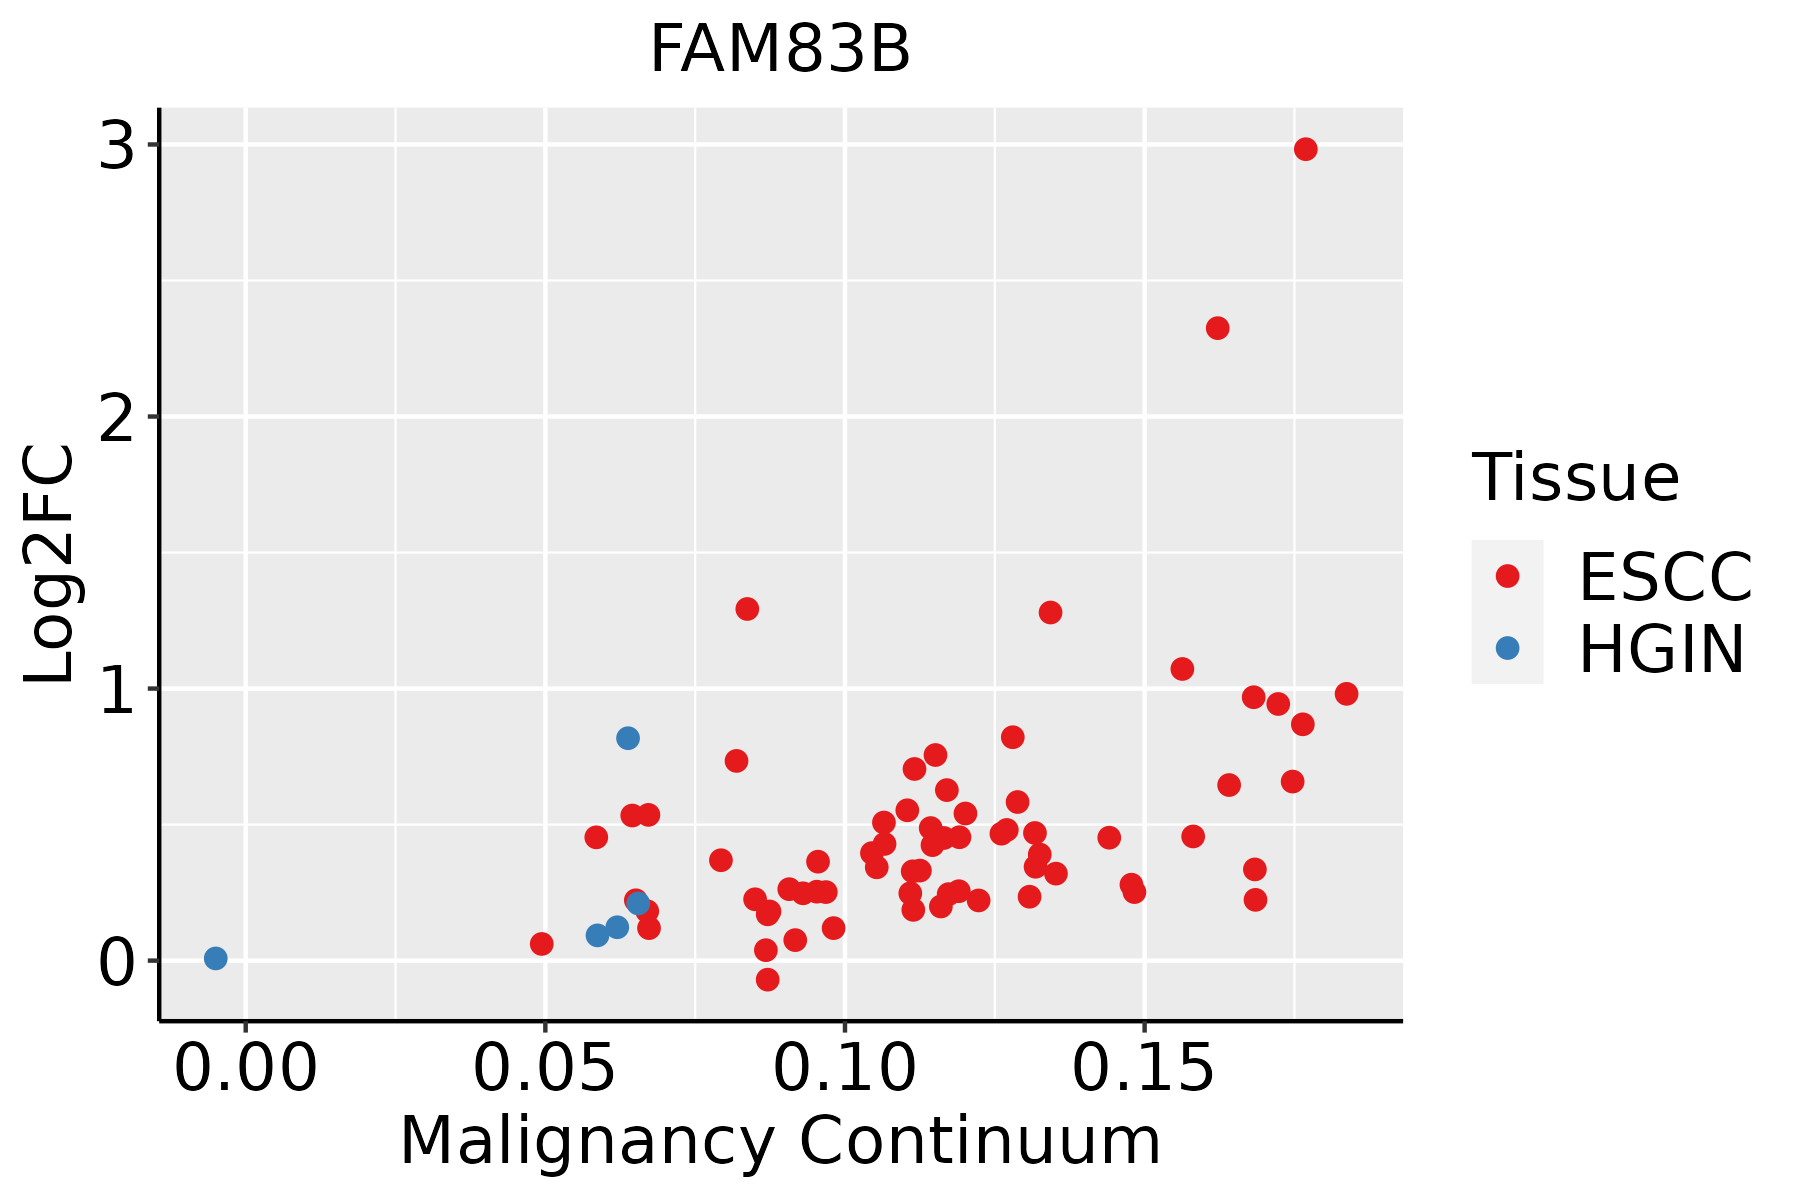 | ESCC: Esophageal squamous cell carcinoma |
| HGIN: High-grade intraepithelial neoplasias | ||
| LGIN: Low-grade intraepithelial neoplasias | ||
| Oral Cavity | 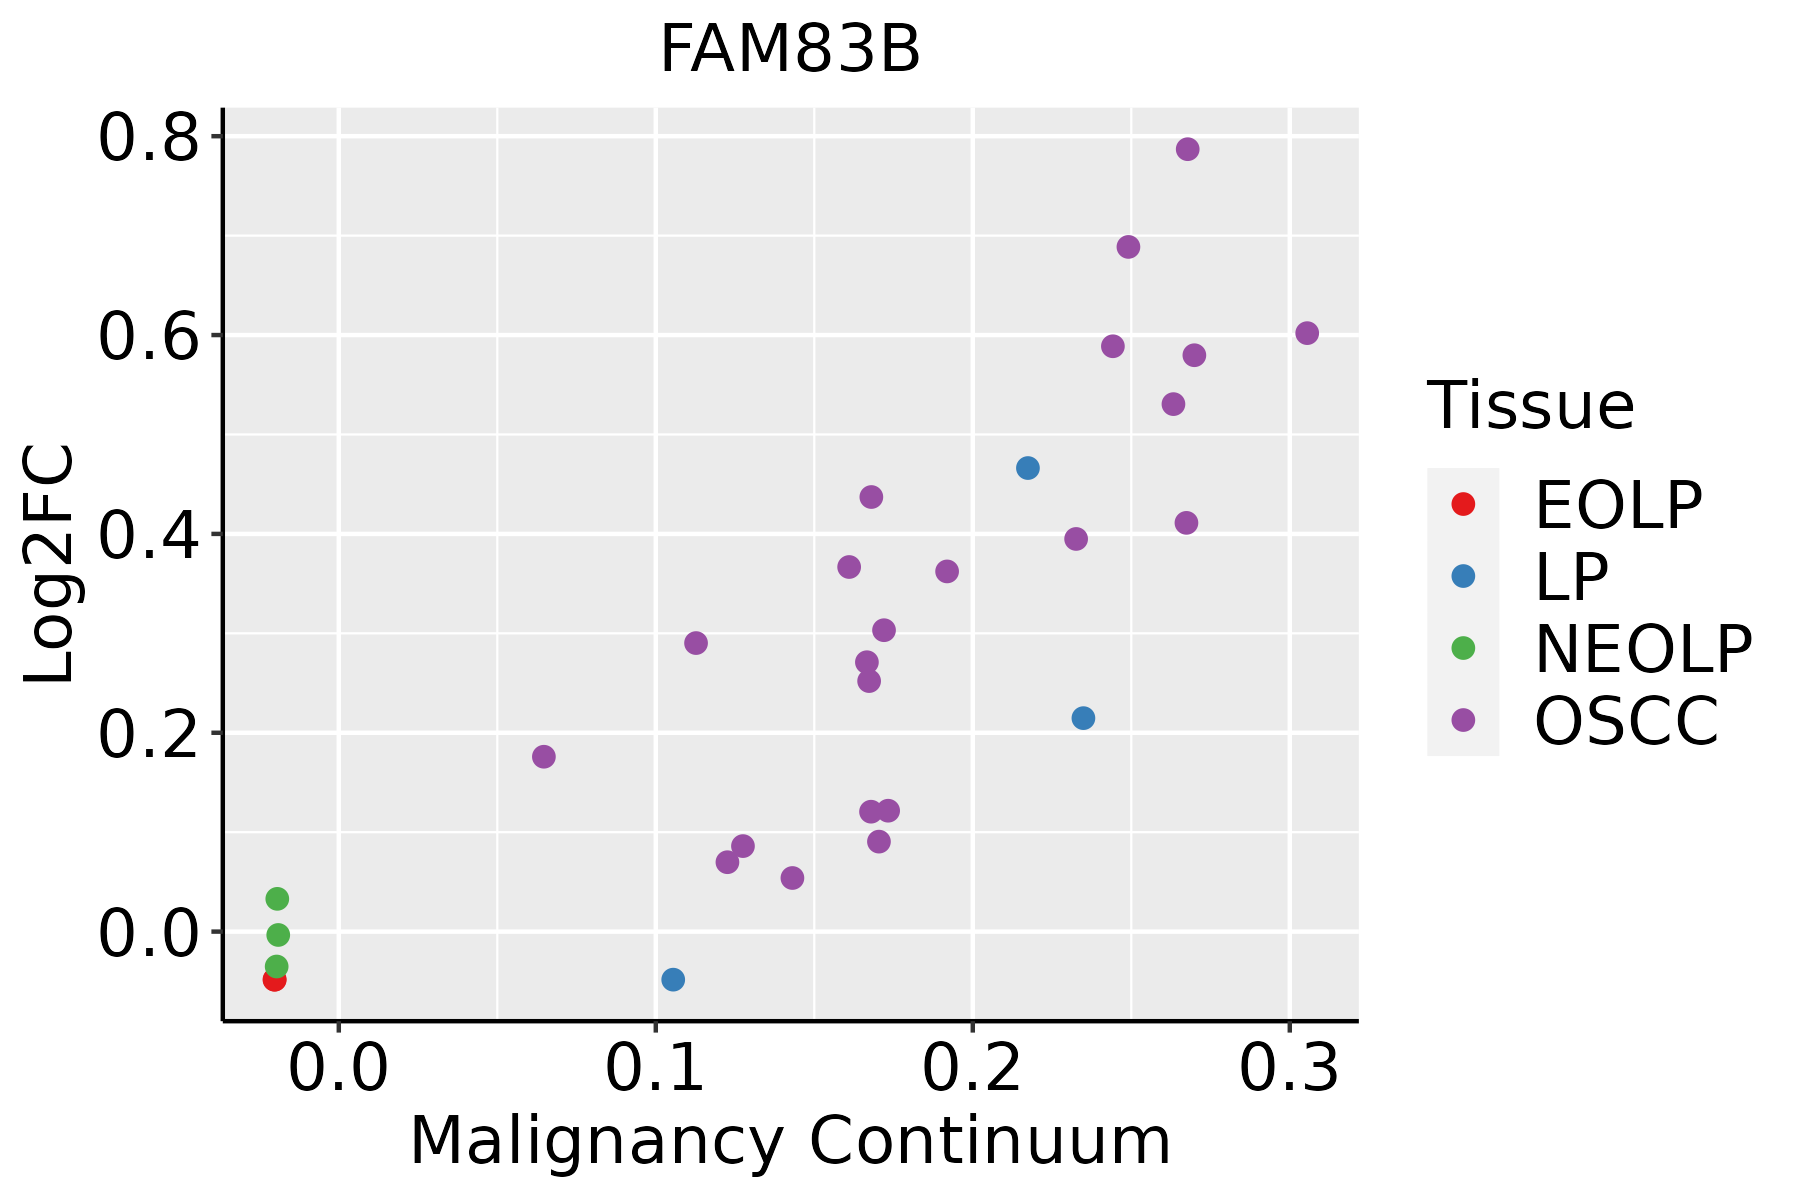 | EOLP: Erosive Oral lichen planus |
| LP: leukoplakia | ||
| NEOLP: Non-erosive oral lichen planus | ||
| OSCC: Oral squamous cell carcinoma | ||
| Skin |  | AK: Actinic keratosis |
| cSCC: Cutaneous squamous cell carcinoma | ||
| SCCIS:squamous cell carcinoma in situ |
| ∗log2FC in expression of this searched gene in stem-like cells from each diseased tissue sample relative to stem-like cells in normal samples in each tissue plotted against the malignancy continuum. Samples are colored based on if they are from different disease stage. |
Top |
Malignant transformation related pathway analysis |
| Find out the enriched GO biological processes and KEGG pathways involved in transition from healthy to precancer to cancer |
| Tissue | Disease Stage | Enriched GO biological Processes |
| Colorectum | AD |  |
| Colorectum | SER |  |
| Colorectum | MSS |  |
| Colorectum | MSI-H |  |
| Colorectum | FAP |  |
| ∗Top 15 enriched GO BP terms are showed in the bar plot of each disease state in each tissue. Each row represents a significant GO biological process which is colored according to the -log10(p.adjust). |
| Page: 1 2 3 4 5 6 7 8 9 |
| GO ID | Tissue | Disease Stage | Description | Gene Ratio | Bg Ratio | pvalue | p.adjust | Count |
| GO:00071738 | Cervix | CC | epidermal growth factor receptor signaling pathway | 36/2311 | 108/18723 | 1.04e-08 | 8.44e-07 | 36 |
| GO:00381278 | Cervix | CC | ERBB signaling pathway | 37/2311 | 121/18723 | 8.57e-08 | 4.88e-06 | 37 |
| GO:0038127 | Colorectum | AD | ERBB signaling pathway | 55/3918 | 121/18723 | 1.19e-09 | 8.85e-08 | 55 |
| GO:0007173 | Colorectum | AD | epidermal growth factor receptor signaling pathway | 50/3918 | 108/18723 | 3.08e-09 | 2.07e-07 | 50 |
| GO:00071732 | Colorectum | MSS | epidermal growth factor receptor signaling pathway | 43/3467 | 108/18723 | 1.92e-07 | 8.31e-06 | 43 |
| GO:00381272 | Colorectum | MSS | ERBB signaling pathway | 46/3467 | 121/18723 | 3.63e-07 | 1.45e-05 | 46 |
| GO:00071734 | Colorectum | FAP | epidermal growth factor receptor signaling pathway | 42/2622 | 108/18723 | 1.29e-10 | 3.77e-08 | 42 |
| GO:00381274 | Colorectum | FAP | ERBB signaling pathway | 45/2622 | 121/18723 | 1.64e-10 | 4.38e-08 | 45 |
| GO:00071735 | Colorectum | CRC | epidermal growth factor receptor signaling pathway | 39/2078 | 108/18723 | 6.90e-12 | 5.90e-09 | 39 |
| GO:00381275 | Colorectum | CRC | ERBB signaling pathway | 41/2078 | 121/18723 | 2.12e-11 | 1.59e-08 | 41 |
| GO:003812717 | Esophagus | HGIN | ERBB signaling pathway | 29/2587 | 121/18723 | 1.83e-03 | 1.97e-02 | 29 |
| GO:000717317 | Esophagus | HGIN | epidermal growth factor receptor signaling pathway | 25/2587 | 108/18723 | 5.87e-03 | 4.77e-02 | 25 |
| GO:003812718 | Esophagus | ESCC | ERBB signaling pathway | 82/8552 | 121/18723 | 7.23e-07 | 9.40e-06 | 82 |
| GO:000717318 | Esophagus | ESCC | epidermal growth factor receptor signaling pathway | 73/8552 | 108/18723 | 3.36e-06 | 3.73e-05 | 73 |
| GO:003812715 | Oral cavity | OSCC | ERBB signaling pathway | 76/7305 | 121/18723 | 9.59e-08 | 1.66e-06 | 76 |
| GO:000717315 | Oral cavity | OSCC | epidermal growth factor receptor signaling pathway | 67/7305 | 108/18723 | 1.04e-06 | 1.40e-05 | 67 |
| GO:003812719 | Skin | AK | ERBB signaling pathway | 29/1910 | 121/18723 | 9.23e-06 | 1.98e-04 | 29 |
| GO:000717319 | Skin | AK | epidermal growth factor receptor signaling pathway | 25/1910 | 108/18723 | 6.89e-05 | 1.00e-03 | 25 |
| GO:0007173110 | Skin | SCCIS | epidermal growth factor receptor signaling pathway | 18/919 | 108/18723 | 4.95e-06 | 2.05e-04 | 18 |
| GO:0038127110 | Skin | SCCIS | ERBB signaling pathway | 19/919 | 121/18723 | 6.72e-06 | 2.64e-04 | 19 |
| Page: 1 2 |
| Pathway ID | Tissue | Disease Stage | Description | Gene Ratio | Bg Ratio | pvalue | p.adjust | qvalue | Count |
| Page: 1 |
Top |
Cell-cell communication analysis |
| Identification of potential cell-cell interactions between two cell types and their ligand-receptor pairs for different disease states |
| Ligand | Receptor | LRpair | Pathway | Tissue | Disease Stage |
| Page: 1 |
Top |
Single-cell gene regulatory network inference analysis |
| Find out the significant the regulons (TFs) and the target genes of each regulon across cell types for different disease states |
| TF | Cell Type | Tissue | Disease Stage | Target Gene | RSS | Regulon Activity |
| ∗The dot plots of a searched regulon are shown for all cell subpopulations in each disease state of each tissue based on the regulon specific score inferred using pySCENIC and by calculating the average expression. |
| Page: 1 |
Top |
Somatic mutation of malignant transformation related genes |
| Annotation of somatic variants for genes involved in malignant transformation |
| Hugo Symbol | Variant Class | Variant Classification | dbSNP RS | HGVSc | HGVSp | HGVSp Short | SWISSPROT | BIOTYPE | SIFT | PolyPhen | Tumor Sample Barcode | Tissue | Histology | Sex | Age | Stage | Therapy Types | Drugs | Outcome |
| FAM83B | SNV | Missense_Mutation | novel | c.61N>A | p.Glu21Lys | p.E21K | Q5T0W9 | protein_coding | deleterious(0.01) | possibly_damaging(0.9) | TCGA-5L-AAT1-01 | Breast | breast invasive carcinoma | Female | <65 | III/IV | Hormone Therapy | letrozol | SD |
| FAM83B | SNV | Missense_Mutation | c.593N>T | p.Ser198Leu | p.S198L | Q5T0W9 | protein_coding | deleterious(0) | benign(0.038) | TCGA-A1-A0SH-01 | Breast | breast invasive carcinoma | Female | <65 | I/II | Chemotherapy | tc | SD | |
| FAM83B | SNV | Missense_Mutation | c.821G>T | p.Arg274Ile | p.R274I | Q5T0W9 | protein_coding | deleterious(0) | possibly_damaging(0.858) | TCGA-AN-A046-01 | Breast | breast invasive carcinoma | Female | >=65 | I/II | Unknown | Unknown | SD | |
| FAM83B | SNV | Missense_Mutation | novel | c.1956G>T | p.Lys652Asn | p.K652N | Q5T0W9 | protein_coding | deleterious(0.04) | benign(0.019) | TCGA-AN-A046-01 | Breast | breast invasive carcinoma | Female | >=65 | I/II | Unknown | Unknown | SD |
| FAM83B | SNV | Missense_Mutation | novel | c.2365C>A | p.Leu789Ile | p.L789I | Q5T0W9 | protein_coding | tolerated(0.21) | benign(0.045) | TCGA-AN-A046-01 | Breast | breast invasive carcinoma | Female | >=65 | I/II | Unknown | Unknown | SD |
| FAM83B | SNV | Missense_Mutation | c.2654C>T | p.Ser885Phe | p.S885F | Q5T0W9 | protein_coding | deleterious(0) | probably_damaging(0.998) | TCGA-BH-A0DZ-01 | Breast | breast invasive carcinoma | Female | <65 | I/II | Chemotherapy | docetaxel | SD | |
| FAM83B | SNV | Missense_Mutation | c.1285N>C | p.Ser429Pro | p.S429P | Q5T0W9 | protein_coding | tolerated(0.19) | benign(0.276) | TCGA-D8-A1XQ-01 | Breast | breast invasive carcinoma | Female | >=65 | I/II | Unknown | Unknown | SD | |
| FAM83B | insertion | Frame_Shift_Ins | novel | c.2979_2980insTCCT | p.Asn994SerfsTer2 | p.N994Sfs*2 | Q5T0W9 | protein_coding | TCGA-AN-A04C-01 | Breast | breast invasive carcinoma | Female | <65 | I/II | Unknown | Unknown | SD | ||
| FAM83B | insertion | Nonsense_Mutation | novel | c.2980_2981insCTTAAATGATCATTCAGAAGCT | p.Asn994ThrfsTer2 | p.N994Tfs*2 | Q5T0W9 | protein_coding | TCGA-AN-A04C-01 | Breast | breast invasive carcinoma | Female | <65 | I/II | Unknown | Unknown | SD | ||
| FAM83B | insertion | Frame_Shift_Ins | novel | c.2726_2727insCATGG | p.Glu909AspfsTer52 | p.E909Dfs*52 | Q5T0W9 | protein_coding | TCGA-AN-A0AS-01 | Breast | breast invasive carcinoma | Female | >=65 | III/IV | Unknown | Unknown | SD |
| Page: 1 2 3 4 5 6 7 8 9 10 11 12 13 14 15 16 17 18 19 |
Top |
Related drugs of malignant transformation related genes |
| Identification of chemicals and drugs interact with genes involved in malignant transfromation |
| (DGIdb 4.0) |
| Entrez ID | Symbol | Category | Interaction Types | Drug Claim Name | Drug Name | PMIDs |
| Page: 1 |

Copyright 2023-Present -The University of Texas Health Science Center at Houston |