
|
|||||
|
 | |
| |
| |
| |
| |
| |
|
Gene: FAM83A |
Gene summary for FAM83A |
| Gene information | Species | Human | Gene symbol | FAM83A | Gene ID | 84985 |
| Gene name | family with sequence similarity 83 member A | |
| Gene Alias | BJ-TSA-9 | |
| Cytomap | 8q24.13 | |
| Gene Type | protein-coding | GO ID | GO:0007154 | UniProtAcc | Q86UY5 |
Top |
Malignant transformation analysis |
| Identification of the aberrant gene expression in precancerous and cancerous lesions by comparing the gene expression of stem-like cells in diseased tissues with normal stem cells |
| Entrez ID | Symbol | Replicates | Species | Organ | Tissue | Adj P-value | Log2FC | Malignancy |
| 84985 | FAM83A | CA_HPV_2 | Human | Cervix | CC | 2.06e-04 | 2.06e-01 | 0.0391 |
| 84985 | FAM83A | CCI_1 | Human | Cervix | CC | 1.40e-15 | 1.29e+00 | 0.528 |
| 84985 | FAM83A | CCI_3 | Human | Cervix | CC | 1.15e-04 | 8.73e-01 | 0.516 |
| 84985 | FAM83A | Tumor | Human | Cervix | CC | 3.58e-28 | 6.52e-01 | 0.1241 |
| 84985 | FAM83A | sample3 | Human | Cervix | CC | 1.59e-60 | 9.11e-01 | 0.1387 |
| 84985 | FAM83A | H2 | Human | Cervix | HSIL_HPV | 1.70e-08 | 4.43e-01 | 0.0632 |
| 84985 | FAM83A | L1 | Human | Cervix | CC | 7.42e-04 | 4.33e-01 | 0.0802 |
| 84985 | FAM83A | T1 | Human | Cervix | CC | 3.81e-02 | 2.54e-01 | 0.0918 |
| 84985 | FAM83A | T3 | Human | Cervix | CC | 6.32e-53 | 8.75e-01 | 0.1389 |
| 84985 | FAM83A | LZE20T | Human | Esophagus | ESCC | 6.34e-29 | 1.37e+00 | 0.0662 |
| 84985 | FAM83A | P1T-E | Human | Esophagus | ESCC | 1.69e-03 | 3.51e-01 | 0.0875 |
| 84985 | FAM83A | P8T-E | Human | Esophagus | ESCC | 2.16e-15 | 5.35e-01 | 0.0889 |
| 84985 | FAM83A | P11T-E | Human | Esophagus | ESCC | 9.69e-04 | 7.10e-01 | 0.1426 |
| 84985 | FAM83A | P17T-E | Human | Esophagus | ESCC | 3.93e-09 | 1.49e+00 | 0.1278 |
| 84985 | FAM83A | P19T-E | Human | Esophagus | ESCC | 1.03e-03 | 1.12e+00 | 0.1662 |
| 84985 | FAM83A | P20T-E | Human | Esophagus | ESCC | 3.00e-30 | 7.86e-01 | 0.1124 |
| 84985 | FAM83A | P21T-E | Human | Esophagus | ESCC | 3.41e-12 | 5.35e-01 | 0.1617 |
| 84985 | FAM83A | P22T-E | Human | Esophagus | ESCC | 1.85e-03 | 1.67e-01 | 0.1236 |
| 84985 | FAM83A | P23T-E | Human | Esophagus | ESCC | 5.48e-04 | 3.72e-01 | 0.108 |
| 84985 | FAM83A | P27T-E | Human | Esophagus | ESCC | 2.42e-06 | 3.92e-01 | 0.1055 |
| Page: 1 2 3 4 |
| Tissue | Expression Dynamics | Abbreviation |
| Cervix | 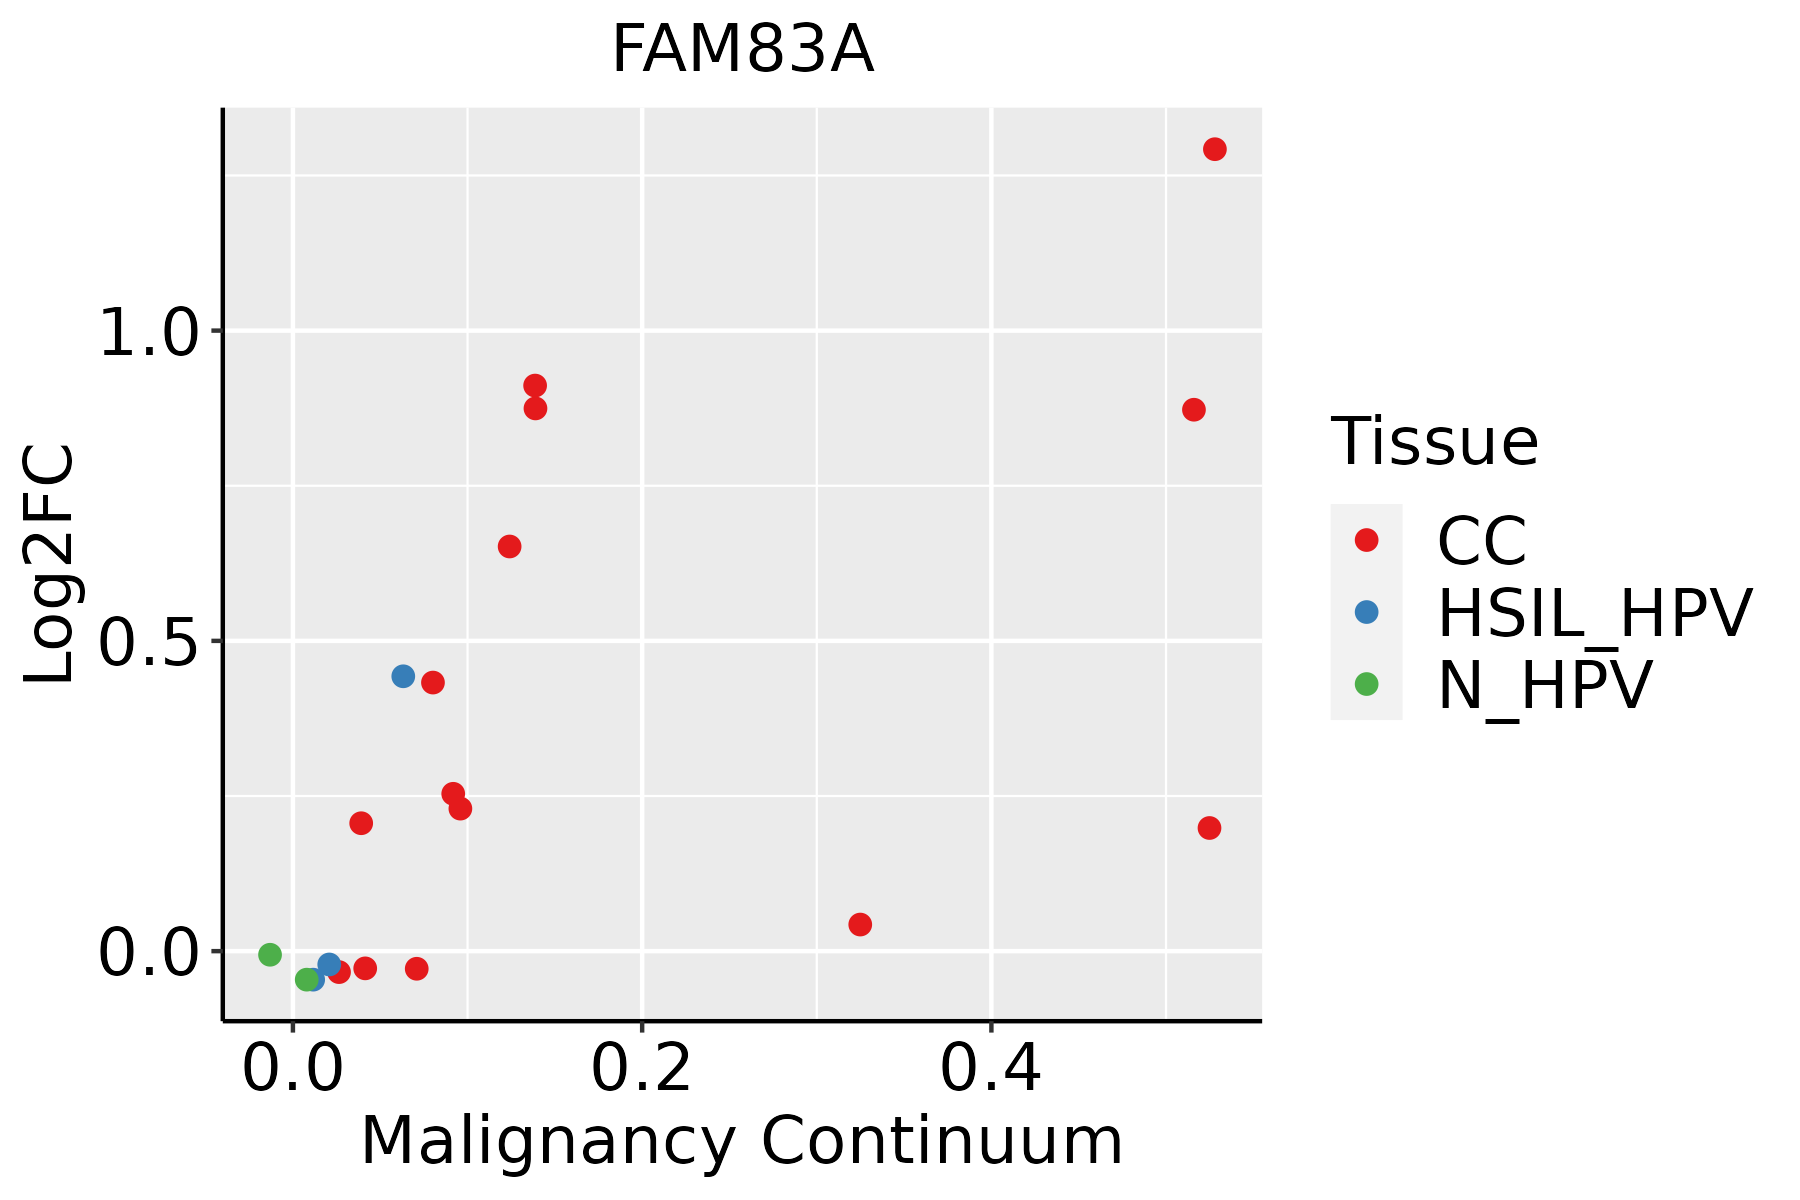 | CC: Cervix cancer |
| HSIL_HPV: HPV-infected high-grade squamous intraepithelial lesions | ||
| N_HPV: HPV-infected normal cervix | ||
| Esophagus |  | ESCC: Esophageal squamous cell carcinoma |
| HGIN: High-grade intraepithelial neoplasias | ||
| LGIN: Low-grade intraepithelial neoplasias | ||
| Oral Cavity |  | EOLP: Erosive Oral lichen planus |
| LP: leukoplakia | ||
| NEOLP: Non-erosive oral lichen planus | ||
| OSCC: Oral squamous cell carcinoma | ||
| Skin |  | AK: Actinic keratosis |
| cSCC: Cutaneous squamous cell carcinoma | ||
| SCCIS:squamous cell carcinoma in situ |
| ∗log2FC in expression of this searched gene in stem-like cells from each diseased tissue sample relative to stem-like cells in normal samples in each tissue plotted against the malignancy continuum. Samples are colored based on if they are from different disease stage. |
Top |
Malignant transformation related pathway analysis |
| Find out the enriched GO biological processes and KEGG pathways involved in transition from healthy to precancer to cancer |
| Tissue | Disease Stage | Enriched GO biological Processes |
| Colorectum | AD |  |
| Colorectum | SER |  |
| Colorectum | MSS |  |
| Colorectum | MSI-H |  |
| Colorectum | FAP |  |
| ∗Top 15 enriched GO BP terms are showed in the bar plot of each disease state in each tissue. Each row represents a significant GO biological process which is colored according to the -log10(p.adjust). |
| Page: 1 2 3 4 5 6 7 8 9 |
| GO ID | Tissue | Disease Stage | Description | Gene Ratio | Bg Ratio | pvalue | p.adjust | Count |
| GO:00071738 | Cervix | CC | epidermal growth factor receptor signaling pathway | 36/2311 | 108/18723 | 1.04e-08 | 8.44e-07 | 36 |
| GO:00381278 | Cervix | CC | ERBB signaling pathway | 37/2311 | 121/18723 | 8.57e-08 | 4.88e-06 | 37 |
| GO:003812718 | Esophagus | ESCC | ERBB signaling pathway | 82/8552 | 121/18723 | 7.23e-07 | 9.40e-06 | 82 |
| GO:000717318 | Esophagus | ESCC | epidermal growth factor receptor signaling pathway | 73/8552 | 108/18723 | 3.36e-06 | 3.73e-05 | 73 |
| GO:003812715 | Oral cavity | OSCC | ERBB signaling pathway | 76/7305 | 121/18723 | 9.59e-08 | 1.66e-06 | 76 |
| GO:000717315 | Oral cavity | OSCC | epidermal growth factor receptor signaling pathway | 67/7305 | 108/18723 | 1.04e-06 | 1.40e-05 | 67 |
| GO:003812716 | Oral cavity | LP | ERBB signaling pathway | 42/4623 | 121/18723 | 8.53e-03 | 4.61e-02 | 42 |
| GO:0007173110 | Skin | SCCIS | epidermal growth factor receptor signaling pathway | 18/919 | 108/18723 | 4.95e-06 | 2.05e-04 | 18 |
| GO:0038127110 | Skin | SCCIS | ERBB signaling pathway | 19/919 | 121/18723 | 6.72e-06 | 2.64e-04 | 19 |
| GO:003812724 | Skin | cSCC | ERBB signaling pathway | 55/4864 | 121/18723 | 2.77e-06 | 4.38e-05 | 55 |
| GO:000717323 | Skin | cSCC | epidermal growth factor receptor signaling pathway | 48/4864 | 108/18723 | 2.42e-05 | 2.76e-04 | 48 |
| Page: 1 |
| Pathway ID | Tissue | Disease Stage | Description | Gene Ratio | Bg Ratio | pvalue | p.adjust | qvalue | Count |
| Page: 1 |
Top |
Cell-cell communication analysis |
| Identification of potential cell-cell interactions between two cell types and their ligand-receptor pairs for different disease states |
| Ligand | Receptor | LRpair | Pathway | Tissue | Disease Stage |
| Page: 1 |
Top |
Single-cell gene regulatory network inference analysis |
| Find out the significant the regulons (TFs) and the target genes of each regulon across cell types for different disease states |
| TF | Cell Type | Tissue | Disease Stage | Target Gene | RSS | Regulon Activity |
| ∗The dot plots of a searched regulon are shown for all cell subpopulations in each disease state of each tissue based on the regulon specific score inferred using pySCENIC and by calculating the average expression. |
| Page: 1 |
Top |
Somatic mutation of malignant transformation related genes |
| Annotation of somatic variants for genes involved in malignant transformation |
| Hugo Symbol | Variant Class | Variant Classification | dbSNP RS | HGVSc | HGVSp | HGVSp Short | SWISSPROT | BIOTYPE | SIFT | PolyPhen | Tumor Sample Barcode | Tissue | Histology | Sex | Age | Stage | Therapy Types | Drugs | Outcome |
| FAM83A | SNV | Missense_Mutation | c.425N>A | p.Val142Asp | p.V142D | Q86UY5 | protein_coding | tolerated(1) | benign(0) | TCGA-A2-A0CX-01 | Breast | breast invasive carcinoma | Female | <65 | I/II | Chemotherapy | adriamycin | SD | |
| FAM83A | SNV | Missense_Mutation | novel | c.593N>C | p.Val198Ala | p.V198A | Q86UY5 | protein_coding | tolerated(0.07) | benign(0.266) | TCGA-A7-A6VY-01 | Breast | breast invasive carcinoma | Female | <65 | I/II | Chemotherapy | cyclophosphamide | CR |
| FAM83A | SNV | Missense_Mutation | c.522N>G | p.Ile174Met | p.I174M | Q86UY5 | protein_coding | deleterious(0) | probably_damaging(0.995) | TCGA-BH-A1FU-01 | Breast | breast invasive carcinoma | Female | <65 | I/II | Unknown | Unknown | PD | |
| FAM83A | SNV | Missense_Mutation | rs149619029 | c.661N>T | p.Arg221Trp | p.R221W | Q86UY5 | protein_coding | deleterious(0) | probably_damaging(1) | TCGA-OL-A5RU-01 | Breast | breast invasive carcinoma | Female | <65 | I/II | Chemotherapy | cyclophosphamide | CR |
| FAM83A | insertion | In_Frame_Ins | novel | c.233_234insGGTCCTGGGAGCAGGCGGCCT | p.Pro78_Pro79insValLeuGlyAlaGlyGlyLeu | p.P78_P79insVLGAGGL | Q86UY5 | protein_coding | TCGA-AN-A0FX-01 | Breast | breast invasive carcinoma | Female | <65 | I/II | Unknown | Unknown | SD | ||
| FAM83A | deletion | Frame_Shift_Del | c.257delG | p.Gly86GlufsTer44 | p.G86Efs*44 | Q86UY5 | protein_coding | TCGA-BH-A0BR-01 | Breast | breast invasive carcinoma | Female | <65 | I/II | Unknown | Unknown | SD | |||
| FAM83A | deletion | Frame_Shift_Del | novel | c.396delA | p.Lys132AsnfsTer34 | p.K132Nfs*34 | Q86UY5 | protein_coding | TCGA-EW-A2FV-01 | Breast | breast invasive carcinoma | Female | <65 | III/IV | Chemotherapy | docetaxel | SD | ||
| FAM83A | SNV | Missense_Mutation | novel | c.186N>A | p.Phe62Leu | p.F62L | Q86UY5 | protein_coding | deleterious(0.03) | possibly_damaging(0.571) | TCGA-AZ-4315-01 | Colorectum | colon adenocarcinoma | Male | <65 | I/II | Unknown | Unknown | SD |
| FAM83A | SNV | Missense_Mutation | c.1040N>A | p.Arg347Gln | p.R347Q | Q86UY5 | protein_coding | tolerated(0.99) | benign(0.001) | TCGA-AZ-4315-01 | Colorectum | colon adenocarcinoma | Male | <65 | I/II | Unknown | Unknown | SD | |
| FAM83A | SNV | Missense_Mutation | rs373188549 | c.790N>A | p.Gly264Arg | p.G264R | Q86UY5 | protein_coding | deleterious(0) | probably_damaging(0.99) | TCGA-CA-6717-01 | Colorectum | colon adenocarcinoma | Male | <65 | I/II | Chemotherapy | oxaliplatin | CR |
| Page: 1 2 3 4 |
Top |
Related drugs of malignant transformation related genes |
| Identification of chemicals and drugs interact with genes involved in malignant transfromation |
| (DGIdb 4.0) |
| Entrez ID | Symbol | Category | Interaction Types | Drug Claim Name | Drug Name | PMIDs |
| Page: 1 |

Copyright 2023-Present -The University of Texas Health Science Center at Houston |