
|
|||||
|
 | |
| |
| |
| |
| |
| |
|
Gene: FAM76B |
Gene summary for FAM76B |
| Gene information | Species | Human | Gene symbol | FAM76B | Gene ID | 143684 |
| Gene name | family with sequence similarity 76 member B | |
| Gene Alias | FAM76B | |
| Cytomap | 11q21 | |
| Gene Type | protein-coding | GO ID | GO:0005575 | UniProtAcc | F5GX09 |
Top |
Malignant transformation analysis |
| Identification of the aberrant gene expression in precancerous and cancerous lesions by comparing the gene expression of stem-like cells in diseased tissues with normal stem cells |
| Entrez ID | Symbol | Replicates | Species | Organ | Tissue | Adj P-value | Log2FC | Malignancy |
| 143684 | FAM76B | LZE4T | Human | Esophagus | ESCC | 8.69e-04 | 4.55e-02 | 0.0811 |
| 143684 | FAM76B | LZE7T | Human | Esophagus | ESCC | 1.75e-02 | 1.20e-01 | 0.0667 |
| 143684 | FAM76B | LZE20T | Human | Esophagus | ESCC | 7.57e-04 | 5.55e-02 | 0.0662 |
| 143684 | FAM76B | LZE24T | Human | Esophagus | ESCC | 2.00e-15 | 1.51e-01 | 0.0596 |
| 143684 | FAM76B | LZE21T | Human | Esophagus | ESCC | 1.39e-02 | 2.02e-01 | 0.0655 |
| 143684 | FAM76B | P2T-E | Human | Esophagus | ESCC | 4.51e-08 | 1.34e-01 | 0.1177 |
| 143684 | FAM76B | P4T-E | Human | Esophagus | ESCC | 9.40e-19 | 4.64e-01 | 0.1323 |
| 143684 | FAM76B | P5T-E | Human | Esophagus | ESCC | 1.36e-06 | 1.09e-01 | 0.1327 |
| 143684 | FAM76B | P8T-E | Human | Esophagus | ESCC | 1.26e-04 | 7.90e-03 | 0.0889 |
| 143684 | FAM76B | P9T-E | Human | Esophagus | ESCC | 4.64e-04 | 1.27e-01 | 0.1131 |
| 143684 | FAM76B | P10T-E | Human | Esophagus | ESCC | 2.07e-13 | 1.65e-01 | 0.116 |
| 143684 | FAM76B | P11T-E | Human | Esophagus | ESCC | 4.74e-03 | 1.32e-01 | 0.1426 |
| 143684 | FAM76B | P12T-E | Human | Esophagus | ESCC | 4.06e-15 | 2.97e-01 | 0.1122 |
| 143684 | FAM76B | P15T-E | Human | Esophagus | ESCC | 8.38e-07 | 8.25e-02 | 0.1149 |
| 143684 | FAM76B | P16T-E | Human | Esophagus | ESCC | 1.53e-06 | 1.66e-01 | 0.1153 |
| 143684 | FAM76B | P17T-E | Human | Esophagus | ESCC | 2.35e-02 | 1.31e-01 | 0.1278 |
| 143684 | FAM76B | P20T-E | Human | Esophagus | ESCC | 2.23e-10 | 1.45e-01 | 0.1124 |
| 143684 | FAM76B | P21T-E | Human | Esophagus | ESCC | 1.84e-13 | 1.74e-01 | 0.1617 |
| 143684 | FAM76B | P22T-E | Human | Esophagus | ESCC | 6.28e-09 | 6.52e-02 | 0.1236 |
| 143684 | FAM76B | P23T-E | Human | Esophagus | ESCC | 3.37e-07 | 9.56e-02 | 0.108 |
| Page: 1 2 3 |
| Tissue | Expression Dynamics | Abbreviation |
| Esophagus | 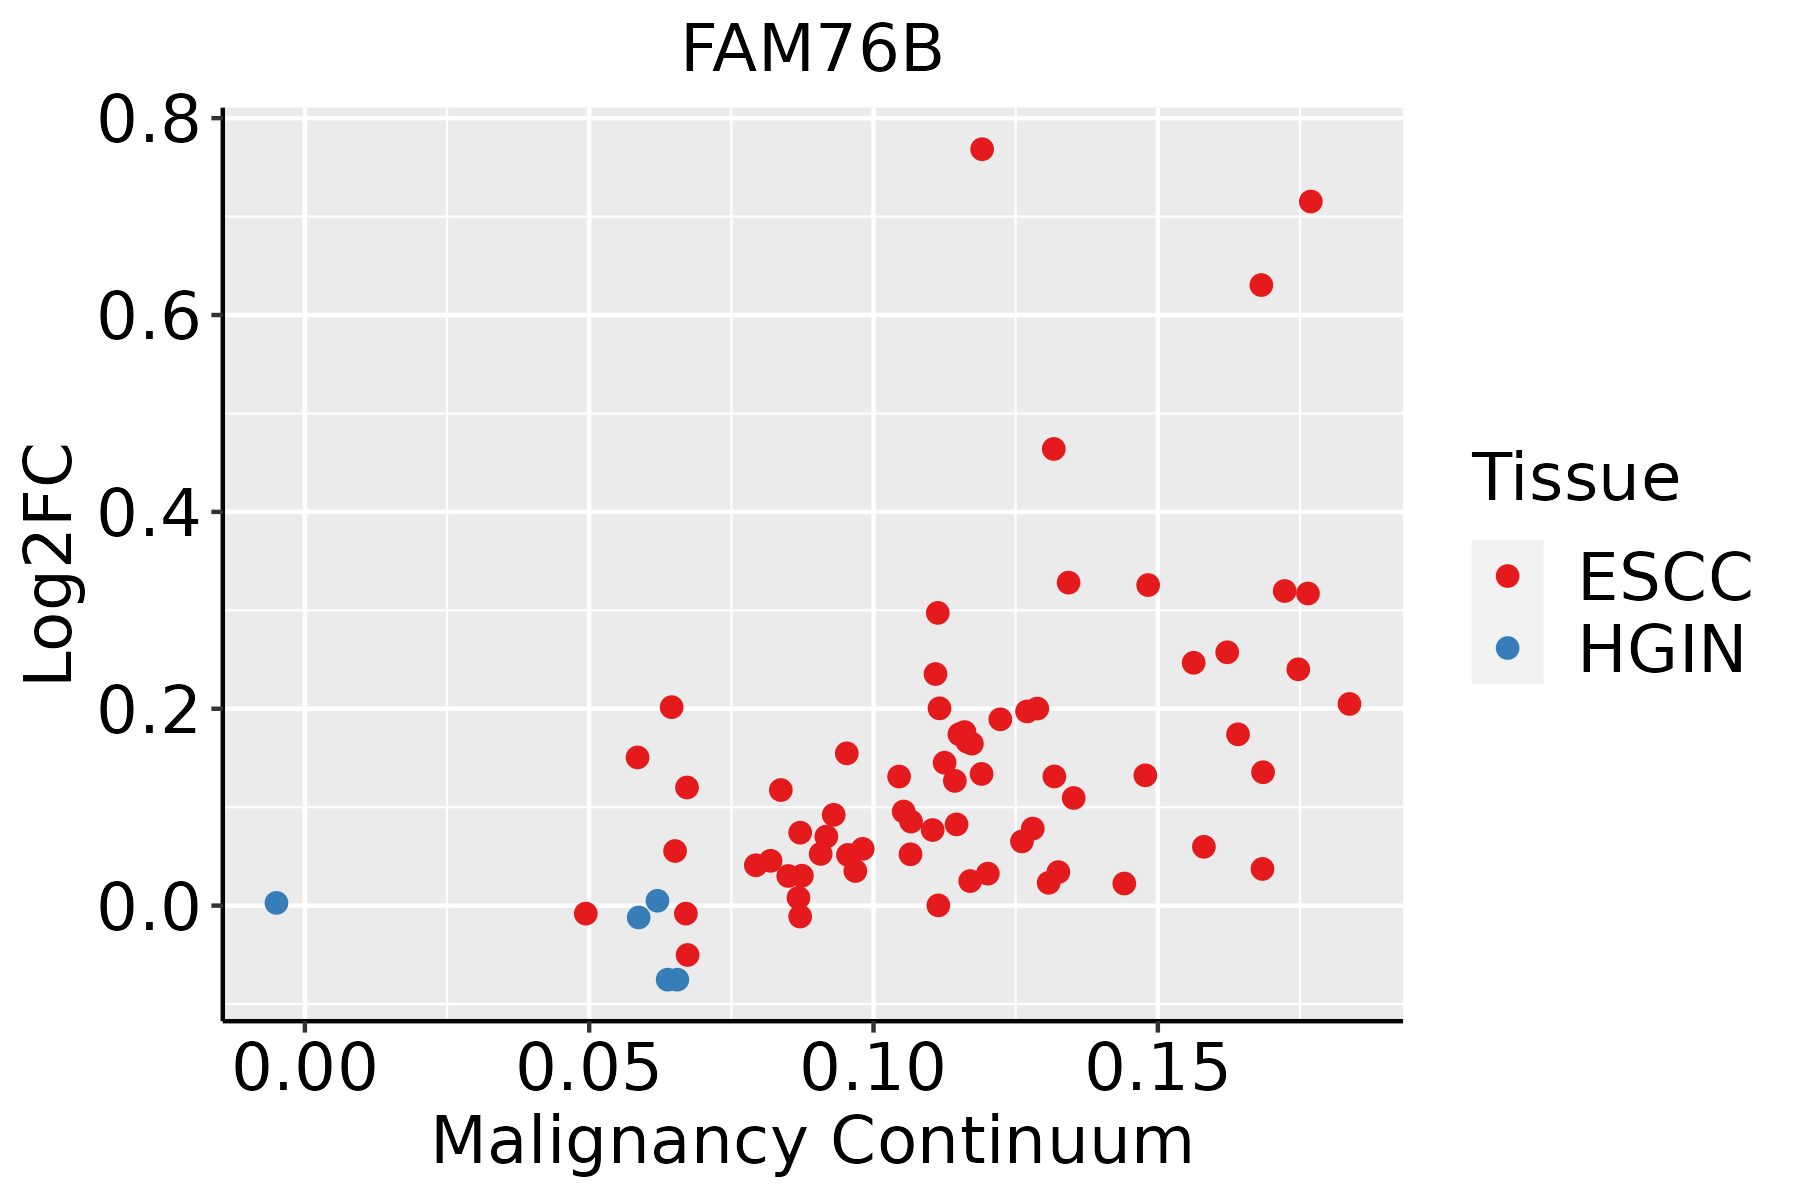 | ESCC: Esophageal squamous cell carcinoma |
| HGIN: High-grade intraepithelial neoplasias | ||
| LGIN: Low-grade intraepithelial neoplasias | ||
| Liver |  | HCC: Hepatocellular carcinoma |
| NAFLD: Non-alcoholic fatty liver disease |
| ∗log2FC in expression of this searched gene in stem-like cells from each diseased tissue sample relative to stem-like cells in normal samples in each tissue plotted against the malignancy continuum. Samples are colored based on if they are from different disease stage. |
Top |
Malignant transformation related pathway analysis |
| Find out the enriched GO biological processes and KEGG pathways involved in transition from healthy to precancer to cancer |
| Tissue | Disease Stage | Enriched GO biological Processes |
| Colorectum | AD |  |
| Colorectum | SER |  |
| Colorectum | MSS |  |
| Colorectum | MSI-H |  |
| Colorectum | FAP |  |
| ∗Top 15 enriched GO BP terms are showed in the bar plot of each disease state in each tissue. Each row represents a significant GO biological process which is colored according to the -log10(p.adjust). |
| Page: 1 2 3 4 5 6 7 8 9 |
| GO ID | Tissue | Disease Stage | Description | Gene Ratio | Bg Ratio | pvalue | p.adjust | Count |
| Page: 1 |
| Pathway ID | Tissue | Disease Stage | Description | Gene Ratio | Bg Ratio | pvalue | p.adjust | qvalue | Count |
| Page: 1 |
Top |
Cell-cell communication analysis |
| Identification of potential cell-cell interactions between two cell types and their ligand-receptor pairs for different disease states |
| Ligand | Receptor | LRpair | Pathway | Tissue | Disease Stage |
| Page: 1 |
Top |
Single-cell gene regulatory network inference analysis |
| Find out the significant the regulons (TFs) and the target genes of each regulon across cell types for different disease states |
| TF | Cell Type | Tissue | Disease Stage | Target Gene | RSS | Regulon Activity |
| ∗The dot plots of a searched regulon are shown for all cell subpopulations in each disease state of each tissue based on the regulon specific score inferred using pySCENIC and by calculating the average expression. |
| Page: 1 |
Top |
Somatic mutation of malignant transformation related genes |
| Annotation of somatic variants for genes involved in malignant transformation |
| Hugo Symbol | Variant Class | Variant Classification | dbSNP RS | HGVSc | HGVSp | HGVSp Short | SWISSPROT | BIOTYPE | SIFT | PolyPhen | Tumor Sample Barcode | Tissue | Histology | Sex | Age | Stage | Therapy Types | Drugs | Outcome |
| FAM76B | SNV | Missense_Mutation | c.136N>A | p.Glu46Lys | p.E46K | Q5HYJ3 | protein_coding | deleterious(0) | probably_damaging(0.946) | TCGA-A2-A0YK-01 | Breast | breast invasive carcinoma | Female | <65 | I/II | Chemotherapy | cytoxan | SD | |
| FAM76B | SNV | Missense_Mutation | c.181N>A | p.Ala61Thr | p.A61T | Q5HYJ3 | protein_coding | tolerated(0.1) | benign(0.401) | TCGA-C8-A26W-01 | Breast | breast invasive carcinoma | Female | <65 | I/II | Chemotherapy | doxorubicin | CR | |
| FAM76B | insertion | Nonsense_Mutation | novel | c.125_126insA | p.Tyr42Ter | p.Y42* | Q5HYJ3 | protein_coding | TCGA-AC-A6NO-01 | Breast | breast invasive carcinoma | Female | <65 | I/II | Unknown | Unknown | SD | ||
| FAM76B | SNV | Missense_Mutation | novel | c.95N>A | p.Arg32Gln | p.R32Q | Q5HYJ3 | protein_coding | deleterious(0) | probably_damaging(0.966) | TCGA-2W-A8YY-01 | Cervix | cervical & endocervical cancer | Female | <65 | I/II | Chemotherapy | cisplatin | CR |
| FAM76B | SNV | Missense_Mutation | c.136N>C | p.Glu46Gln | p.E46Q | Q5HYJ3 | protein_coding | deleterious(0) | possibly_damaging(0.848) | TCGA-EK-A2PG-01 | Cervix | cervical & endocervical cancer | Female | >=65 | I/II | Unknown | Unknown | SD | |
| FAM76B | SNV | Missense_Mutation | c.425N>T | p.Thr142Met | p.T142M | Q5HYJ3 | protein_coding | deleterious(0) | probably_damaging(0.975) | TCGA-VS-A9UU-01 | Cervix | cervical & endocervical cancer | Female | <65 | I/II | Chemotherapy | cisplatin | CR | |
| FAM76B | SNV | Missense_Mutation | rs565105324 | c.206N>T | p.Thr69Met | p.T69M | Q5HYJ3 | protein_coding | deleterious(0.01) | probably_damaging(0.921) | TCGA-AA-3713-01 | Colorectum | colon adenocarcinoma | Male | >=65 | III/IV | Chemotherapy | 5-fluorouracil | PR |
| FAM76B | SNV | Missense_Mutation | c.782N>A | p.Arg261His | p.R261H | Q5HYJ3 | protein_coding | deleterious(0) | probably_damaging(0.946) | TCGA-AA-3815-01 | Colorectum | colon adenocarcinoma | Female | >=65 | I/II | Unknown | Unknown | SD | |
| FAM76B | SNV | Missense_Mutation | c.643N>T | p.Thr215Ser | p.T215S | Q5HYJ3 | protein_coding | tolerated(0.83) | benign(0.05) | TCGA-AD-6964-01 | Colorectum | colon adenocarcinoma | Male | <65 | III/IV | Chemotherapy | folfox | PD | |
| FAM76B | SNV | Missense_Mutation | rs372898056 | c.341N>A | p.Arg114Gln | p.R114Q | Q5HYJ3 | protein_coding | deleterious(0.01) | probably_damaging(0.964) | TCGA-CA-6717-01 | Colorectum | colon adenocarcinoma | Male | <65 | I/II | Chemotherapy | oxaliplatin | CR |
| Page: 1 2 3 4 5 |
Top |
Related drugs of malignant transformation related genes |
| Identification of chemicals and drugs interact with genes involved in malignant transfromation |
| (DGIdb 4.0) |
| Entrez ID | Symbol | Category | Interaction Types | Drug Claim Name | Drug Name | PMIDs |
| Page: 1 |

Copyright 2023-Present -The University of Texas Health Science Center at Houston |