
|
|||||
|
 | |
| |
| |
| |
| |
| |
|
Gene: FAM76A |
Gene summary for FAM76A |
| Gene information | Species | Human | Gene symbol | FAM76A | Gene ID | 199870 |
| Gene name | family with sequence similarity 76 member A | |
| Gene Alias | FAM76A | |
| Cytomap | 1p35.3 | |
| Gene Type | protein-coding | GO ID | GO:0005575 | UniProtAcc | Q8TAV0 |
Top |
Malignant transformation analysis |
| Identification of the aberrant gene expression in precancerous and cancerous lesions by comparing the gene expression of stem-like cells in diseased tissues with normal stem cells |
| Entrez ID | Symbol | Replicates | Species | Organ | Tissue | Adj P-value | Log2FC | Malignancy |
| 199870 | FAM76A | male-WTA | Human | Thyroid | PTC | 1.09e-07 | 1.01e-01 | 0.1037 |
| 199870 | FAM76A | PTC01 | Human | Thyroid | PTC | 1.88e-08 | 1.52e-01 | 0.1899 |
| 199870 | FAM76A | PTC03 | Human | Thyroid | PTC | 1.40e-03 | 2.42e-01 | 0.1784 |
| 199870 | FAM76A | PTC04 | Human | Thyroid | PTC | 1.87e-17 | 3.10e-01 | 0.1927 |
| 199870 | FAM76A | PTC05 | Human | Thyroid | PTC | 3.47e-08 | 3.47e-01 | 0.2065 |
| 199870 | FAM76A | PTC06 | Human | Thyroid | PTC | 2.28e-21 | 5.01e-01 | 0.2057 |
| 199870 | FAM76A | PTC07 | Human | Thyroid | PTC | 1.58e-23 | 4.21e-01 | 0.2044 |
| 199870 | FAM76A | ATC12 | Human | Thyroid | ATC | 1.12e-05 | 4.84e-02 | 0.34 |
| 199870 | FAM76A | ATC13 | Human | Thyroid | ATC | 1.36e-29 | 3.91e-01 | 0.34 |
| 199870 | FAM76A | ATC2 | Human | Thyroid | ATC | 4.08e-02 | 2.12e-01 | 0.34 |
| 199870 | FAM76A | ATC4 | Human | Thyroid | ATC | 3.75e-03 | 1.07e-01 | 0.34 |
| 199870 | FAM76A | ATC5 | Human | Thyroid | ATC | 1.21e-25 | 4.18e-01 | 0.34 |
| Page: 1 |
| Tissue | Expression Dynamics | Abbreviation |
| Thyroid | 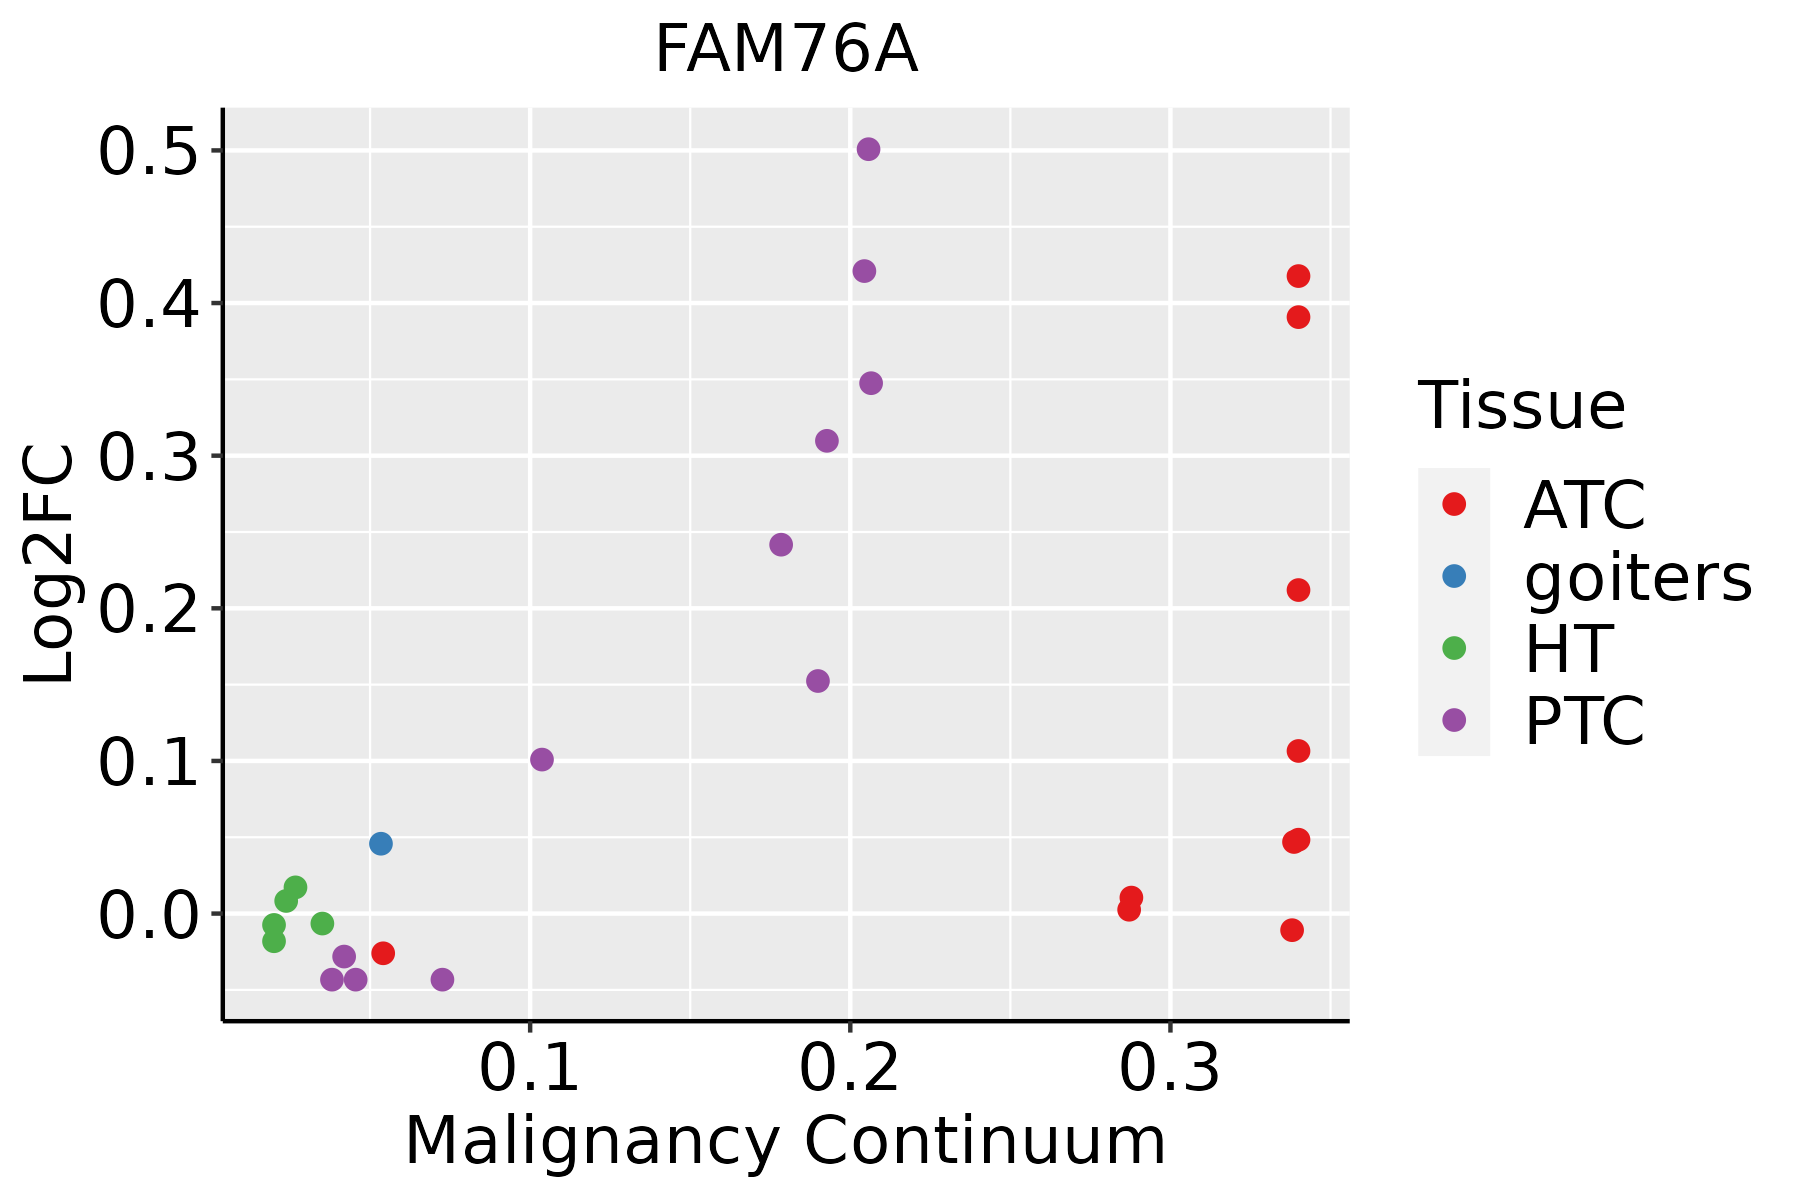 | ATC: Anaplastic thyroid cancer |
| HT: Hashimoto's thyroiditis | ||
| PTC: Papillary thyroid cancer |
| ∗log2FC in expression of this searched gene in stem-like cells from each diseased tissue sample relative to stem-like cells in normal samples in each tissue plotted against the malignancy continuum. Samples are colored based on if they are from different disease stage. |
Top |
Malignant transformation related pathway analysis |
| Find out the enriched GO biological processes and KEGG pathways involved in transition from healthy to precancer to cancer |
| Tissue | Disease Stage | Enriched GO biological Processes |
| Colorectum | AD |  |
| Colorectum | SER |  |
| Colorectum | MSS |  |
| Colorectum | MSI-H |  |
| Colorectum | FAP |  |
| ∗Top 15 enriched GO BP terms are showed in the bar plot of each disease state in each tissue. Each row represents a significant GO biological process which is colored according to the -log10(p.adjust). |
| Page: 1 2 3 4 5 6 7 8 9 |
| GO ID | Tissue | Disease Stage | Description | Gene Ratio | Bg Ratio | pvalue | p.adjust | Count |
| Page: 1 |
| Pathway ID | Tissue | Disease Stage | Description | Gene Ratio | Bg Ratio | pvalue | p.adjust | qvalue | Count |
| Page: 1 |
Top |
Cell-cell communication analysis |
| Identification of potential cell-cell interactions between two cell types and their ligand-receptor pairs for different disease states |
| Ligand | Receptor | LRpair | Pathway | Tissue | Disease Stage |
| Page: 1 |
Top |
Single-cell gene regulatory network inference analysis |
| Find out the significant the regulons (TFs) and the target genes of each regulon across cell types for different disease states |
| TF | Cell Type | Tissue | Disease Stage | Target Gene | RSS | Regulon Activity |
| ∗The dot plots of a searched regulon are shown for all cell subpopulations in each disease state of each tissue based on the regulon specific score inferred using pySCENIC and by calculating the average expression. |
| Page: 1 |
Top |
Somatic mutation of malignant transformation related genes |
| Annotation of somatic variants for genes involved in malignant transformation |
| Hugo Symbol | Variant Class | Variant Classification | dbSNP RS | HGVSc | HGVSp | HGVSp Short | SWISSPROT | BIOTYPE | SIFT | PolyPhen | Tumor Sample Barcode | Tissue | Histology | Sex | Age | Stage | Therapy Types | Drugs | Outcome |
| FAM76A | SNV | Missense_Mutation | c.401C>G | p.Ser134Cys | p.S134C | Q8TAV0 | protein_coding | deleterious(0) | possibly_damaging(0.831) | TCGA-AC-A23H-01 | Breast | breast invasive carcinoma | Female | >=65 | I/II | Unknown | Unknown | PD | |
| FAM76A | SNV | Missense_Mutation | c.428N>T | p.Ala143Val | p.A143V | Q8TAV0 | protein_coding | deleterious(0) | possibly_damaging(0.841) | TCGA-AA-3833-01 | Colorectum | colon adenocarcinoma | Female | <65 | I/II | Unknown | Unknown | SD | |
| FAM76A | SNV | Missense_Mutation | c.361C>T | p.Arg121Cys | p.R121C | Q8TAV0 | protein_coding | deleterious(0) | probably_damaging(0.979) | TCGA-WS-AB45-01 | Colorectum | colon adenocarcinoma | Female | <65 | I/II | Unknown | Unknown | SD | |
| FAM76A | SNV | Missense_Mutation | novel | c.270G>T | p.Lys90Asn | p.K90N | Q8TAV0 | protein_coding | deleterious(0) | probably_damaging(0.999) | TCGA-F5-6814-01 | Colorectum | rectum adenocarcinoma | Male | <65 | I/II | Unknown | Unknown | SD |
| FAM76A | SNV | Missense_Mutation | novel | c.956T>C | p.Leu319Pro | p.L319P | Q8TAV0 | protein_coding | deleterious(0) | probably_damaging(1) | TCGA-F5-6814-01 | Colorectum | rectum adenocarcinoma | Male | <65 | I/II | Unknown | Unknown | SD |
| FAM76A | SNV | Missense_Mutation | c.461A>T | p.Asp154Val | p.D154V | Q8TAV0 | protein_coding | deleterious(0) | probably_damaging(0.994) | TCGA-BS-A0U8-01 | Endometrium | uterine corpus endometrioid carcinoma | Female | <65 | III/IV | Chemotherapy | doxorubicin | SD | |
| FAM76A | SNV | Missense_Mutation | novel | c.341N>G | p.Phe114Cys | p.F114C | Q8TAV0 | protein_coding | deleterious(0) | probably_damaging(1) | TCGA-EO-A22U-01 | Endometrium | uterine corpus endometrioid carcinoma | Female | >=65 | I/II | Unknown | Unknown | SD |
| FAM76A | SNV | Missense_Mutation | novel | c.516N>C | p.Lys172Asn | p.K172N | Q8TAV0 | protein_coding | deleterious(0) | probably_damaging(1) | TCGA-44-6777-01 | Lung | lung adenocarcinoma | Female | >=65 | I/II | Unknown | Unknown | SD |
| FAM76A | SNV | Missense_Mutation | c.712G>T | p.Asp238Tyr | p.D238Y | Q8TAV0 | protein_coding | deleterious(0.01) | possibly_damaging(0.782) | TCGA-49-4507-01 | Lung | lung adenocarcinoma | Female | >=65 | III/IV | Chemotherapy | taxol | PD | |
| FAM76A | SNV | Missense_Mutation | c.985A>T | p.Ser329Cys | p.S329C | Q8TAV0 | protein_coding | deleterious(0.02) | possibly_damaging(0.819) | TCGA-78-7536-01 | Lung | lung adenocarcinoma | Male | >=65 | III/IV | Unknown | Unknown | PD |
| Page: 1 2 |
Top |
Related drugs of malignant transformation related genes |
| Identification of chemicals and drugs interact with genes involved in malignant transfromation |
| (DGIdb 4.0) |
| Entrez ID | Symbol | Category | Interaction Types | Drug Claim Name | Drug Name | PMIDs |
| Page: 1 |

Copyright 2023-Present -The University of Texas Health Science Center at Houston |