
|
|||||
|
 | |
| |
| |
| |
| |
| |
|
Gene: FAM69A |
Gene summary for FAM69A |
| Gene information | Species | Human | Gene symbol | FAM69A | Gene ID | 388650 |
| Gene name | divergent protein kinase domain 1A | |
| Gene Alias | FAM69A | |
| Cytomap | 1p22.1 | |
| Gene Type | protein-coding | GO ID | GO:0005575 | UniProtAcc | Q5T7M9 |
Top |
Malignant transformation analysis |
| Identification of the aberrant gene expression in precancerous and cancerous lesions by comparing the gene expression of stem-like cells in diseased tissues with normal stem cells |
| Entrez ID | Symbol | Replicates | Species | Organ | Tissue | Adj P-value | Log2FC | Malignancy |
| 388650 | FAM69A | HTA11_3410_2000001011 | Human | Colorectum | AD | 5.81e-23 | -6.17e-01 | 0.0155 |
| 388650 | FAM69A | HTA11_2487_2000001011 | Human | Colorectum | SER | 1.96e-13 | -6.17e-01 | -0.1808 |
| 388650 | FAM69A | HTA11_2951_2000001011 | Human | Colorectum | AD | 2.38e-02 | -6.17e-01 | 0.0216 |
| 388650 | FAM69A | HTA11_1938_2000001011 | Human | Colorectum | AD | 4.52e-10 | -6.17e-01 | -0.0811 |
| 388650 | FAM69A | HTA11_78_2000001011 | Human | Colorectum | AD | 6.67e-16 | -6.17e-01 | -0.1088 |
| 388650 | FAM69A | HTA11_347_2000001011 | Human | Colorectum | AD | 1.13e-24 | -6.17e-01 | -0.1954 |
| 388650 | FAM69A | HTA11_3361_2000001011 | Human | Colorectum | AD | 1.75e-10 | -6.17e-01 | -0.1207 |
| 388650 | FAM69A | HTA11_83_2000001011 | Human | Colorectum | SER | 2.89e-08 | -6.17e-01 | -0.1526 |
| 388650 | FAM69A | HTA11_696_2000001011 | Human | Colorectum | AD | 8.80e-32 | -6.17e-01 | -0.1464 |
| 388650 | FAM69A | HTA11_866_2000001011 | Human | Colorectum | AD | 5.24e-29 | -6.17e-01 | -0.1001 |
| 388650 | FAM69A | HTA11_1391_2000001011 | Human | Colorectum | AD | 1.52e-18 | -6.17e-01 | -0.059 |
| 388650 | FAM69A | HTA11_2992_2000001011 | Human | Colorectum | SER | 2.29e-03 | -6.17e-01 | -0.1706 |
| 388650 | FAM69A | HTA11_5212_2000001011 | Human | Colorectum | AD | 4.13e-04 | -6.17e-01 | -0.2061 |
| 388650 | FAM69A | HTA11_5216_2000001011 | Human | Colorectum | SER | 2.38e-02 | -6.17e-01 | -0.1462 |
| 388650 | FAM69A | HTA11_546_2000001011 | Human | Colorectum | AD | 4.79e-07 | -6.17e-01 | -0.0842 |
| 388650 | FAM69A | HTA11_7862_2000001011 | Human | Colorectum | AD | 1.50e-05 | -6.17e-01 | -0.0179 |
| 388650 | FAM69A | HTA11_866_3004761011 | Human | Colorectum | AD | 3.10e-20 | -6.17e-01 | 0.096 |
| 388650 | FAM69A | HTA11_4255_2000001011 | Human | Colorectum | SER | 2.38e-02 | -6.17e-01 | 0.0446 |
| 388650 | FAM69A | HTA11_8622_2000001021 | Human | Colorectum | SER | 1.78e-04 | -6.17e-01 | 0.0528 |
| 388650 | FAM69A | HTA11_7663_2000001011 | Human | Colorectum | SER | 7.31e-03 | -6.17e-01 | 0.0131 |
| Page: 1 2 3 4 5 |
| Tissue | Expression Dynamics | Abbreviation |
| Colorectum (GSE201348) |  | FAP: Familial adenomatous polyposis |
| CRC: Colorectal cancer | ||
| Colorectum (HTA11) |  | AD: Adenomas |
| SER: Sessile serrated lesions | ||
| MSI-H: Microsatellite-high colorectal cancer | ||
| MSS: Microsatellite stable colorectal cancer | ||
| Esophagus | 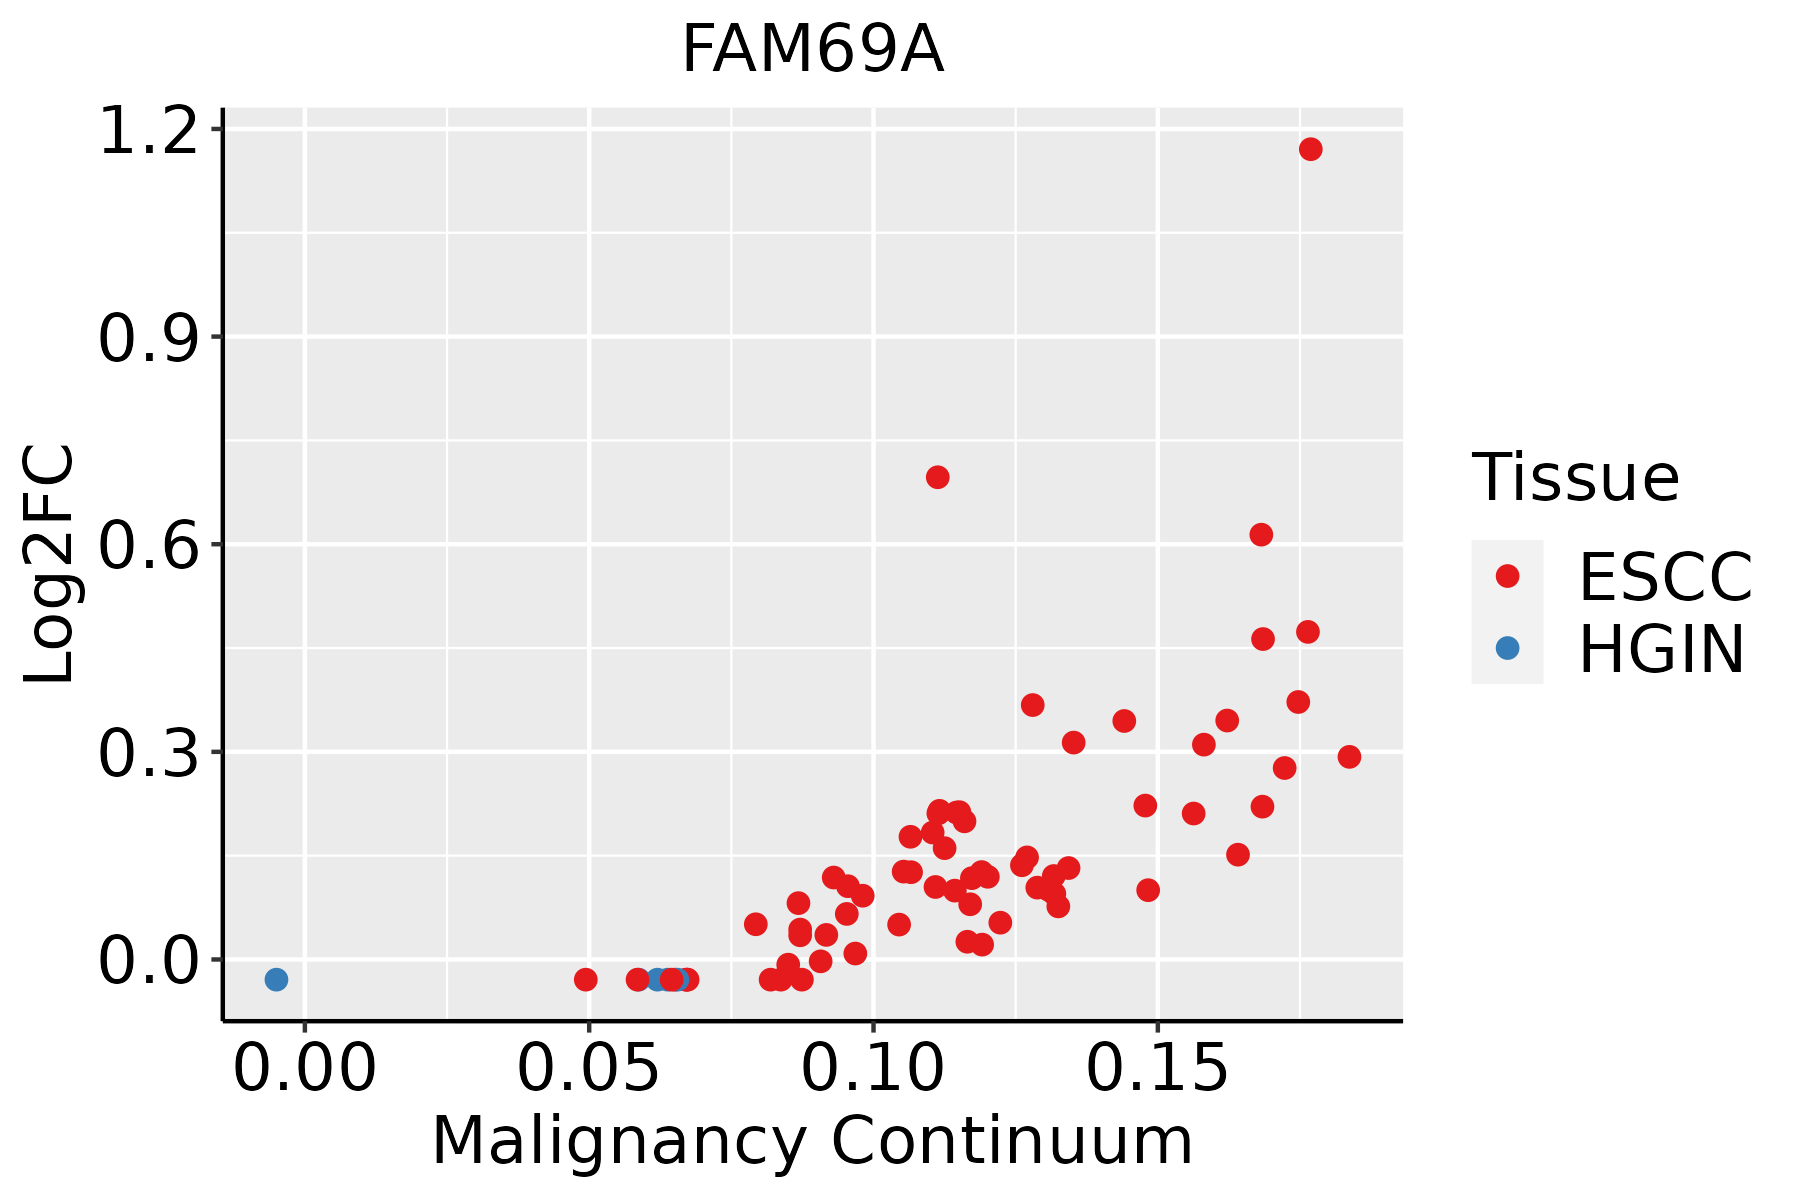 | ESCC: Esophageal squamous cell carcinoma |
| HGIN: High-grade intraepithelial neoplasias | ||
| LGIN: Low-grade intraepithelial neoplasias |
| ∗log2FC in expression of this searched gene in stem-like cells from each diseased tissue sample relative to stem-like cells in normal samples in each tissue plotted against the malignancy continuum. Samples are colored based on if they are from different disease stage. |
Top |
Malignant transformation related pathway analysis |
| Find out the enriched GO biological processes and KEGG pathways involved in transition from healthy to precancer to cancer |
| Tissue | Disease Stage | Enriched GO biological Processes |
| Colorectum | AD |  |
| Colorectum | SER |  |
| Colorectum | MSS |  |
| Colorectum | MSI-H |  |
| Colorectum | FAP |  |
| ∗Top 15 enriched GO BP terms are showed in the bar plot of each disease state in each tissue. Each row represents a significant GO biological process which is colored according to the -log10(p.adjust). |
| Page: 1 2 3 4 5 6 7 8 9 |
| GO ID | Tissue | Disease Stage | Description | Gene Ratio | Bg Ratio | pvalue | p.adjust | Count |
| Page: 1 |
| Pathway ID | Tissue | Disease Stage | Description | Gene Ratio | Bg Ratio | pvalue | p.adjust | qvalue | Count |
| Page: 1 |
Top |
Cell-cell communication analysis |
| Identification of potential cell-cell interactions between two cell types and their ligand-receptor pairs for different disease states |
| Ligand | Receptor | LRpair | Pathway | Tissue | Disease Stage |
| Page: 1 |
Top |
Single-cell gene regulatory network inference analysis |
| Find out the significant the regulons (TFs) and the target genes of each regulon across cell types for different disease states |
| TF | Cell Type | Tissue | Disease Stage | Target Gene | RSS | Regulon Activity |
| ∗The dot plots of a searched regulon are shown for all cell subpopulations in each disease state of each tissue based on the regulon specific score inferred using pySCENIC and by calculating the average expression. |
| Page: 1 |
Top |
Somatic mutation of malignant transformation related genes |
| Annotation of somatic variants for genes involved in malignant transformation |
| Hugo Symbol | Variant Class | Variant Classification | dbSNP RS | HGVSc | HGVSp | HGVSp Short | SWISSPROT | BIOTYPE | SIFT | PolyPhen | Tumor Sample Barcode | Tissue | Histology | Sex | Age | Stage | Therapy Types | Drugs | Outcome |
| FAM69A | SNV | Missense_Mutation | novel | c.764N>C | p.Arg255Thr | p.R255T | Q5T7M9 | protein_coding | tolerated(0.16) | possibly_damaging(0.673) | TCGA-A2-A3Y0-01 | Breast | breast invasive carcinoma | Female | <65 | I/II | Chemotherapy | adriamycin | CR |
| FAM69A | deletion | Frame_Shift_Del | novel | c.404delT | p.Val135GlyfsTer41 | p.V135Gfs*41 | Q5T7M9 | protein_coding | TCGA-D8-A27V-01 | Breast | breast invasive carcinoma | Female | <65 | I/II | Hormone Therapy | tamoxiphen | SD | ||
| FAM69A | insertion | Frame_Shift_Ins | novel | c.1011dupT | p.Val338CysfsTer7 | p.V338Cfs*7 | Q5T7M9 | protein_coding | TCGA-EW-A6SB-01 | Breast | breast invasive carcinoma | Female | <65 | I/II | Unknown | Unknown | SD | ||
| FAM69A | SNV | Missense_Mutation | novel | c.421A>G | p.Thr141Ala | p.T141A | Q5T7M9 | protein_coding | deleterious(0.05) | benign(0.22) | TCGA-MA-AA3X-01 | Cervix | cervical & endocervical cancer | Female | <65 | III/IV | Chemotherapy | cisplatin | CR |
| FAM69A | SNV | Missense_Mutation | novel | c.379N>A | p.Glu127Lys | p.E127K | Q5T7M9 | protein_coding | tolerated(0.06) | benign(0.081) | TCGA-VS-A8EC-01 | Cervix | cervical & endocervical cancer | Female | <65 | III/IV | Chemotherapy | carboplatin | CR |
| FAM69A | SNV | Missense_Mutation | novel | c.446N>C | p.Phe149Ser | p.F149S | Q5T7M9 | protein_coding | deleterious(0.02) | probably_damaging(0.991) | TCGA-CA-6717-01 | Colorectum | colon adenocarcinoma | Male | <65 | I/II | Chemotherapy | oxaliplatin | CR |
| FAM69A | SNV | Missense_Mutation | rs375926241 | c.401N>C | p.Ile134Thr | p.I134T | Q5T7M9 | protein_coding | tolerated(0.62) | benign(0) | TCGA-CK-5916-01 | Colorectum | colon adenocarcinoma | Female | >=65 | I/II | Unknown | Unknown | PD |
| FAM69A | SNV | Missense_Mutation | c.844G>A | p.Val282Ile | p.V282I | Q5T7M9 | protein_coding | tolerated(1) | benign(0.007) | TCGA-DM-A1HB-01 | Colorectum | colon adenocarcinoma | Male | >=65 | III/IV | Unknown | Unknown | SD | |
| FAM69A | SNV | Missense_Mutation | c.466C>A | p.Leu156Ile | p.L156I | Q5T7M9 | protein_coding | deleterious(0.02) | benign(0.027) | TCGA-AG-A002-01 | Colorectum | rectum adenocarcinoma | Male | <65 | I/II | Unknown | Unknown | SD | |
| FAM69A | deletion | Frame_Shift_Del | c.482delT | p.Leu161TrpfsTer15 | p.L161Wfs*15 | Q5T7M9 | protein_coding | TCGA-AA-3710-01 | Colorectum | colon adenocarcinoma | Female | >=65 | I/II | Unknown | Unknown | SD |
| Page: 1 2 3 4 5 |
Top |
Related drugs of malignant transformation related genes |
| Identification of chemicals and drugs interact with genes involved in malignant transfromation |
| (DGIdb 4.0) |
| Entrez ID | Symbol | Category | Interaction Types | Drug Claim Name | Drug Name | PMIDs |
| Page: 1 |

Copyright 2023-Present -The University of Texas Health Science Center at Houston |